Garrison, KY Map & Demographics
Garrison Map
Garrison Overview
$17,551
PER CAPITA INCOME
$40,156
AVG HOUSEHOLD INCOME
0.48
INEQUALITY / GINI INDEX
888
TOTAL POPULATION
419
MALE POPULATION
469
FEMALE POPULATION
89.34
MALES / 100 FEMALES
111.93
FEMALES / 100 MALES
55.7
MEDIAN AGE
4.2
AVG FAMILY SIZE
3.3
AVG HOUSEHOLD SIZE
177
LABOR FORCE [ PEOPLE ]
25.1%
PERCENT IN LABOR FORCE
6.8%
UNEMPLOYMENT RATE
Garrison Zip Codes
Garrison Area Codes
Income in Garrison
Income Overview in Garrison
| Characteristic | Number | Measure |
| Per Capita Income | 888 | $17,551 |
| Median Family Income | 191 | $0 |
| Mean Family Income | 191 | $62,722 |
| Median Household Income | 269 | $40,156 |
| Mean Household Income | 269 | $55,766 |
| Income Deficit | 191 | $0 |
| Wage / Income Gap (%) | 888 | 0.00% |
| Wage / Income Gap ($) | 888 | 100.00¢ per $1 |
| Gini / Inequality Index | 888 | 0.48 |
Earnings by Sex in Garrison
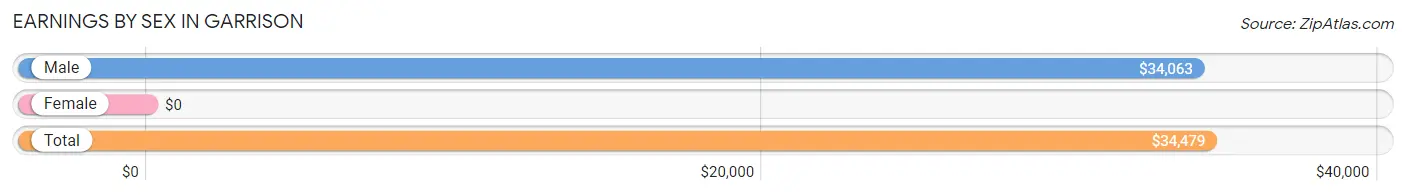
| Sex | Number | Average Earnings |
| Male | 139 (67.8%) | $34,063 |
| Female | 66 (32.2%) | $0 |
| Total | 205 (100.0%) | $34,479 |
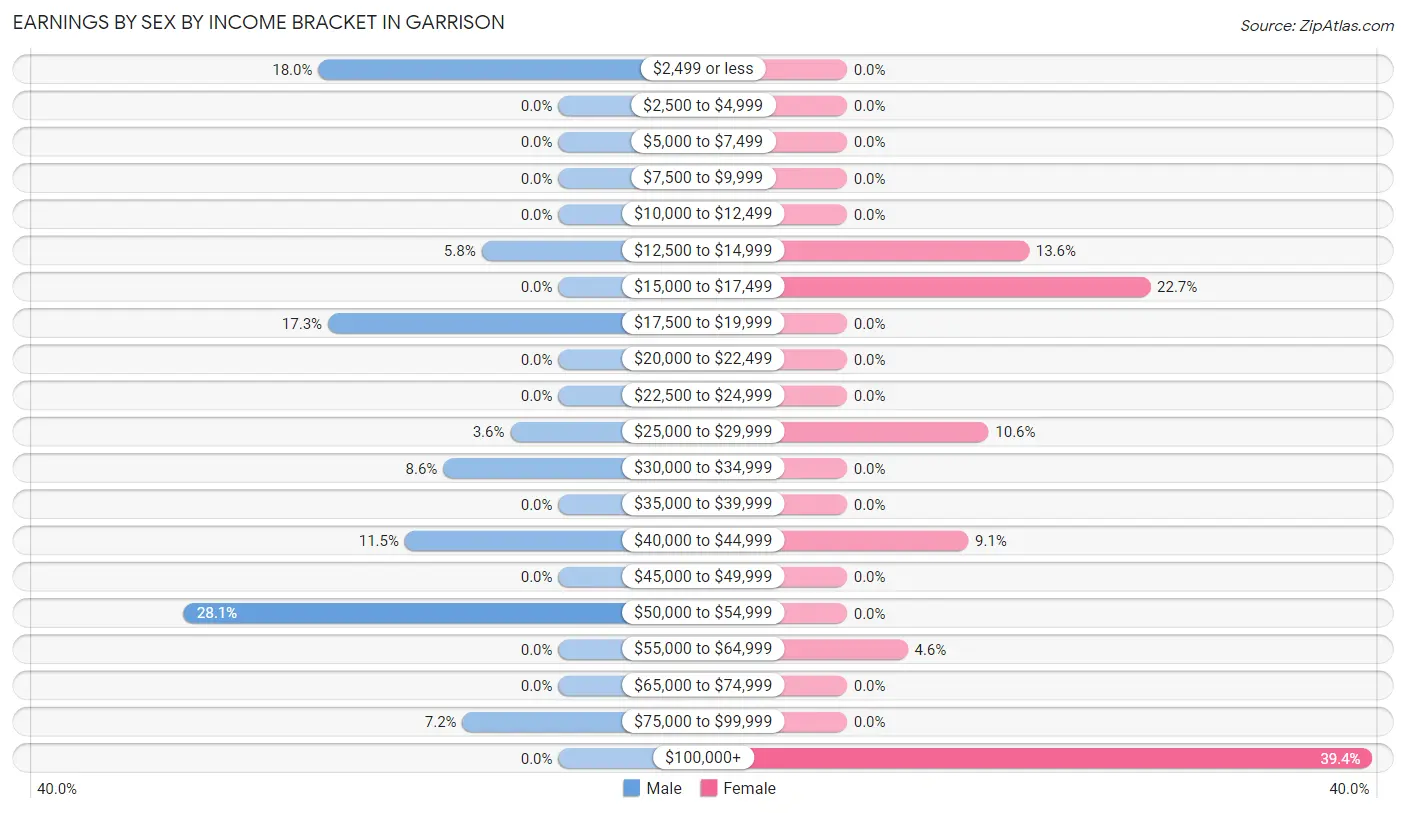
Earnings by Sex by Income Bracket in Garrison
The most common earnings brackets in Garrison are $50,000 to $54,999 for men (39 | 28.1%) and $100,000+ for women (26 | 39.4%).
| Income | Male | Female |
| $2,499 or less | 25 (18.0%) | 0 (0.0%) |
| $2,500 to $4,999 | 0 (0.0%) | 0 (0.0%) |
| $5,000 to $7,499 | 0 (0.0%) | 0 (0.0%) |
| $7,500 to $9,999 | 0 (0.0%) | 0 (0.0%) |
| $10,000 to $12,499 | 0 (0.0%) | 0 (0.0%) |
| $12,500 to $14,999 | 8 (5.8%) | 9 (13.6%) |
| $15,000 to $17,499 | 0 (0.0%) | 15 (22.7%) |
| $17,500 to $19,999 | 24 (17.3%) | 0 (0.0%) |
| $20,000 to $22,499 | 0 (0.0%) | 0 (0.0%) |
| $22,500 to $24,999 | 0 (0.0%) | 0 (0.0%) |
| $25,000 to $29,999 | 5 (3.6%) | 7 (10.6%) |
| $30,000 to $34,999 | 12 (8.6%) | 0 (0.0%) |
| $35,000 to $39,999 | 0 (0.0%) | 0 (0.0%) |
| $40,000 to $44,999 | 16 (11.5%) | 6 (9.1%) |
| $45,000 to $49,999 | 0 (0.0%) | 0 (0.0%) |
| $50,000 to $54,999 | 39 (28.1%) | 0 (0.0%) |
| $55,000 to $64,999 | 0 (0.0%) | 3 (4.5%) |
| $65,000 to $74,999 | 0 (0.0%) | 0 (0.0%) |
| $75,000 to $99,999 | 10 (7.2%) | 0 (0.0%) |
| $100,000+ | 0 (0.0%) | 26 (39.4%) |
| Total | 139 (100.0%) | 66 (100.0%) |
Earnings by Sex by Educational Attainment in Garrison
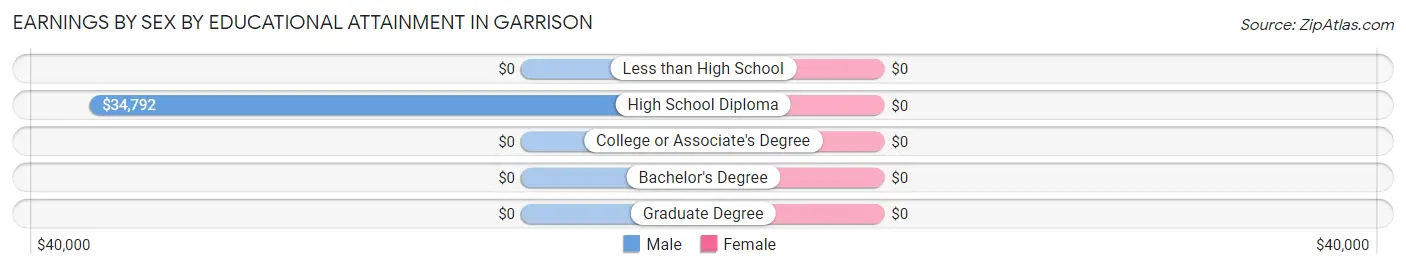
| Educational Attainment | Male Income | Female Income |
| Less than High School | - | - |
| High School Diploma | $34,792 | $0 |
| College or Associate's Degree | - | - |
| Bachelor's Degree | - | - |
| Graduate Degree | - | - |
| Total | $41,250 | $0 |
Family Income in Garrison
Family Income Brackets in Garrison
According to the Garrison family income data, there are 39 families falling into the $50,000 to $74,999 income range, which is the most common income bracket and makes up 20.4% of all families.
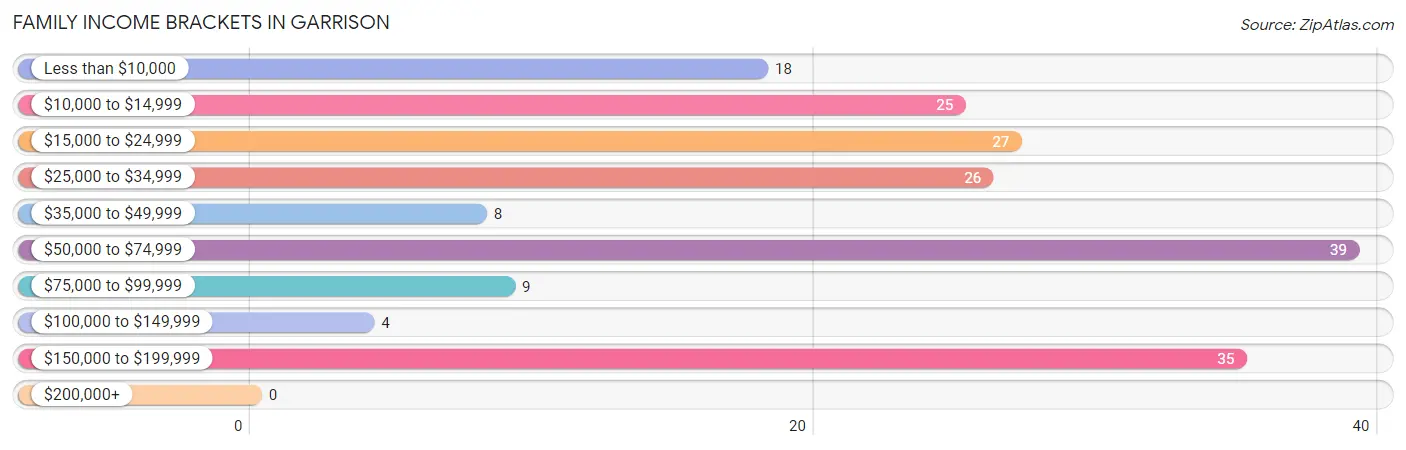
| Income Bracket | # Families | % Families |
| Less than $10,000 | 18 | 9.4% |
| $10,000 to $14,999 | 25 | 13.1% |
| $15,000 to $24,999 | 27 | 14.1% |
| $25,000 to $34,999 | 26 | 13.6% |
| $35,000 to $49,999 | 8 | 4.2% |
| $50,000 to $74,999 | 39 | 20.4% |
| $75,000 to $99,999 | 9 | 4.7% |
| $100,000 to $149,999 | 4 | 2.1% |
| $150,000 to $199,999 | 35 | 18.3% |
| $200,000+ | 0 | 0.0% |
Family Income by Famaliy Size in Garrison
3-person families (55 | 28.8%) account for the highest median family income in Garrison with $178,036 per family, while 3-person families (55 | 28.8%) have the highest median income of $59,345 per family member.
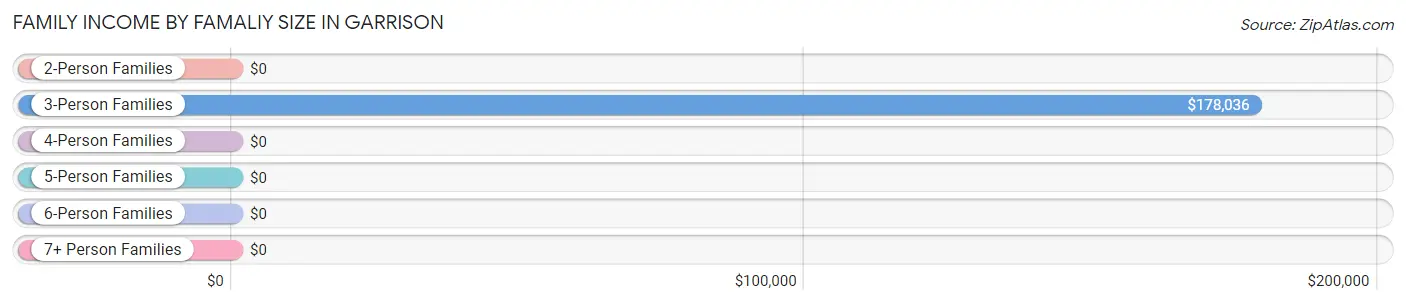
| Income Bracket | # Families | Median Income |
| 2-Person Families | 77 (40.3%) | $0 |
| 3-Person Families | 55 (28.8%) | $178,036 |
| 4-Person Families | 21 (11.0%) | $0 |
| 5-Person Families | 13 (6.8%) | $0 |
| 6-Person Families | 0 (0.0%) | $0 |
| 7+ Person Families | 25 (13.1%) | $0 |
| Total | 191 (100.0%) | $0 |
Family Income by Number of Earners in Garrison
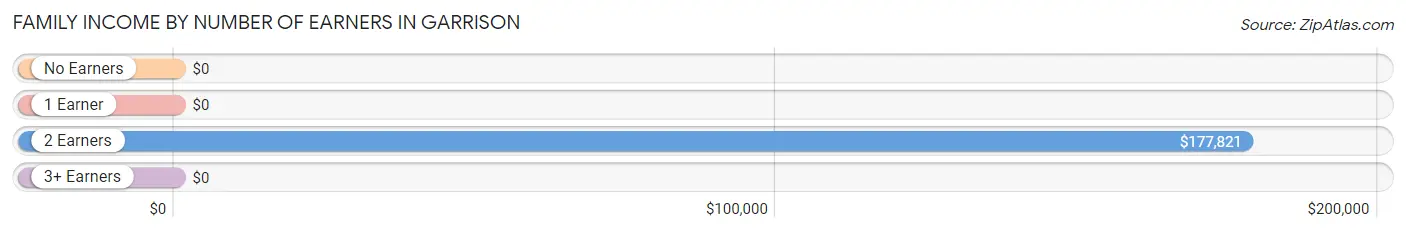
| Number of Earners | # Families | Median Income |
| No Earners | 79 (41.4%) | $0 |
| 1 Earner | 51 (26.7%) | $0 |
| 2 Earners | 61 (31.9%) | $177,821 |
| 3+ Earners | 0 (0.0%) | $0 |
| Total | 191 (100.0%) | $0 |
Household Income in Garrison
Household Income Brackets in Garrison
With 66 households falling in the category, the $15,000 to $24,999 income range is the most frequent in Garrison, accounting for 24.5% of all households.
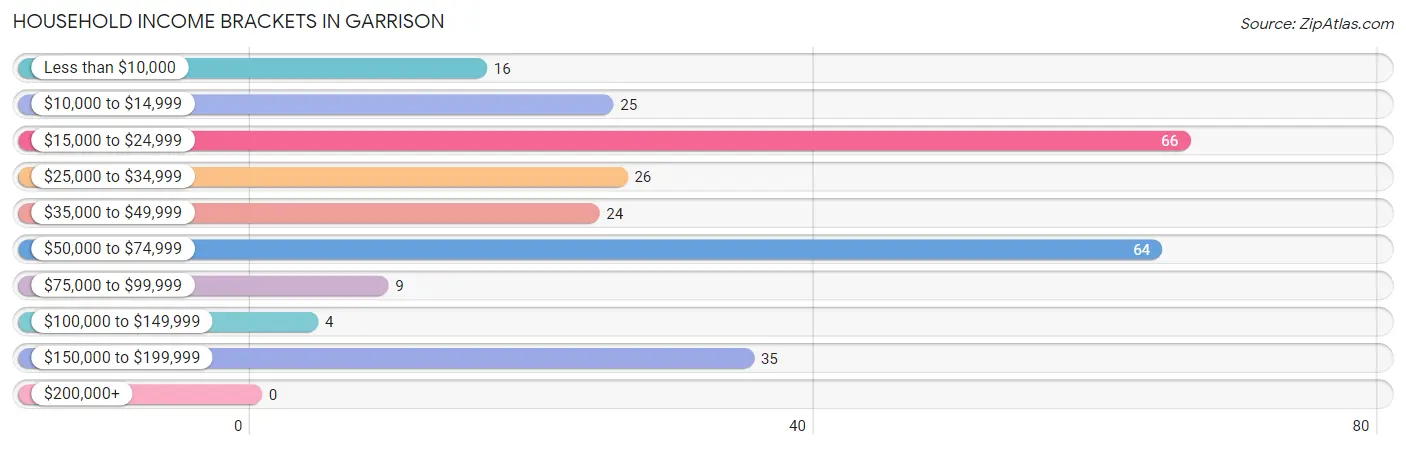
| Income Bracket | # Households | % Households |
| Less than $10,000 | 16 | 5.9% |
| $10,000 to $14,999 | 25 | 9.3% |
| $15,000 to $24,999 | 66 | 24.5% |
| $25,000 to $34,999 | 26 | 9.7% |
| $35,000 to $49,999 | 24 | 8.9% |
| $50,000 to $74,999 | 64 | 23.8% |
| $75,000 to $99,999 | 9 | 3.3% |
| $100,000 to $149,999 | 4 | 1.5% |
| $150,000 to $199,999 | 35 | 13.0% |
| $200,000+ | 0 | 0.0% |
Household Income by Householder Age in Garrison
The median household income in Garrison is $40,156, with the highest median household income of $62,000 found in the 65+ years age bracket for the primary householder. A total of 86 households (32.0%) fall into this category.
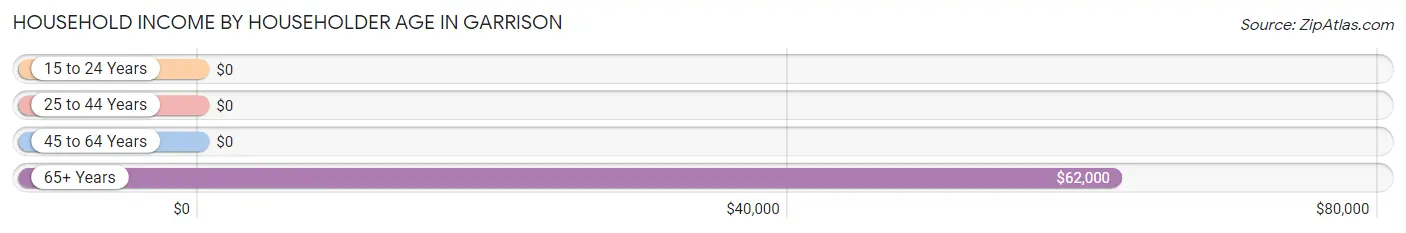
| Income Bracket | # Households | Median Income |
| 15 to 24 Years | 0 (0.0%) | $0 |
| 25 to 44 Years | 40 (14.9%) | $0 |
| 45 to 64 Years | 143 (53.2%) | $0 |
| 65+ Years | 86 (32.0%) | $62,000 |
| Total | 269 (100.0%) | $40,156 |
Poverty in Garrison
Income Below Poverty by Sex and Age in Garrison
With 41.5% poverty level for males and 43.9% for females among the residents of Garrison, 18 to 24 year old males and 12 to 14 year old females are the most vulnerable to poverty, with 25 males (100.0%) and 3 females (100.0%) in their respective age groups living below the poverty level.
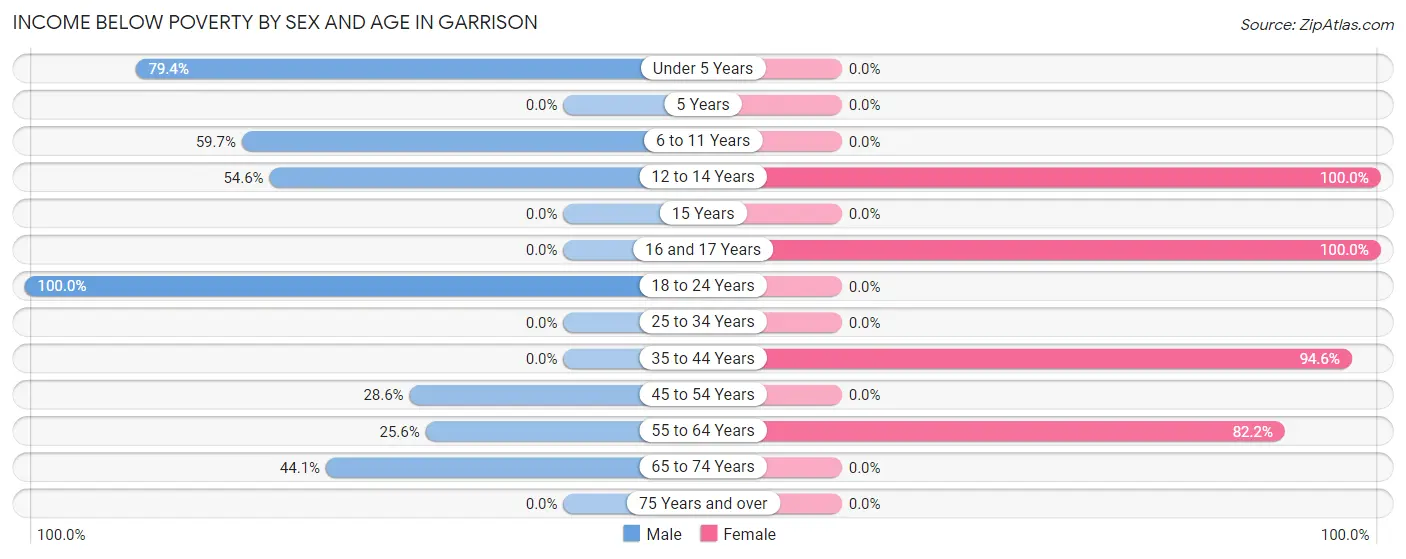
| Age Bracket | Male | Female |
| Under 5 Years | 27 (79.4%) | 0 (0.0%) |
| 5 Years | 0 (0.0%) | 0 (0.0%) |
| 6 to 11 Years | 40 (59.7%) | 0 (0.0%) |
| 12 to 14 Years | 18 (54.5%) | 3 (100.0%) |
| 15 Years | 0 (0.0%) | 0 (0.0%) |
| 16 and 17 Years | 0 (0.0%) | 16 (100.0%) |
| 18 to 24 Years | 25 (100.0%) | 0 (0.0%) |
| 25 to 34 Years | 0 (0.0%) | 0 (0.0%) |
| 35 to 44 Years | 0 (0.0%) | 53 (94.6%) |
| 45 to 54 Years | 16 (28.6%) | 0 (0.0%) |
| 55 to 64 Years | 22 (25.6%) | 134 (82.2%) |
| 65 to 74 Years | 26 (44.1%) | 0 (0.0%) |
| 75 Years and over | 0 (0.0%) | 0 (0.0%) |
| Total | 174 (41.5%) | 206 (43.9%) |
Income Above Poverty by Sex and Age in Garrison
According to the poverty statistics in Garrison, males aged 5 years and females aged under 5 years are the age groups that are most secure financially, with 100.0% of males and 100.0% of females in these age groups living above the poverty line.
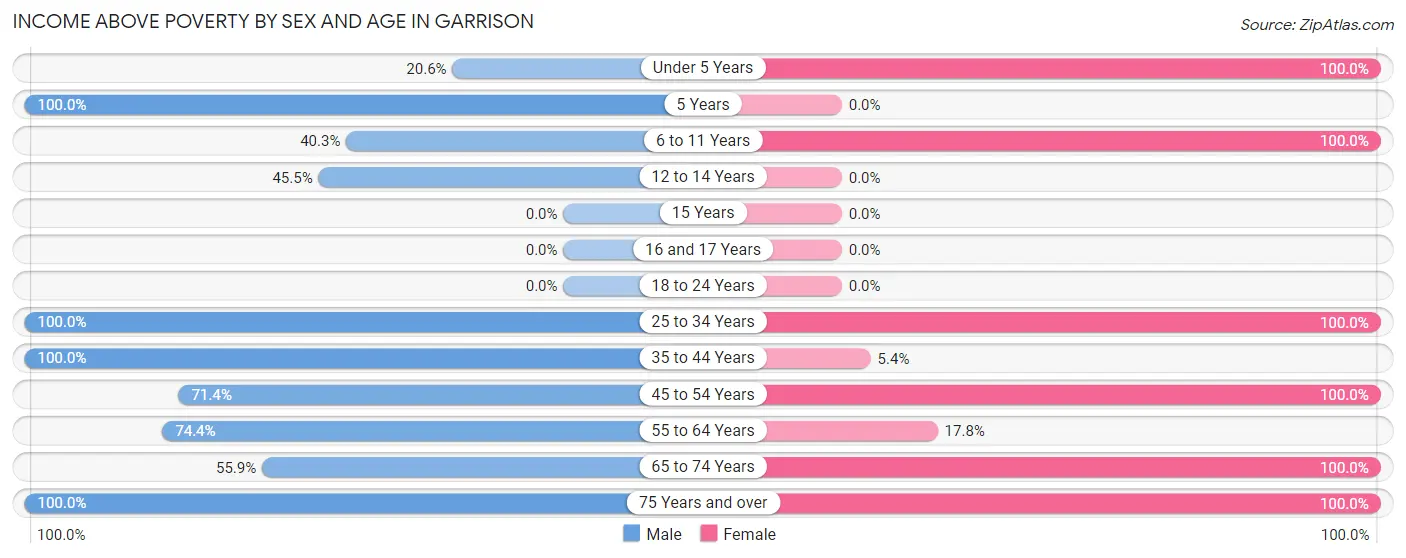
| Age Bracket | Male | Female |
| Under 5 Years | 7 (20.6%) | 16 (100.0%) |
| 5 Years | 6 (100.0%) | 0 (0.0%) |
| 6 to 11 Years | 27 (40.3%) | 24 (100.0%) |
| 12 to 14 Years | 15 (45.5%) | 0 (0.0%) |
| 15 Years | 0 (0.0%) | 0 (0.0%) |
| 16 and 17 Years | 0 (0.0%) | 0 (0.0%) |
| 18 to 24 Years | 0 (0.0%) | 0 (0.0%) |
| 25 to 34 Years | 25 (100.0%) | 33 (100.0%) |
| 35 to 44 Years | 14 (100.0%) | 3 (5.4%) |
| 45 to 54 Years | 40 (71.4%) | 26 (100.0%) |
| 55 to 64 Years | 64 (74.4%) | 29 (17.8%) |
| 65 to 74 Years | 33 (55.9%) | 43 (100.0%) |
| 75 Years and over | 14 (100.0%) | 89 (100.0%) |
| Total | 245 (58.5%) | 263 (56.1%) |
Income Below Poverty Among Married-Couple Families in Garrison
The poverty statistics for married-couple families in Garrison show that 17.1% or 25 of the total 146 families live below the poverty line. Families with 5 or more children have the highest poverty rate of 100.0%, comprising of 25 families. On the other hand, families with no children have the lowest poverty rate of 0.0%, which includes 0 families.
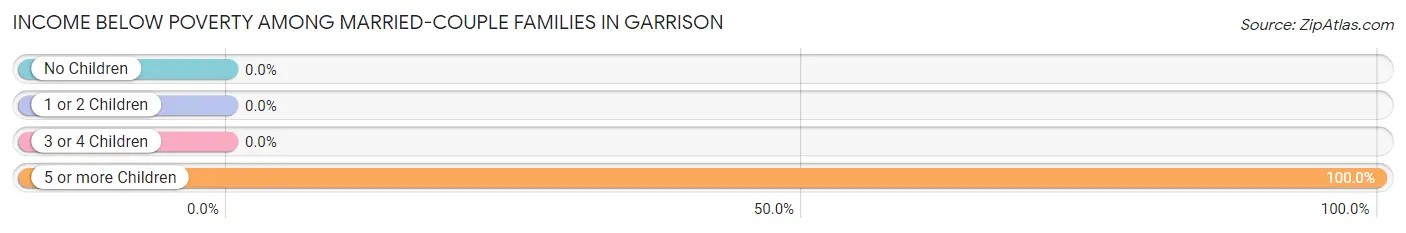
| Children | Above Poverty | Below Poverty |
| No Children | 83 (100.0%) | 0 (0.0%) |
| 1 or 2 Children | 25 (100.0%) | 0 (0.0%) |
| 3 or 4 Children | 13 (100.0%) | 0 (0.0%) |
| 5 or more Children | 0 (0.0%) | 25 (100.0%) |
| Total | 121 (82.9%) | 25 (17.1%) |
Income Below Poverty Among Single-Parent Households in Garrison
According to the poverty data in Garrison, 100.0% or 38 single-father households and 28.6% or 2 single-mother households are living below the poverty line. Among single-father households, those with no children have the highest poverty rate, with 22 households (100.0%) experiencing poverty. Likewise, among single-mother households, those with 1 or 2 children have the highest poverty rate, with 2 households (100.0%) falling below the poverty line.
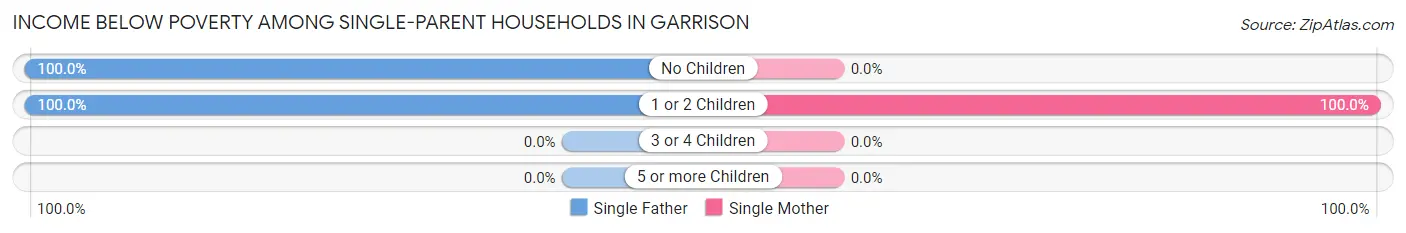
| Children | Single Father | Single Mother |
| No Children | 22 (100.0%) | 0 (0.0%) |
| 1 or 2 Children | 16 (100.0%) | 2 (100.0%) |
| 3 or 4 Children | 0 (0.0%) | 0 (0.0%) |
| 5 or more Children | 0 (0.0%) | 0 (0.0%) |
| Total | 38 (100.0%) | 2 (28.6%) |
Income Below Poverty Among Married-Couple vs Single-Parent Households in Garrison
The poverty data for Garrison shows that 25 of the married-couple family households (17.1%) and 40 of the single-parent households (88.9%) are living below the poverty level. Within the married-couple family households, those with 5 or more children have the highest poverty rate, with 25 households (100.0%) falling below the poverty line. Among the single-parent households, those with 1 or 2 children have the highest poverty rate, with 18 household (100.0%) living below poverty.
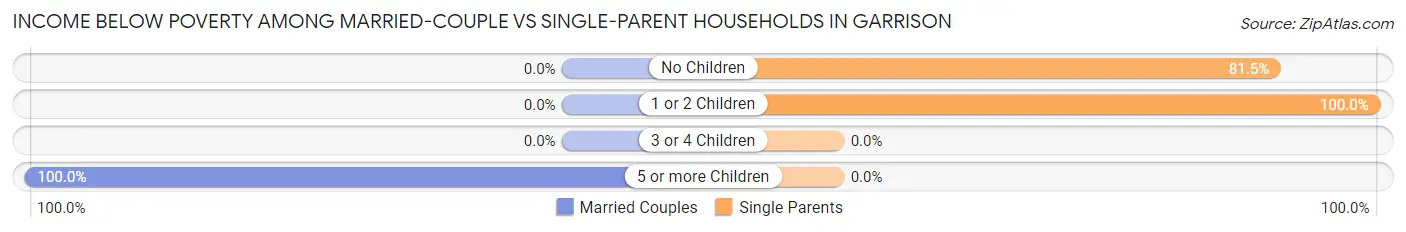
| Children | Married-Couple Families | Single-Parent Households |
| No Children | 0 (0.0%) | 22 (81.5%) |
| 1 or 2 Children | 0 (0.0%) | 18 (100.0%) |
| 3 or 4 Children | 0 (0.0%) | 0 (0.0%) |
| 5 or more Children | 25 (100.0%) | 0 (0.0%) |
| Total | 25 (17.1%) | 40 (88.9%) |
Race in Garrison
The most populous races in Garrison are , and White / Caucasian (888 | 100.0%).
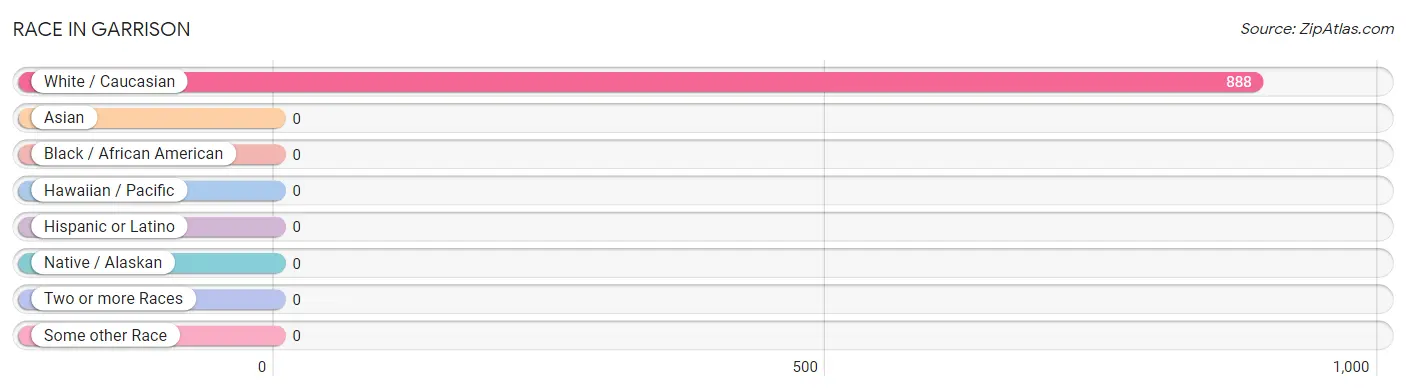
| Race | # Population | % Population |
| Asian | 0 | 0.0% |
| Black / African American | 0 | 0.0% |
| Hawaiian / Pacific | 0 | 0.0% |
| Hispanic or Latino | 0 | 0.0% |
| Native / Alaskan | 0 | 0.0% |
| White / Caucasian | 888 | 100.0% |
| Two or more Races | 0 | 0.0% |
| Some other Race | 0 | 0.0% |
| Total | 888 | 100.0% |
Ancestry in Garrison
The most populous ancestries reported in Garrison are German (321 | 36.1%), American (277 | 31.2%), English (229 | 25.8%), Irish (184 | 20.7%), and Greek (22 | 2.5%), together accounting for 116.3% of all Garrison residents.
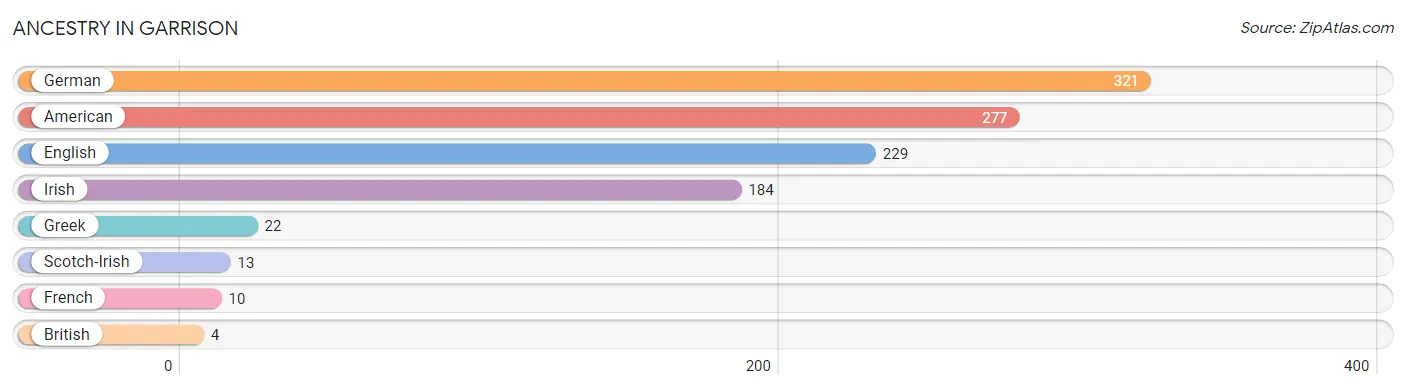
| Ancestry | # Population | % Population |
| American | 277 | 31.2% |
| British | 4 | 0.4% |
| English | 229 | 25.8% |
| French | 10 | 1.1% |
| German | 321 | 36.1% |
| Greek | 22 | 2.5% |
| Irish | 184 | 20.7% |
| Scotch-Irish | 13 | 1.5% | View All 8 Rows |
Immigrants in Garrison

| Immigration Origin | # Population | % Population | View All 0 Rows |
Sex and Age in Garrison
Sex and Age in Garrison
The most populous age groups in Garrison are 55 to 59 Years (72 | 17.2%) for men and 60 to 64 Years (134 | 28.6%) for women.
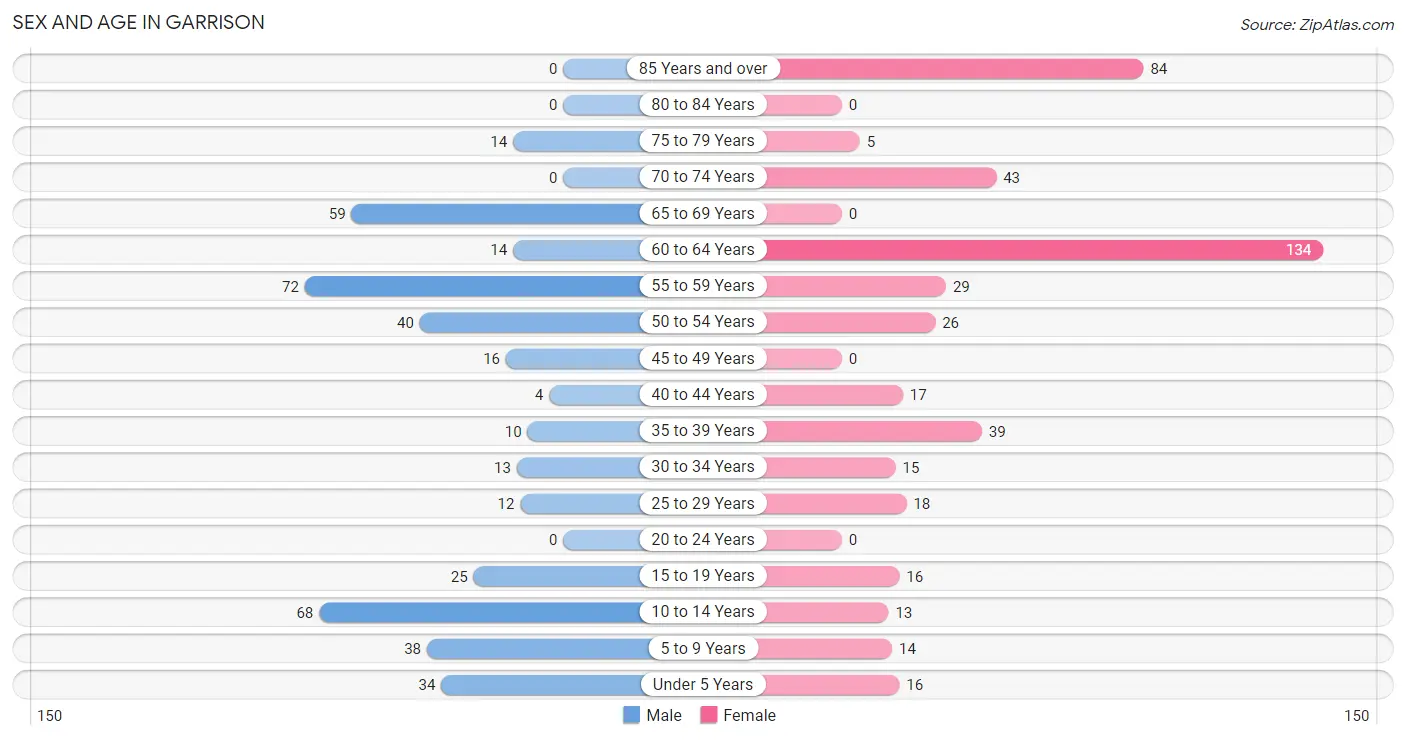
| Age Bracket | Male | Female |
| Under 5 Years | 34 (8.1%) | 16 (3.4%) |
| 5 to 9 Years | 38 (9.1%) | 14 (3.0%) |
| 10 to 14 Years | 68 (16.2%) | 13 (2.8%) |
| 15 to 19 Years | 25 (6.0%) | 16 (3.4%) |
| 20 to 24 Years | 0 (0.0%) | 0 (0.0%) |
| 25 to 29 Years | 12 (2.9%) | 18 (3.8%) |
| 30 to 34 Years | 13 (3.1%) | 15 (3.2%) |
| 35 to 39 Years | 10 (2.4%) | 39 (8.3%) |
| 40 to 44 Years | 4 (0.9%) | 17 (3.6%) |
| 45 to 49 Years | 16 (3.8%) | 0 (0.0%) |
| 50 to 54 Years | 40 (9.6%) | 26 (5.5%) |
| 55 to 59 Years | 72 (17.2%) | 29 (6.2%) |
| 60 to 64 Years | 14 (3.3%) | 134 (28.6%) |
| 65 to 69 Years | 59 (14.1%) | 0 (0.0%) |
| 70 to 74 Years | 0 (0.0%) | 43 (9.2%) |
| 75 to 79 Years | 14 (3.3%) | 5 (1.1%) |
| 80 to 84 Years | 0 (0.0%) | 0 (0.0%) |
| 85 Years and over | 0 (0.0%) | 84 (17.9%) |
| Total | 419 (100.0%) | 469 (100.0%) |
Families and Households in Garrison
Median Family Size in Garrison
The median family size in Garrison is 4.16 persons per family, with single male/father families (38 | 19.9%) accounting for the largest median family size of 4.29 persons per family. On the other hand, single female/mother families (7 | 3.7%) represent the smallest median family size with 4.00 persons per family.
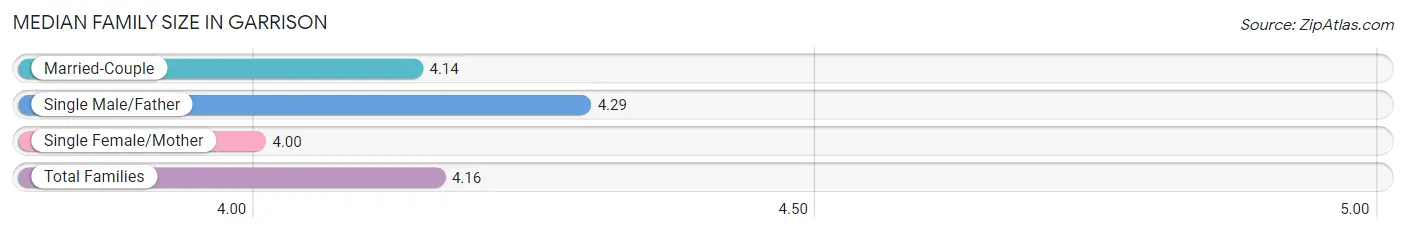
| Family Type | # Families | Family Size |
| Married-Couple | 146 (76.4%) | 4.14 |
| Single Male/Father | 38 (19.9%) | 4.29 |
| Single Female/Mother | 7 (3.7%) | 4.00 |
| Total Families | 191 (100.0%) | 4.16 |
Median Household Size in Garrison
The median household size in Garrison is 3.30 persons per household, with single female/mother households (7 | 2.6%) accounting for the largest median household size of 4.43 persons per household. non-family households (78 | 29.0%) represent the smallest median household size with 1.15 persons per household.
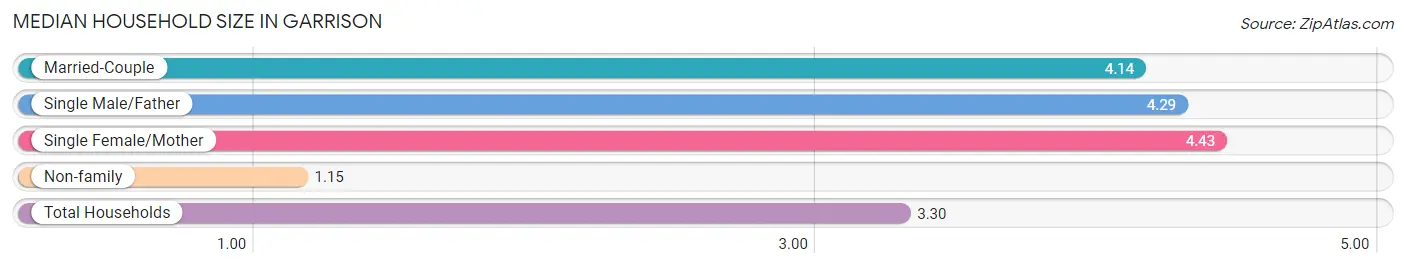
| Household Type | # Households | Household Size |
| Married-Couple | 146 (54.3%) | 4.14 |
| Single Male/Father | 38 (14.1%) | 4.29 |
| Single Female/Mother | 7 (2.6%) | 4.43 |
| Non-family | 78 (29.0%) | 1.15 |
| Total Households | 269 (100.0%) | 3.30 |
Household Size by Marriage Status in Garrison
Out of a total of 269 households in Garrison, 191 (71.0%) are family households, while 78 (29.0%) are nonfamily households. The most numerous type of family households are 2-person households, comprising 77, and the most common type of nonfamily households are 1-person households, comprising 62.
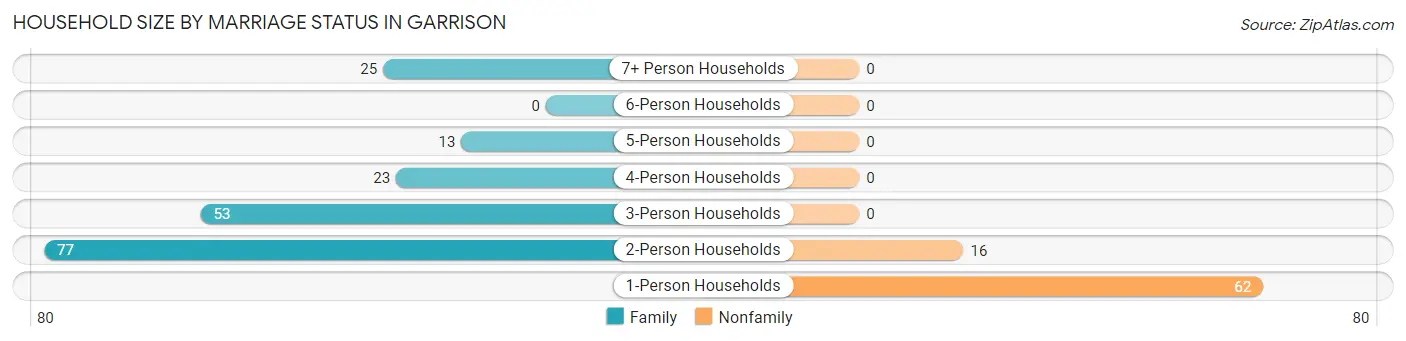
| Household Size | Family Households | Nonfamily Households |
| 1-Person Households | - | 62 (23.1%) |
| 2-Person Households | 77 (28.6%) | 16 (5.9%) |
| 3-Person Households | 53 (19.7%) | 0 (0.0%) |
| 4-Person Households | 23 (8.6%) | 0 (0.0%) |
| 5-Person Households | 13 (4.8%) | 0 (0.0%) |
| 6-Person Households | 0 (0.0%) | 0 (0.0%) |
| 7+ Person Households | 25 (9.3%) | 0 (0.0%) |
| Total | 191 (71.0%) | 78 (29.0%) |
Female Fertility in Garrison
Fertility by Age in Garrison
| Age Bracket | Women with Births | Births / 1,000 Women |
| 15 to 19 years | 0 (0.0%) | 0.0 |
| 20 to 34 years | 0 (0.0%) | 0.0 |
| 35 to 50 years | 0 (0.0%) | 0.0 |
| Total | 0 (0.0%) | 0.0 |
Fertility by Age by Marriage Status in Garrison
| Age Bracket | Married | Unmarried |
| 15 to 19 years | 0 (0.0%) | 0 (0.0%) |
| 20 to 34 years | 0 (0.0%) | 0 (0.0%) |
| 35 to 50 years | 0 (0.0%) | 0 (0.0%) |
| Total | 0 (0.0%) | 0 (0.0%) |
Fertility by Education in Garrison
| Educational Attainment | Women with Births | Births / 1,000 Women |
| Less than High School | 0 (0.0%) | 0.0 |
| High School Diploma | 0 (0.0%) | 0.0 |
| College or Associate's Degree | 0 (0.0%) | 0.0 |
| Bachelor's Degree | 0 (0.0%) | 0.0 |
| Graduate Degree | 0 (0.0%) | 0.0 |
| Total | 0 (0.0%) | 0.0 |
Fertility by Education by Marriage Status in Garrison
| Educational Attainment | Married | Unmarried |
| Less than High School | 0 (0.0%) | 0 (0.0%) |
| High School Diploma | 0 (0.0%) | 0 (0.0%) |
| College or Associate's Degree | 0 (0.0%) | 0 (0.0%) |
| Bachelor's Degree | 0 (0.0%) | 0 (0.0%) |
| Graduate Degree | 0 (0.0%) | 0 (0.0%) |
| Total | 0 (0.0%) | 0 (0.0%) |
Employment Characteristics in Garrison
Employment by Class of Employer in Garrison
Among the 165 employed individuals in Garrison, self-employed (incorporated) (61 | 37.0%), private company employees (54 | 32.7%), and state government employees (21 | 12.7%) make up the most common classes of employment.
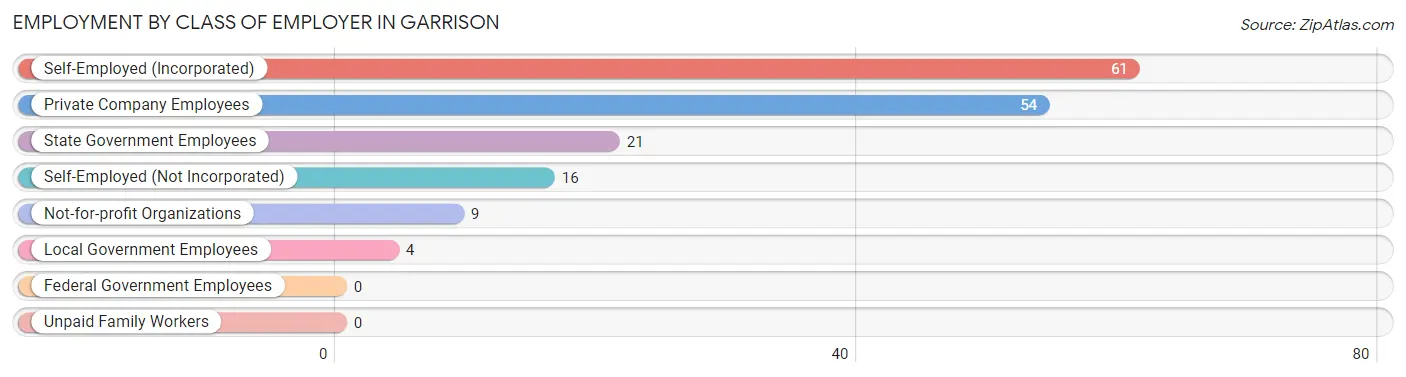
| Employer Class | # Employees | % Employees |
| Private Company Employees | 54 | 32.7% |
| Self-Employed (Incorporated) | 61 | 37.0% |
| Self-Employed (Not Incorporated) | 16 | 9.7% |
| Not-for-profit Organizations | 9 | 5.4% |
| Local Government Employees | 4 | 2.4% |
| State Government Employees | 21 | 12.7% |
| Federal Government Employees | 0 | 0.0% |
| Unpaid Family Workers | 0 | 0.0% |
| Total | 165 | 100.0% |
Employment Status by Age in Garrison
According to the labor force statistics for Garrison, out of the total population over 16 years of age (705), 25.1% or 177 individuals are in the labor force, with 6.8% or 12 of them unemployed. The age group with the highest labor force participation rate is 30 to 34 years, with 100.0% or 28 individuals in the labor force. Within the labor force, the 25 to 29 years age range has the highest percentage of unemployed individuals, with 63.2% or 12 of them being unemployed.
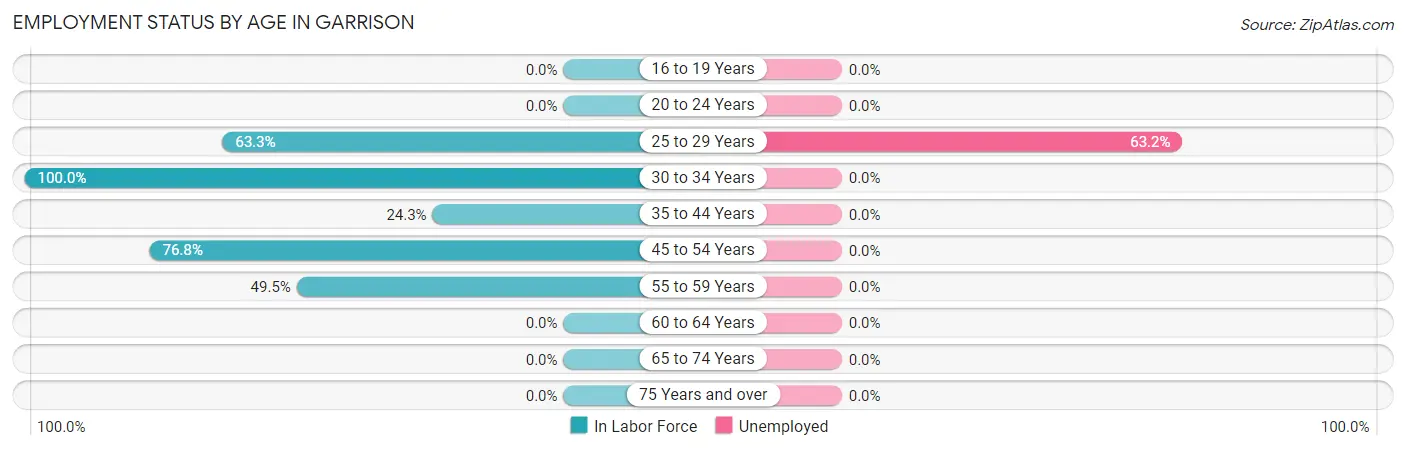
| Age Bracket | In Labor Force | Unemployed |
| 16 to 19 Years | 0 (0.0%) | 0 (0.0%) |
| 20 to 24 Years | 0 (0.0%) | 0 (0.0%) |
| 25 to 29 Years | 19 (63.3%) | 12 (63.2%) |
| 30 to 34 Years | 28 (100.0%) | 0 (0.0%) |
| 35 to 44 Years | 17 (24.3%) | 0 (0.0%) |
| 45 to 54 Years | 63 (76.8%) | 0 (0.0%) |
| 55 to 59 Years | 50 (49.5%) | 0 (0.0%) |
| 60 to 64 Years | 0 (0.0%) | 0 (0.0%) |
| 65 to 74 Years | 0 (0.0%) | 0 (0.0%) |
| 75 Years and over | 0 (0.0%) | 0 (0.0%) |
| Total | 177 (25.1%) | 12 (6.8%) |
Employment Status by Educational Attainment in Garrison
According to labor force statistics for Garrison, 38.6% of individuals (177) out of the total population between 25 and 64 years of age (459) are in the labor force, with 6.8% or 12 of them being unemployed. The group with the highest labor force participation rate are those with the educational attainment of bachelor's degree or higher, with 100.0% or 7 individuals in the labor force. Within the labor force, individuals with high school diploma education have the highest percentage of unemployment, with 20.0% or 12 of them being unemployed.
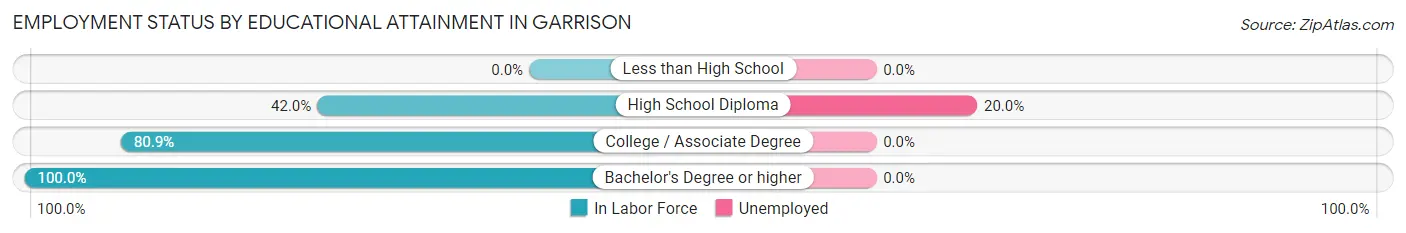
| Educational Attainment | In Labor Force | Unemployed |
| Less than High School | 0 (0.0%) | 0 (0.0%) |
| High School Diploma | 60 (42.0%) | 29 (20.0%) |
| College / Associate Degree | 110 (80.9%) | 0 (0.0%) |
| Bachelor's Degree or higher | 7 (100.0%) | 0 (0.0%) |
| Total | 177 (38.6%) | 31 (6.8%) |
Employment Occupations by Sex in Garrison
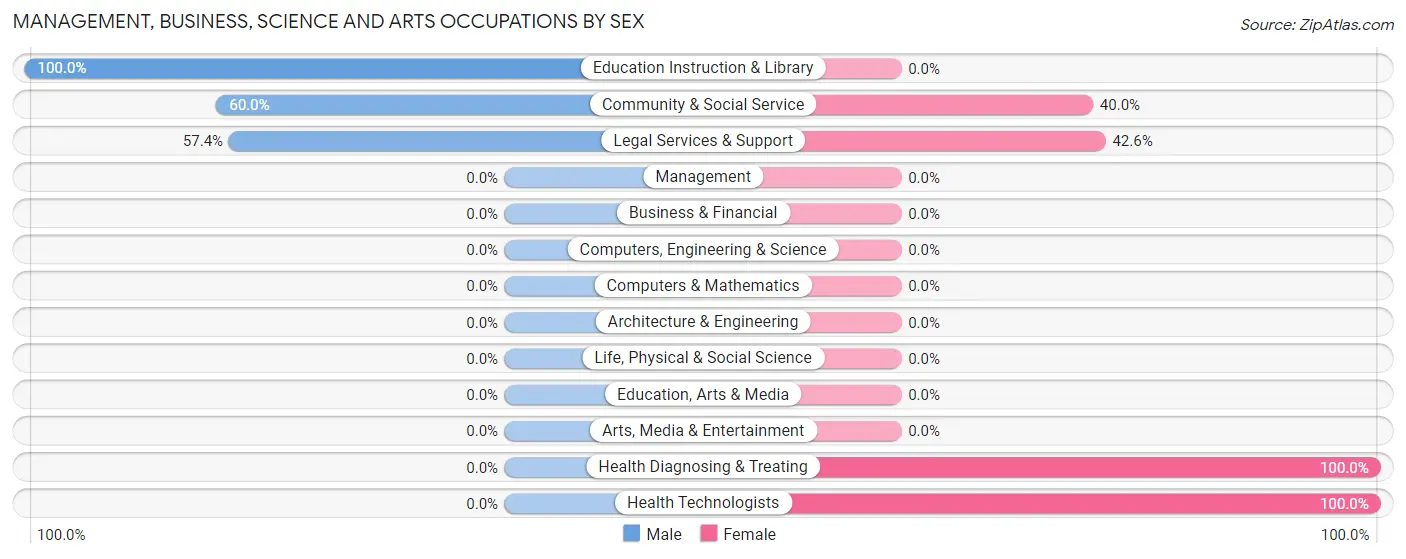
Management, Business, Science and Arts Occupations
The most common Management, Business, Science and Arts occupations in Garrison are Community & Social Service (65 | 39.4%), Legal Services & Support (61 | 37.0%), Education Instruction & Library (4 | 2.4%), Health Diagnosing & Treating (3 | 1.8%), and Health Technologists (3 | 1.8%).
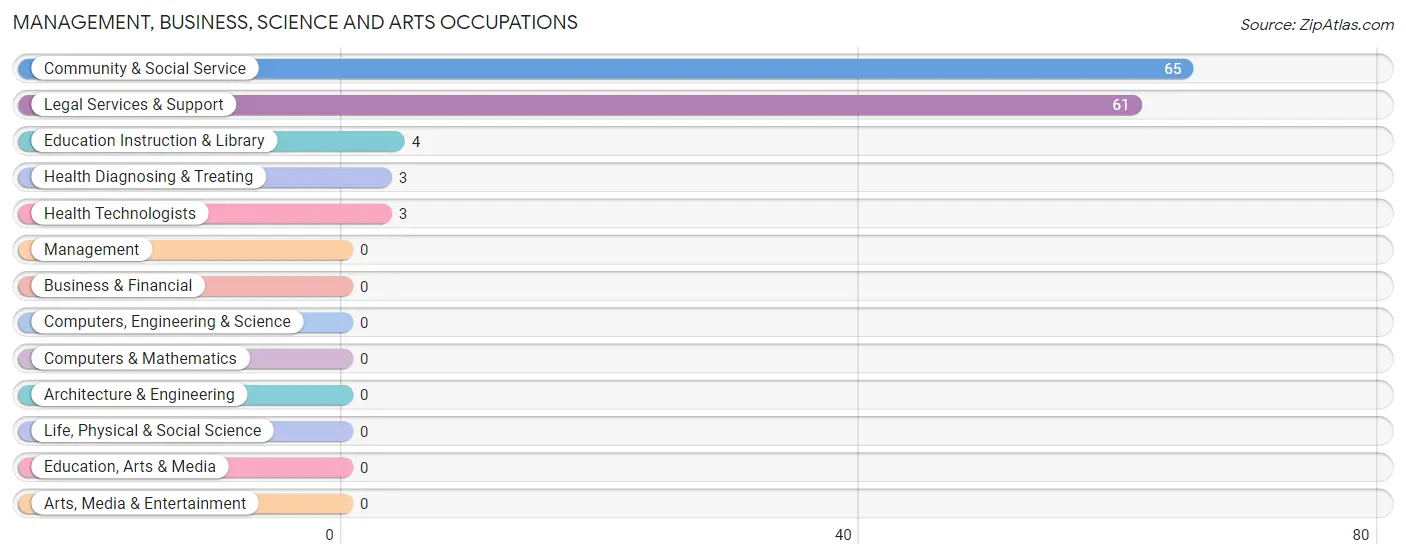
Management, Business, Science and Arts Occupations by Sex
Within the Management, Business, Science and Arts occupations in Garrison, the most male-oriented occupations are Education Instruction & Library (100.0%), Community & Social Service (60.0%), and Legal Services & Support (57.4%), while the most female-oriented occupations are Health Diagnosing & Treating (100.0%), Health Technologists (100.0%), and Legal Services & Support (42.6%).
| Occupation | Male | Female |
| Management | 0 (0.0%) | 0 (0.0%) |
| Business & Financial | 0 (0.0%) | 0 (0.0%) |
| Computers, Engineering & Science | 0 (0.0%) | 0 (0.0%) |
| Computers & Mathematics | 0 (0.0%) | 0 (0.0%) |
| Architecture & Engineering | 0 (0.0%) | 0 (0.0%) |
| Life, Physical & Social Science | 0 (0.0%) | 0 (0.0%) |
| Community & Social Service | 39 (60.0%) | 26 (40.0%) |
| Education, Arts & Media | 0 (0.0%) | 0 (0.0%) |
| Legal Services & Support | 35 (57.4%) | 26 (42.6%) |
| Education Instruction & Library | 4 (100.0%) | 0 (0.0%) |
| Arts, Media & Entertainment | 0 (0.0%) | 0 (0.0%) |
| Health Diagnosing & Treating | 0 (0.0%) | 3 (100.0%) |
| Health Technologists | 0 (0.0%) | 3 (100.0%) |
| Total (Category) | 39 (57.4%) | 29 (42.6%) |
| Total (Overall) | 99 (60.0%) | 66 (40.0%) |
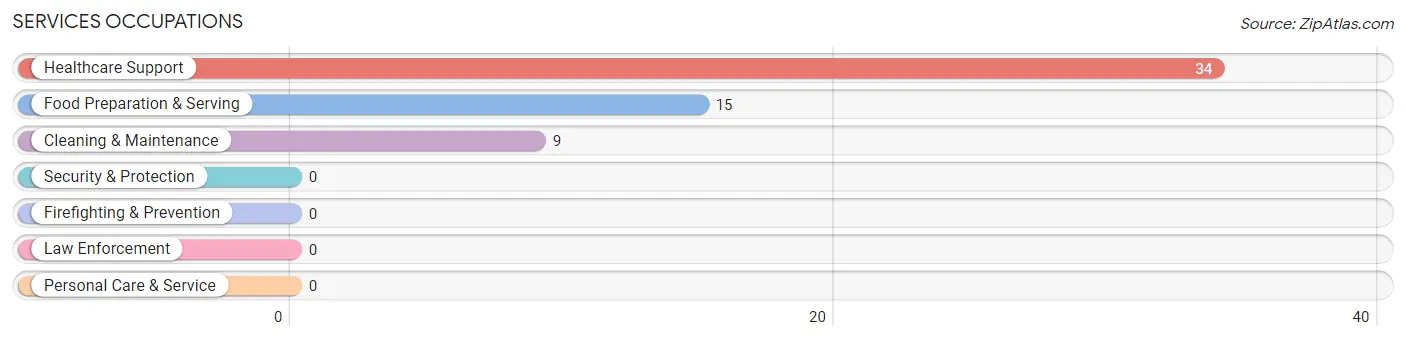
Services Occupations
The most common Services occupations in Garrison are Healthcare Support (34 | 20.6%), Food Preparation & Serving (15 | 9.1%), and Cleaning & Maintenance (9 | 5.4%).
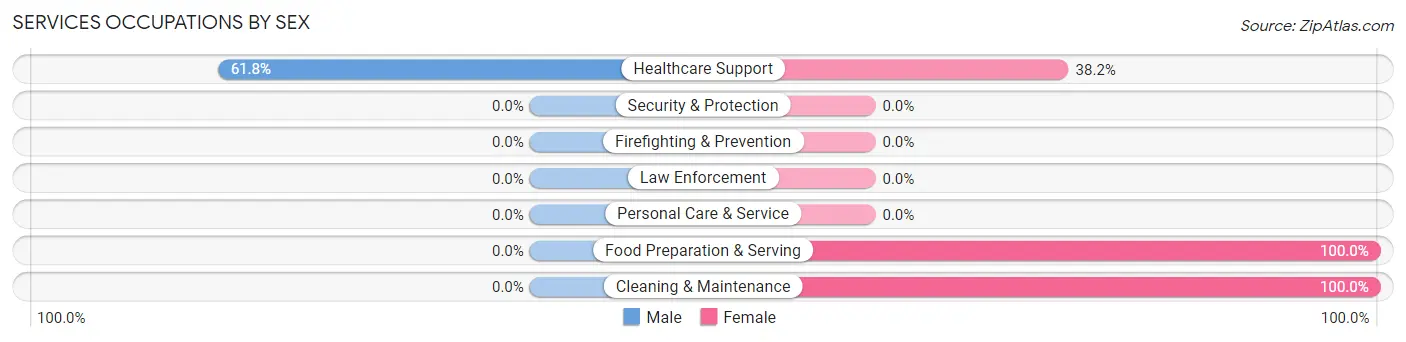
Services Occupations by Sex
| Occupation | Male | Female |
| Healthcare Support | 21 (61.8%) | 13 (38.2%) |
| Security & Protection | 0 (0.0%) | 0 (0.0%) |
| Firefighting & Prevention | 0 (0.0%) | 0 (0.0%) |
| Law Enforcement | 0 (0.0%) | 0 (0.0%) |
| Food Preparation & Serving | 0 (0.0%) | 15 (100.0%) |
| Cleaning & Maintenance | 0 (0.0%) | 9 (100.0%) |
| Personal Care & Service | 0 (0.0%) | 0 (0.0%) |
| Total (Category) | 21 (36.2%) | 37 (63.8%) |
| Total (Overall) | 99 (60.0%) | 66 (40.0%) |
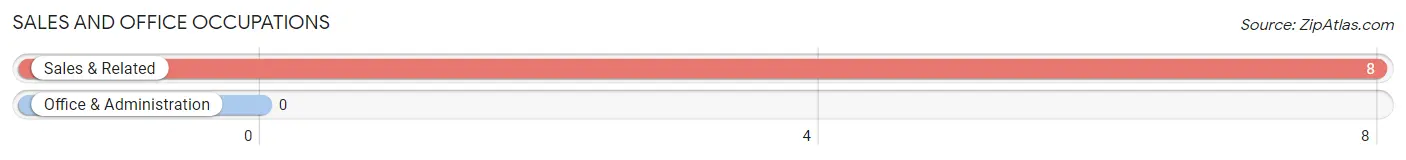
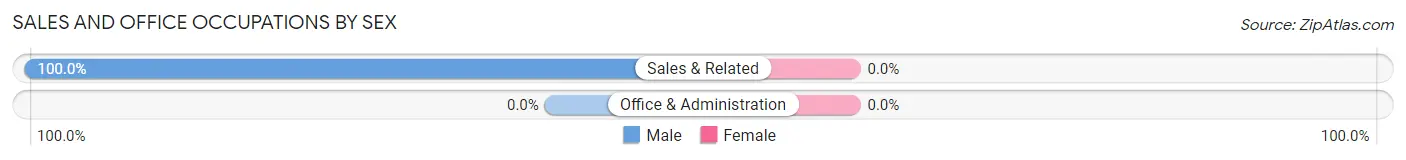
Sales and Office Occupations
The most common Sales and Office occupations in Garrison are , and Sales & Related (8 | 4.9%).
Sales and Office Occupations by Sex
| Occupation | Male | Female |
| Sales & Related | 8 (100.0%) | 0 (0.0%) |
| Office & Administration | 0 (0.0%) | 0 (0.0%) |
| Total (Category) | 8 (100.0%) | 0 (0.0%) |
| Total (Overall) | 99 (60.0%) | 66 (40.0%) |
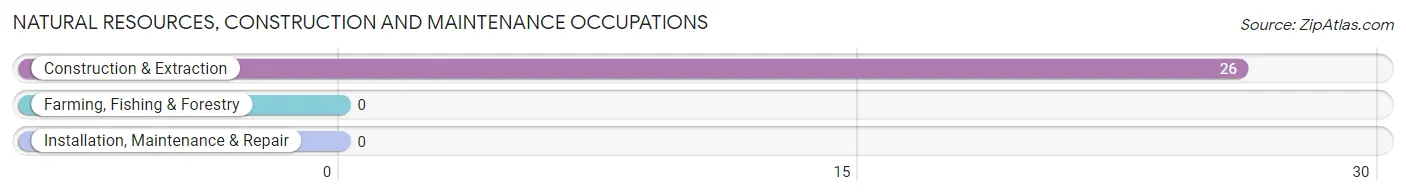
Natural Resources, Construction and Maintenance Occupations
The most common Natural Resources, Construction and Maintenance occupations in Garrison are , and Construction & Extraction (26 | 15.8%).
Natural Resources, Construction and Maintenance Occupations by Sex
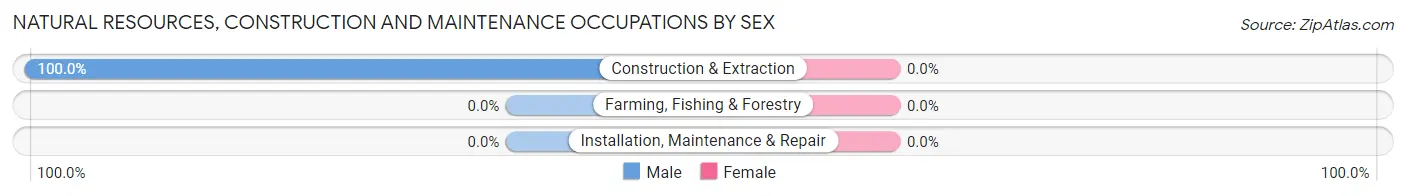
| Occupation | Male | Female |
| Farming, Fishing & Forestry | 0 (0.0%) | 0 (0.0%) |
| Construction & Extraction | 26 (100.0%) | 0 (0.0%) |
| Installation, Maintenance & Repair | 0 (0.0%) | 0 (0.0%) |
| Total (Category) | 26 (100.0%) | 0 (0.0%) |
| Total (Overall) | 99 (60.0%) | 66 (40.0%) |
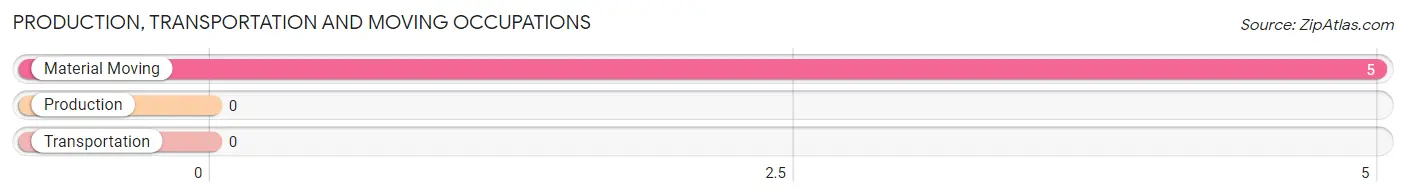
Production, Transportation and Moving Occupations
The most common Production, Transportation and Moving occupations in Garrison are , and Material Moving (5 | 3.0%).
Production, Transportation and Moving Occupations by Sex
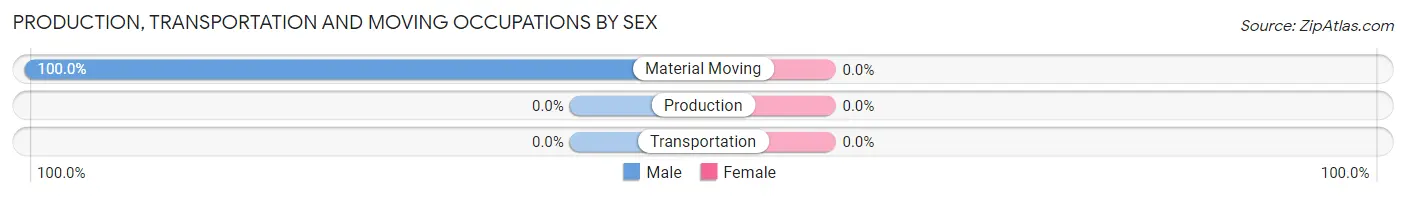
| Occupation | Male | Female |
| Production | 0 (0.0%) | 0 (0.0%) |
| Transportation | 0 (0.0%) | 0 (0.0%) |
| Material Moving | 5 (100.0%) | 0 (0.0%) |
| Total (Category) | 5 (100.0%) | 0 (0.0%) |
| Total (Overall) | 99 (60.0%) | 66 (40.0%) |
Employment Industries by Sex in Garrison
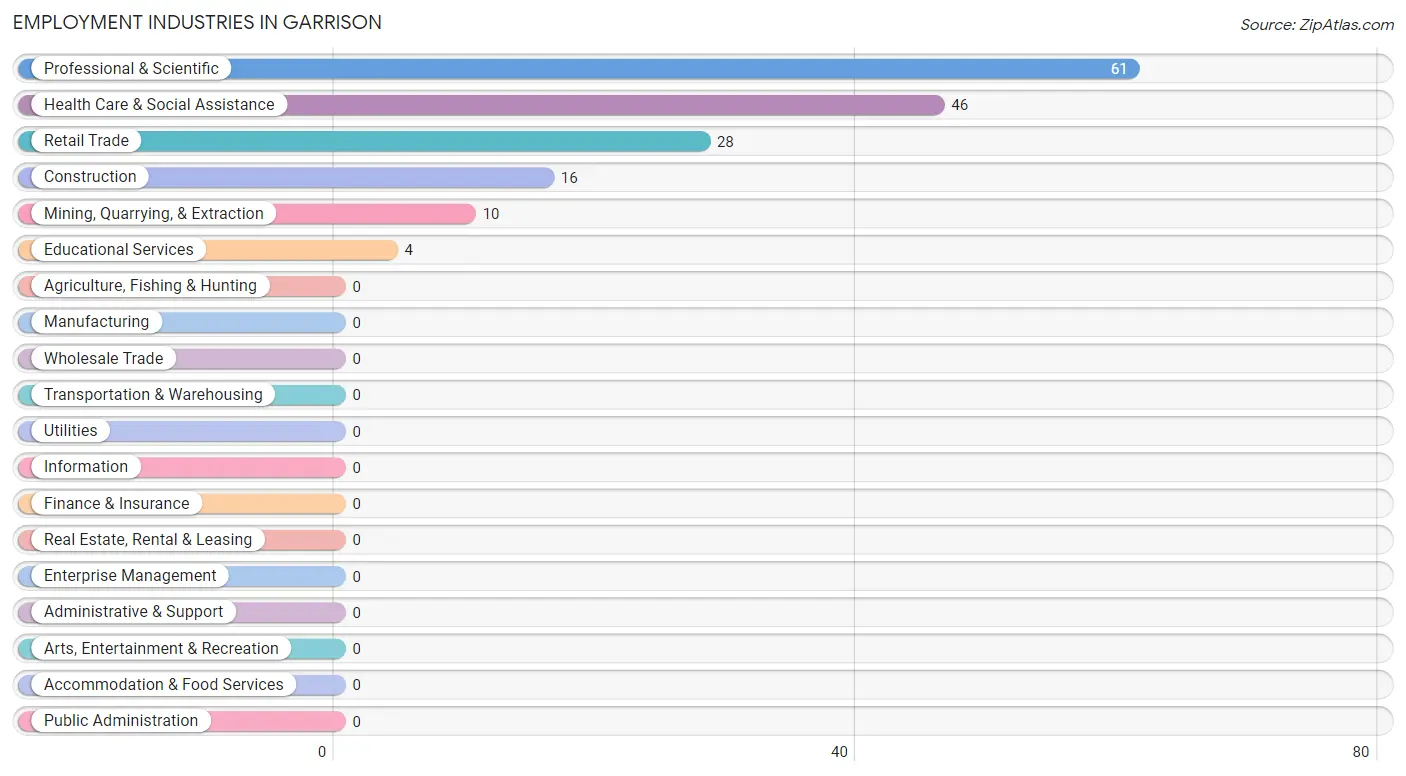
Employment Industries in Garrison
The major employment industries in Garrison include Professional & Scientific (61 | 37.0%), Health Care & Social Assistance (46 | 27.9%), Retail Trade (28 | 17.0%), Construction (16 | 9.7%), and Mining, Quarrying, & Extraction (10 | 6.1%).
Employment Industries by Sex in Garrison
The Garrison industries that see more men than women are Mining, Quarrying, & Extraction (100.0%), Construction (100.0%), and Educational Services (100.0%), whereas the industries that tend to have a higher number of women are Health Care & Social Assistance (54.3%), Retail Trade (53.6%), and Professional & Scientific (42.6%).
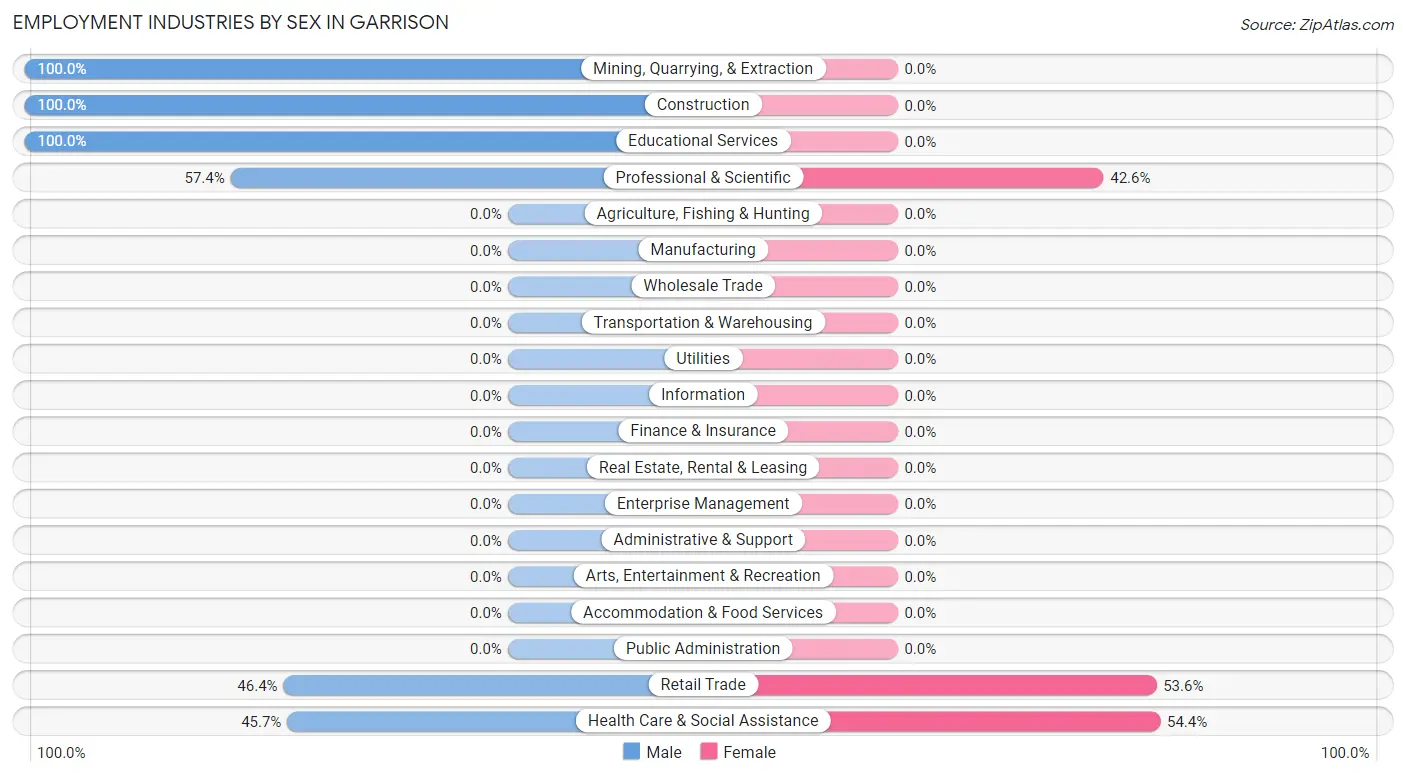
| Industry | Male | Female |
| Agriculture, Fishing & Hunting | 0 (0.0%) | 0 (0.0%) |
| Mining, Quarrying, & Extraction | 10 (100.0%) | 0 (0.0%) |
| Construction | 16 (100.0%) | 0 (0.0%) |
| Manufacturing | 0 (0.0%) | 0 (0.0%) |
| Wholesale Trade | 0 (0.0%) | 0 (0.0%) |
| Retail Trade | 13 (46.4%) | 15 (53.6%) |
| Transportation & Warehousing | 0 (0.0%) | 0 (0.0%) |
| Utilities | 0 (0.0%) | 0 (0.0%) |
| Information | 0 (0.0%) | 0 (0.0%) |
| Finance & Insurance | 0 (0.0%) | 0 (0.0%) |
| Real Estate, Rental & Leasing | 0 (0.0%) | 0 (0.0%) |
| Professional & Scientific | 35 (57.4%) | 26 (42.6%) |
| Enterprise Management | 0 (0.0%) | 0 (0.0%) |
| Administrative & Support | 0 (0.0%) | 0 (0.0%) |
| Educational Services | 4 (100.0%) | 0 (0.0%) |
| Health Care & Social Assistance | 21 (45.7%) | 25 (54.3%) |
| Arts, Entertainment & Recreation | 0 (0.0%) | 0 (0.0%) |
| Accommodation & Food Services | 0 (0.0%) | 0 (0.0%) |
| Public Administration | 0 (0.0%) | 0 (0.0%) |
| Total | 99 (60.0%) | 66 (40.0%) |
Education in Garrison
School Enrollment in Garrison
The most common levels of schooling among the 146 students in Garrison are elementary school (60 | 41.1%), middle school (54 | 37.0%), and high school (25 | 17.1%).
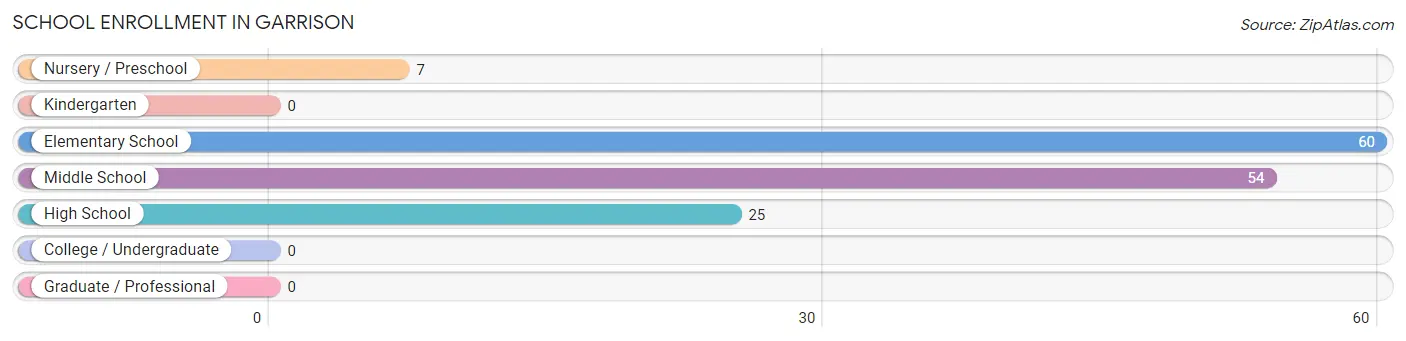
| School Level | # Students | % Students |
| Nursery / Preschool | 7 | 4.8% |
| Kindergarten | 0 | 0.0% |
| Elementary School | 60 | 41.1% |
| Middle School | 54 | 37.0% |
| High School | 25 | 17.1% |
| College / Undergraduate | 0 | 0.0% |
| Graduate / Professional | 0 | 0.0% |
| Total | 146 | 100.0% |
School Enrollment by Age by Funding Source in Garrison
Out of a total of 146 students who are enrolled in schools in Garrison, 55 (37.7%) attend a private institution, while the remaining 91 (62.3%) are enrolled in public schools. The age group of 5 to 9 year old has the highest likelihood of being enrolled in private schools, with 19 (45.2% in the age bracket) enrolled. Conversely, the age group of 3 to 4 year olds has the lowest likelihood of being enrolled in a private school, with 7 (100.0% in the age bracket) attending a public institution.
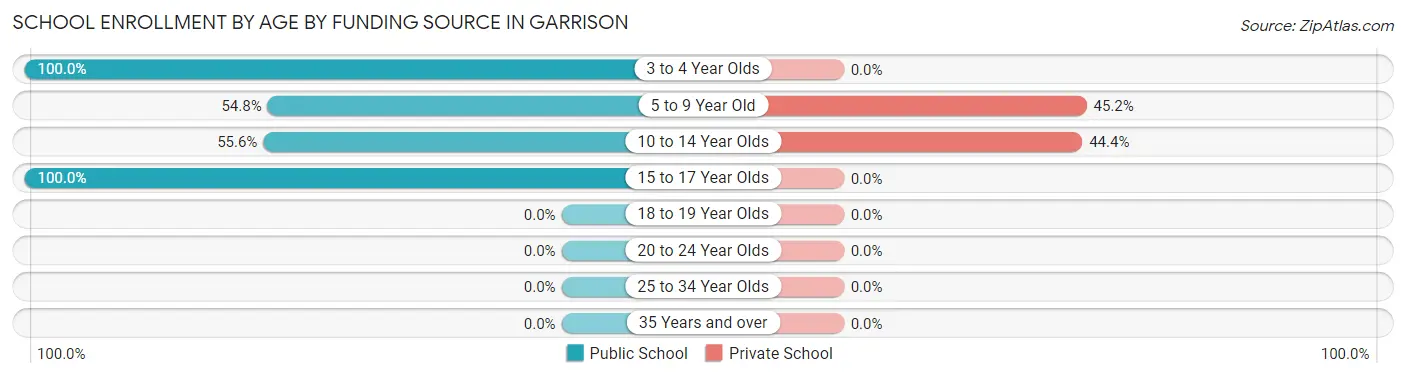
| Age Bracket | Public School | Private School |
| 3 to 4 Year Olds | 7 (100.0%) | 0 (0.0%) |
| 5 to 9 Year Old | 23 (54.8%) | 19 (45.2%) |
| 10 to 14 Year Olds | 45 (55.6%) | 36 (44.4%) |
| 15 to 17 Year Olds | 16 (100.0%) | 0 (0.0%) |
| 18 to 19 Year Olds | 0 (0.0%) | 0 (0.0%) |
| 20 to 24 Year Olds | 0 (0.0%) | 0 (0.0%) |
| 25 to 34 Year Olds | 0 (0.0%) | 0 (0.0%) |
| 35 Years and over | 0 (0.0%) | 0 (0.0%) |
| Total | 91 (62.3%) | 55 (37.7%) |
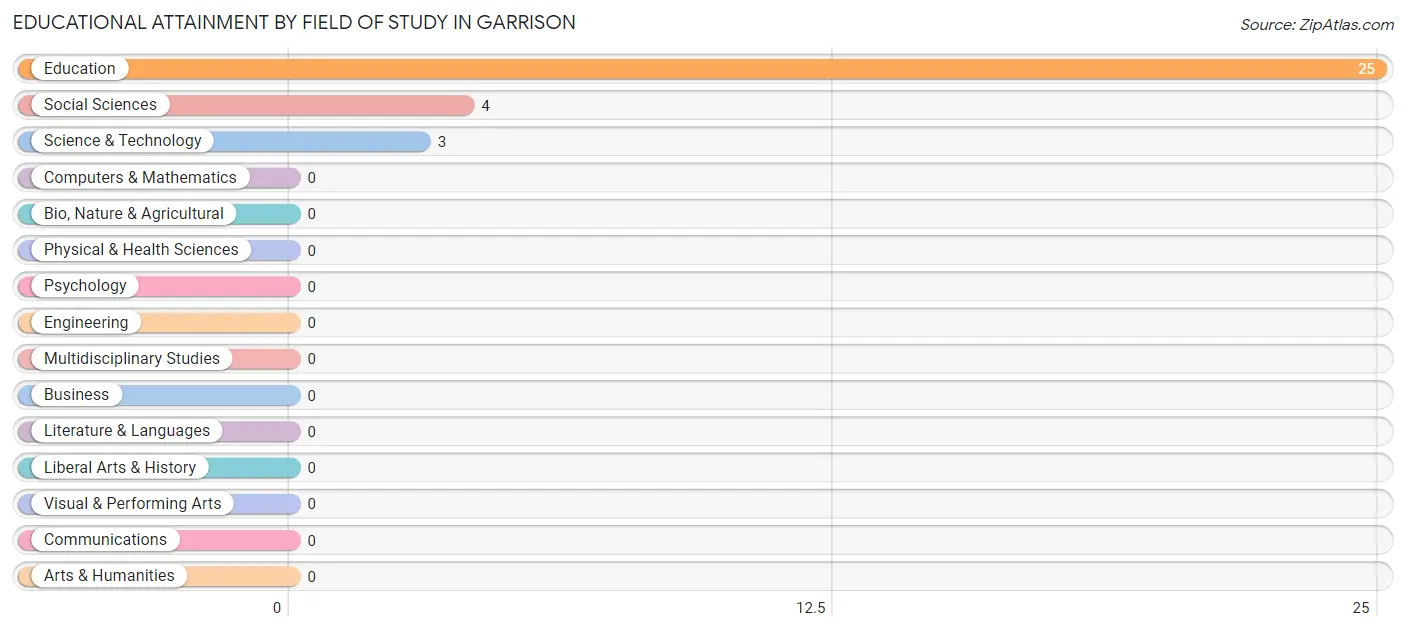
Educational Attainment by Field of Study in Garrison
Education (25 | 78.1%), social sciences (4 | 12.5%), and science & technology (3 | 9.4%) are the most common fields of study among 32 individuals in Garrison who have obtained a bachelor's degree or higher.
| Field of Study | # Graduates | % Graduates |
| Computers & Mathematics | 0 | 0.0% |
| Bio, Nature & Agricultural | 0 | 0.0% |
| Physical & Health Sciences | 0 | 0.0% |
| Psychology | 0 | 0.0% |
| Social Sciences | 4 | 12.5% |
| Engineering | 0 | 0.0% |
| Multidisciplinary Studies | 0 | 0.0% |
| Science & Technology | 3 | 9.4% |
| Business | 0 | 0.0% |
| Education | 25 | 78.1% |
| Literature & Languages | 0 | 0.0% |
| Liberal Arts & History | 0 | 0.0% |
| Visual & Performing Arts | 0 | 0.0% |
| Communications | 0 | 0.0% |
| Arts & Humanities | 0 | 0.0% |
| Total | 32 | 100.0% |
Transportation & Commute in Garrison
Vehicle Availability by Sex in Garrison
The most prevalent vehicle ownership categories in Garrison are males with 2 vehicles (76, accounting for 76.8%) and females with 2 vehicles (29, making up 115.1%).
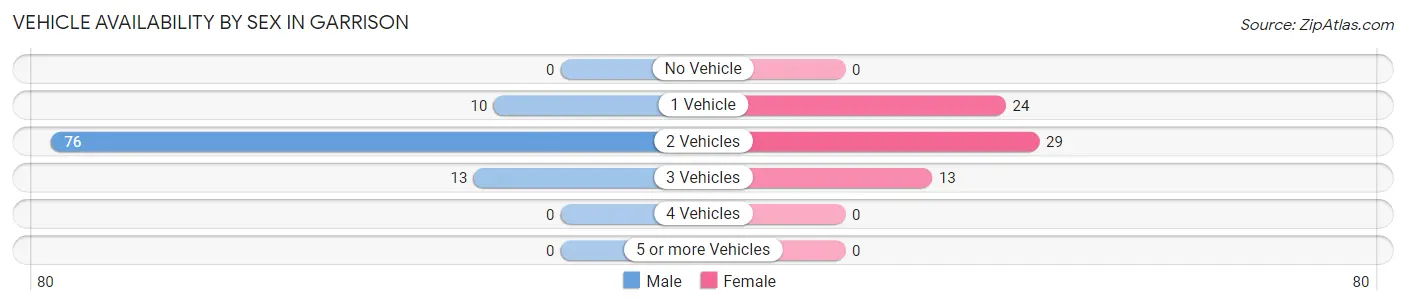
| Vehicles Available | Male | Female |
| No Vehicle | 0 (0.0%) | 0 (0.0%) |
| 1 Vehicle | 10 (10.1%) | 24 (36.4%) |
| 2 Vehicles | 76 (76.8%) | 29 (43.9%) |
| 3 Vehicles | 13 (13.1%) | 13 (19.7%) |
| 4 Vehicles | 0 (0.0%) | 0 (0.0%) |
| 5 or more Vehicles | 0 (0.0%) | 0 (0.0%) |
| Total | 99 (100.0%) | 66 (100.0%) |
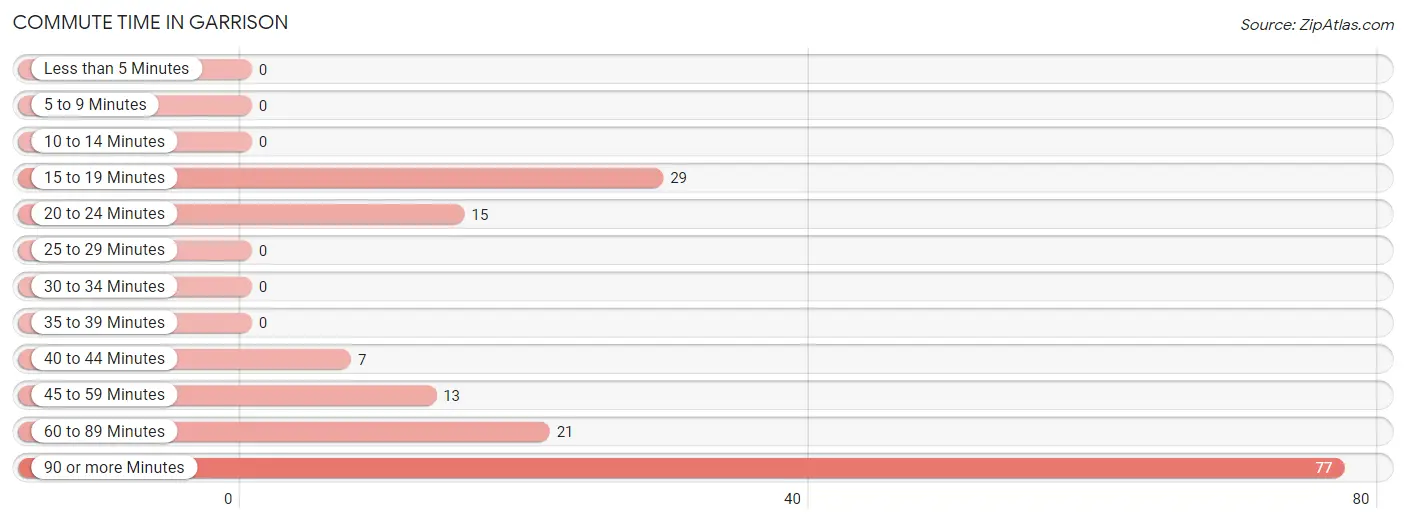
Commute Time in Garrison
The most frequently occuring commute durations in Garrison are 90 or more minutes (77 commuters, 47.5%), 15 to 19 minutes (29 commuters, 17.9%), and 60 to 89 minutes (21 commuters, 13.0%).
| Commute Time | # Commuters | % Commuters |
| Less than 5 Minutes | 0 | 0.0% |
| 5 to 9 Minutes | 0 | 0.0% |
| 10 to 14 Minutes | 0 | 0.0% |
| 15 to 19 Minutes | 29 | 17.9% |
| 20 to 24 Minutes | 15 | 9.3% |
| 25 to 29 Minutes | 0 | 0.0% |
| 30 to 34 Minutes | 0 | 0.0% |
| 35 to 39 Minutes | 0 | 0.0% |
| 40 to 44 Minutes | 7 | 4.3% |
| 45 to 59 Minutes | 13 | 8.0% |
| 60 to 89 Minutes | 21 | 13.0% |
| 90 or more Minutes | 77 | 47.5% |
Commute Time by Sex in Garrison
The most common commute times in Garrison are 90 or more minutes (51 commuters, 51.5%) for males and 90 or more minutes (26 commuters, 41.3%) for females.
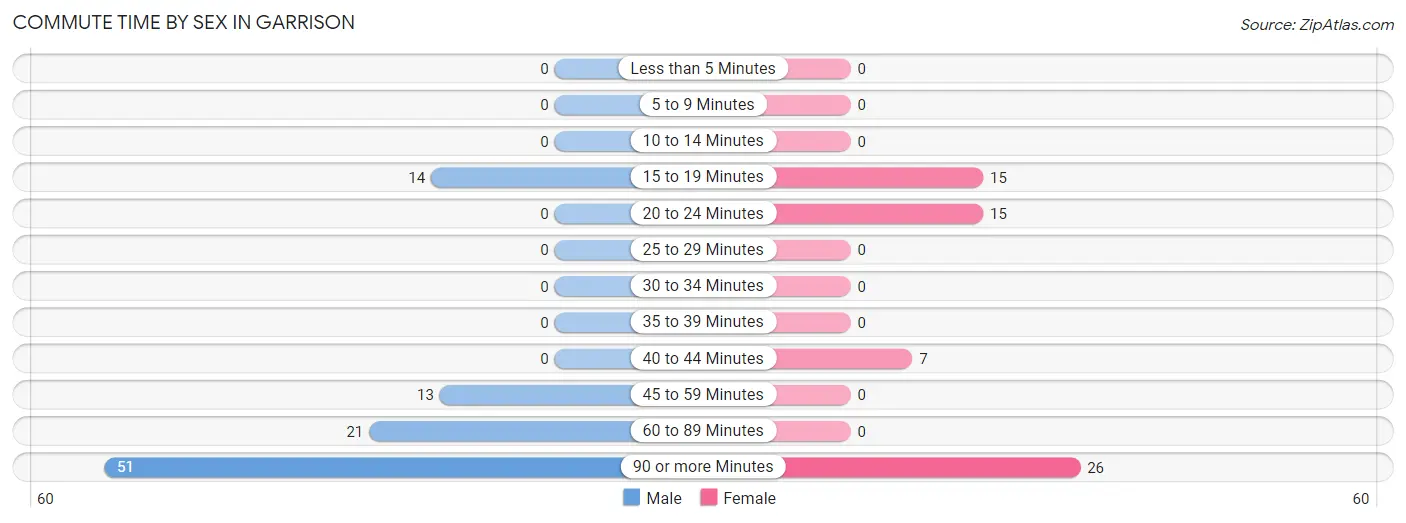
| Commute Time | Male | Female |
| Less than 5 Minutes | 0 (0.0%) | 0 (0.0%) |
| 5 to 9 Minutes | 0 (0.0%) | 0 (0.0%) |
| 10 to 14 Minutes | 0 (0.0%) | 0 (0.0%) |
| 15 to 19 Minutes | 14 (14.1%) | 15 (23.8%) |
| 20 to 24 Minutes | 0 (0.0%) | 15 (23.8%) |
| 25 to 29 Minutes | 0 (0.0%) | 0 (0.0%) |
| 30 to 34 Minutes | 0 (0.0%) | 0 (0.0%) |
| 35 to 39 Minutes | 0 (0.0%) | 0 (0.0%) |
| 40 to 44 Minutes | 0 (0.0%) | 7 (11.1%) |
| 45 to 59 Minutes | 13 (13.1%) | 0 (0.0%) |
| 60 to 89 Minutes | 21 (21.2%) | 0 (0.0%) |
| 90 or more Minutes | 51 (51.5%) | 26 (41.3%) |
Time of Departure to Work by Sex in Garrison
The most frequent times of departure to work in Garrison are 6:30 AM to 6:59 AM (35, 35.3%) for males and 8:00 AM to 8:29 AM (26, 41.3%) for females.
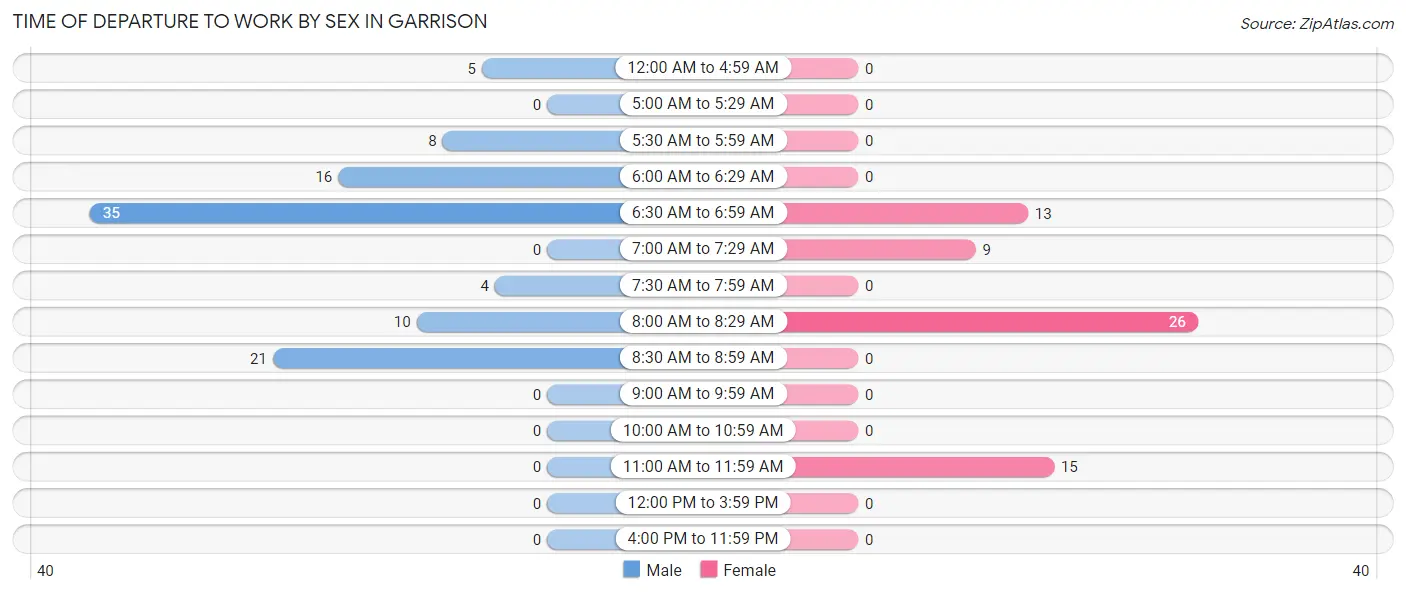
| Time of Departure | Male | Female |
| 12:00 AM to 4:59 AM | 5 (5.1%) | 0 (0.0%) |
| 5:00 AM to 5:29 AM | 0 (0.0%) | 0 (0.0%) |
| 5:30 AM to 5:59 AM | 8 (8.1%) | 0 (0.0%) |
| 6:00 AM to 6:29 AM | 16 (16.2%) | 0 (0.0%) |
| 6:30 AM to 6:59 AM | 35 (35.3%) | 13 (20.6%) |
| 7:00 AM to 7:29 AM | 0 (0.0%) | 9 (14.3%) |
| 7:30 AM to 7:59 AM | 4 (4.0%) | 0 (0.0%) |
| 8:00 AM to 8:29 AM | 10 (10.1%) | 26 (41.3%) |
| 8:30 AM to 8:59 AM | 21 (21.2%) | 0 (0.0%) |
| 9:00 AM to 9:59 AM | 0 (0.0%) | 0 (0.0%) |
| 10:00 AM to 10:59 AM | 0 (0.0%) | 0 (0.0%) |
| 11:00 AM to 11:59 AM | 0 (0.0%) | 15 (23.8%) |
| 12:00 PM to 3:59 PM | 0 (0.0%) | 0 (0.0%) |
| 4:00 PM to 11:59 PM | 0 (0.0%) | 0 (0.0%) |
| Total | 99 (100.0%) | 63 (100.0%) |
Housing Occupancy in Garrison
Occupancy by Ownership in Garrison
Of the total 269 dwellings in Garrison, owner-occupied units account for 226 (84.0%), while renter-occupied units make up 43 (16.0%).
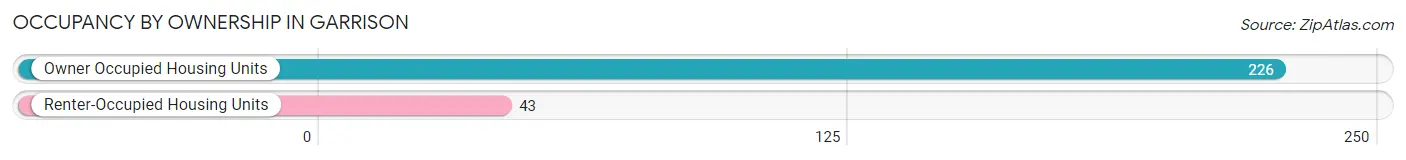
| Occupancy | # Housing Units | % Housing Units |
| Owner Occupied Housing Units | 226 | 84.0% |
| Renter-Occupied Housing Units | 43 | 16.0% |
| Total Occupied Housing Units | 269 | 100.0% |
Occupancy by Household Size in Garrison
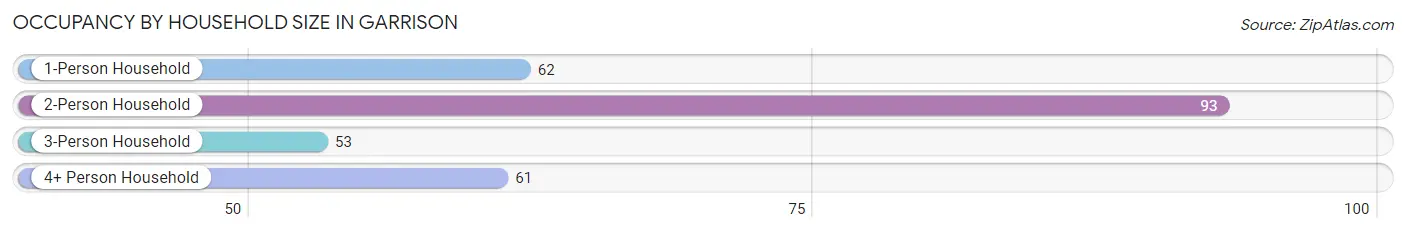
| Household Size | # Housing Units | % Housing Units |
| 1-Person Household | 62 | 23.1% |
| 2-Person Household | 93 | 34.6% |
| 3-Person Household | 53 | 19.7% |
| 4+ Person Household | 61 | 22.7% |
| Total Housing Units | 269 | 100.0% |
Occupancy by Ownership by Household Size in Garrison
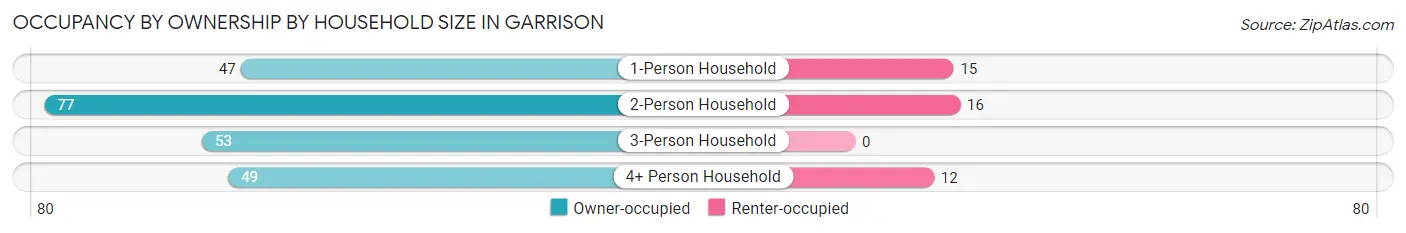
| Household Size | Owner-occupied | Renter-occupied |
| 1-Person Household | 47 (75.8%) | 15 (24.2%) |
| 2-Person Household | 77 (82.8%) | 16 (17.2%) |
| 3-Person Household | 53 (100.0%) | 0 (0.0%) |
| 4+ Person Household | 49 (80.3%) | 12 (19.7%) |
| Total Housing Units | 226 (84.0%) | 43 (16.0%) |
Occupancy by Educational Attainment in Garrison
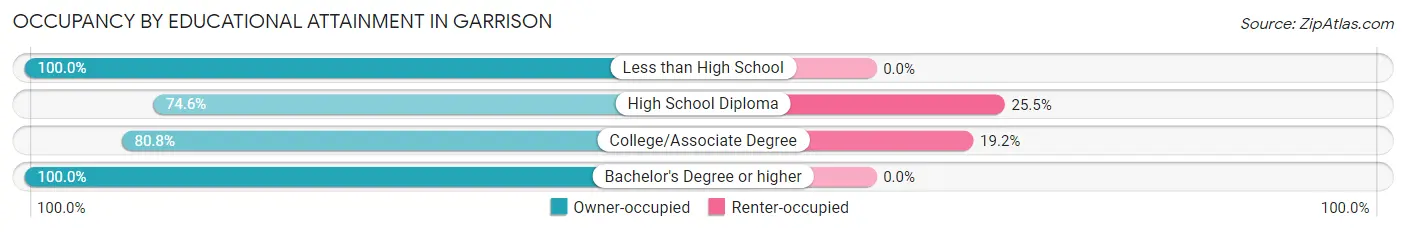
| Household Size | Owner-occupied | Renter-occupied |
| Less than High School | 52 (100.0%) | 0 (0.0%) |
| High School Diploma | 82 (74.6%) | 28 (25.5%) |
| College/Associate Degree | 63 (80.8%) | 15 (19.2%) |
| Bachelor's Degree or higher | 29 (100.0%) | 0 (0.0%) |
Occupancy by Age of Householder in Garrison
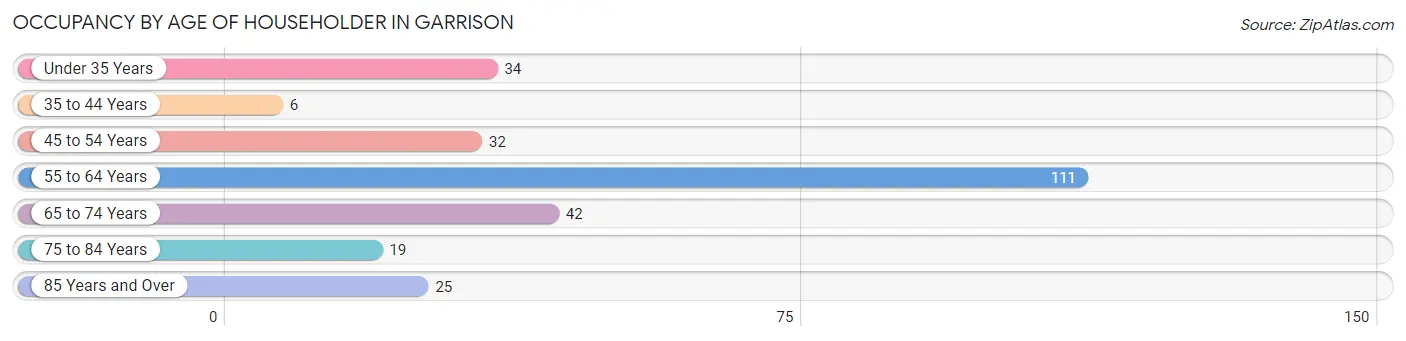
| Age Bracket | # Households | % Households |
| Under 35 Years | 34 | 12.6% |
| 35 to 44 Years | 6 | 2.2% |
| 45 to 54 Years | 32 | 11.9% |
| 55 to 64 Years | 111 | 41.3% |
| 65 to 74 Years | 42 | 15.6% |
| 75 to 84 Years | 19 | 7.1% |
| 85 Years and Over | 25 | 9.3% |
| Total | 269 | 100.0% |
Housing Finances in Garrison
Median Income by Occupancy in Garrison
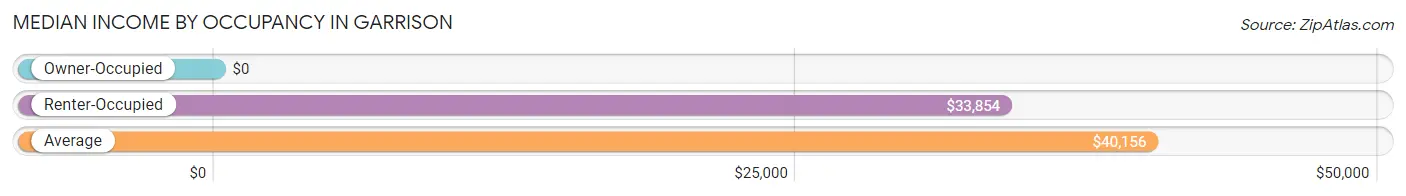
| Occupancy Type | # Households | Median Income |
| Owner-Occupied | 226 (84.0%) | $0 |
| Renter-Occupied | 43 (16.0%) | $33,854 |
| Average | 269 (100.0%) | $40,156 |
Occupancy by Householder Income Bracket in Garrison
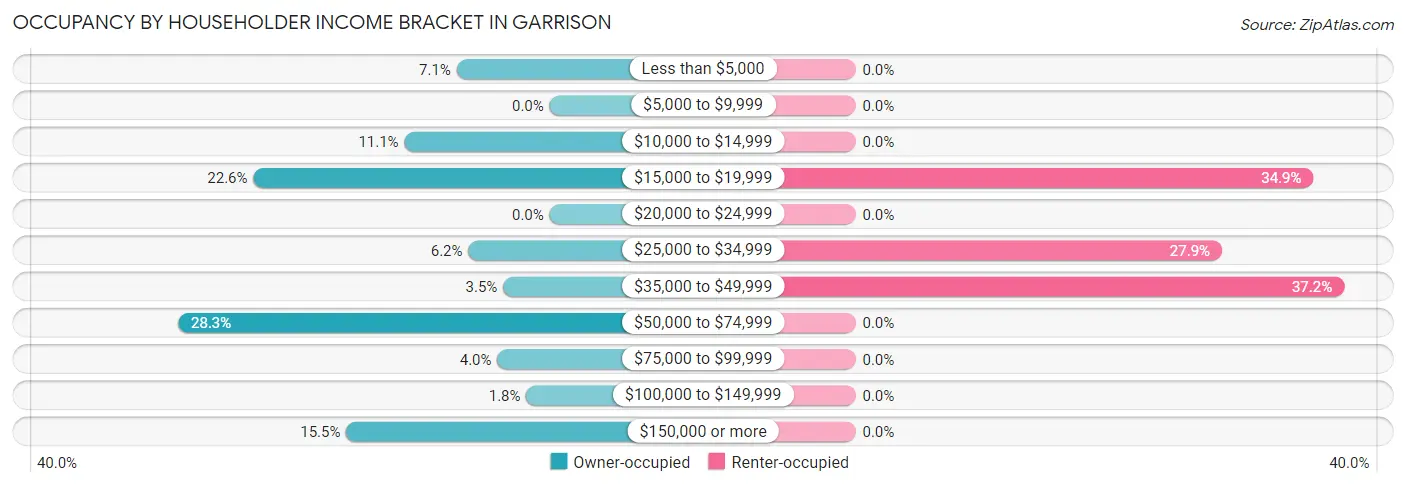
| Income Bracket | Owner-occupied | Renter-occupied |
| Less than $5,000 | 16 (7.1%) | 0 (0.0%) |
| $5,000 to $9,999 | 0 (0.0%) | 0 (0.0%) |
| $10,000 to $14,999 | 25 (11.1%) | 0 (0.0%) |
| $15,000 to $19,999 | 51 (22.6%) | 15 (34.9%) |
| $20,000 to $24,999 | 0 (0.0%) | 0 (0.0%) |
| $25,000 to $34,999 | 14 (6.2%) | 12 (27.9%) |
| $35,000 to $49,999 | 8 (3.5%) | 16 (37.2%) |
| $50,000 to $74,999 | 64 (28.3%) | 0 (0.0%) |
| $75,000 to $99,999 | 9 (4.0%) | 0 (0.0%) |
| $100,000 to $149,999 | 4 (1.8%) | 0 (0.0%) |
| $150,000 or more | 35 (15.5%) | 0 (0.0%) |
| Total | 226 (100.0%) | 43 (100.0%) |
Monthly Housing Cost Tiers in Garrison
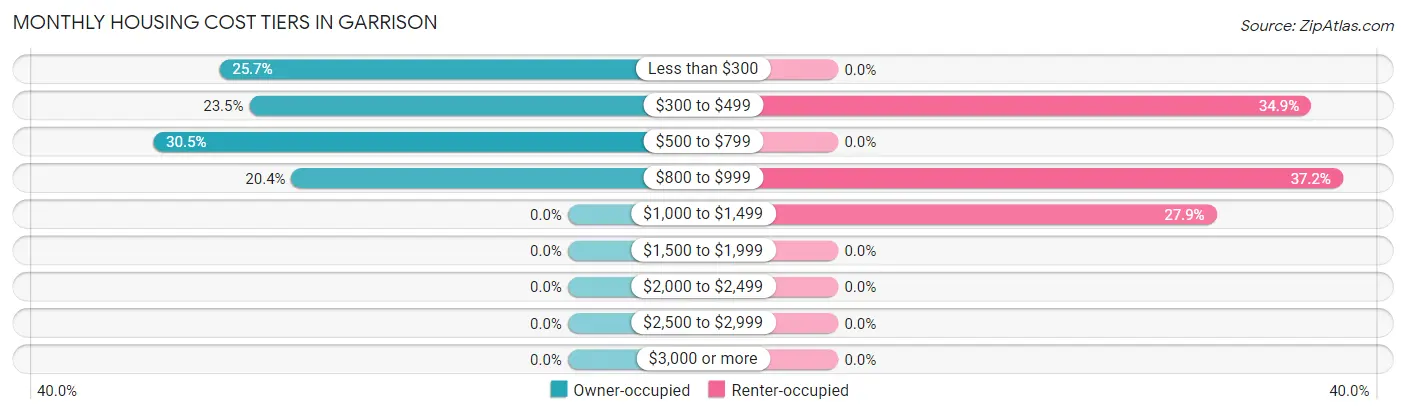
| Monthly Cost | Owner-occupied | Renter-occupied |
| Less than $300 | 58 (25.7%) | 0 (0.0%) |
| $300 to $499 | 53 (23.4%) | 15 (34.9%) |
| $500 to $799 | 69 (30.5%) | 0 (0.0%) |
| $800 to $999 | 46 (20.3%) | 16 (37.2%) |
| $1,000 to $1,499 | 0 (0.0%) | 12 (27.9%) |
| $1,500 to $1,999 | 0 (0.0%) | 0 (0.0%) |
| $2,000 to $2,499 | 0 (0.0%) | 0 (0.0%) |
| $2,500 to $2,999 | 0 (0.0%) | 0 (0.0%) |
| $3,000 or more | 0 (0.0%) | 0 (0.0%) |
| Total | 226 (100.0%) | 43 (100.0%) |
Physical Housing Characteristics in Garrison
Housing Structures in Garrison
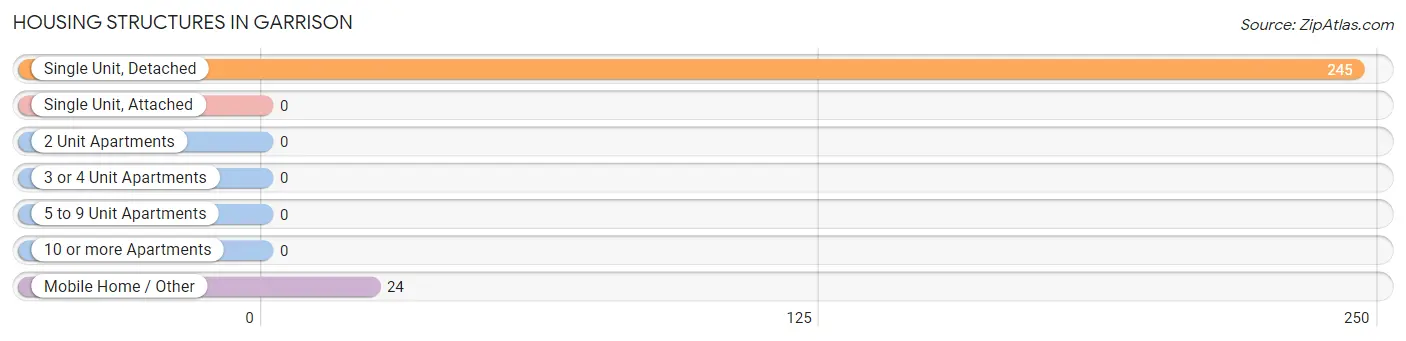
| Structure Type | # Housing Units | % Housing Units |
| Single Unit, Detached | 245 | 91.1% |
| Single Unit, Attached | 0 | 0.0% |
| 2 Unit Apartments | 0 | 0.0% |
| 3 or 4 Unit Apartments | 0 | 0.0% |
| 5 to 9 Unit Apartments | 0 | 0.0% |
| 10 or more Apartments | 0 | 0.0% |
| Mobile Home / Other | 24 | 8.9% |
| Total | 269 | 100.0% |
Housing Structures by Occupancy in Garrison
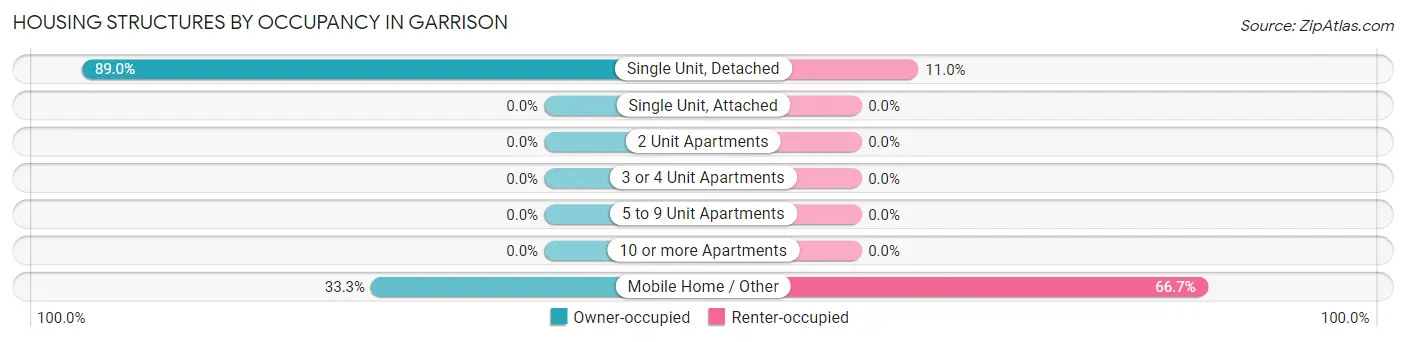
| Structure Type | Owner-occupied | Renter-occupied |
| Single Unit, Detached | 218 (89.0%) | 27 (11.0%) |
| Single Unit, Attached | 0 (0.0%) | 0 (0.0%) |
| 2 Unit Apartments | 0 (0.0%) | 0 (0.0%) |
| 3 or 4 Unit Apartments | 0 (0.0%) | 0 (0.0%) |
| 5 to 9 Unit Apartments | 0 (0.0%) | 0 (0.0%) |
| 10 or more Apartments | 0 (0.0%) | 0 (0.0%) |
| Mobile Home / Other | 8 (33.3%) | 16 (66.7%) |
| Total | 226 (84.0%) | 43 (16.0%) |
Housing Structures by Number of Rooms in Garrison
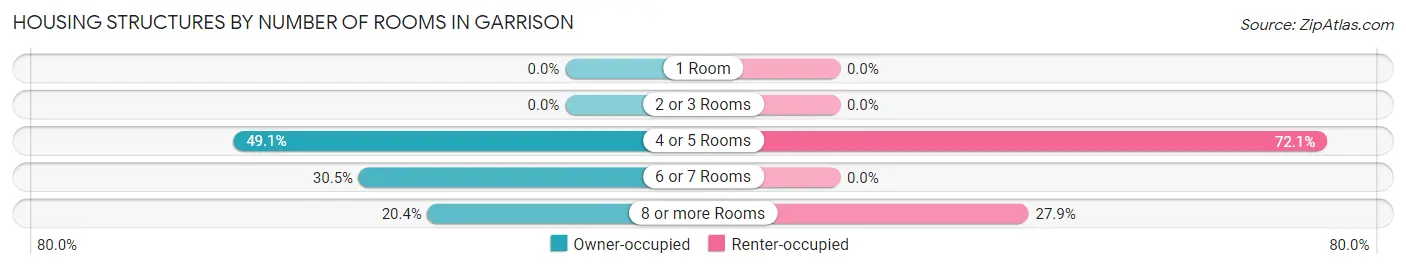
| Number of Rooms | Owner-occupied | Renter-occupied |
| 1 Room | 0 (0.0%) | 0 (0.0%) |
| 2 or 3 Rooms | 0 (0.0%) | 0 (0.0%) |
| 4 or 5 Rooms | 111 (49.1%) | 31 (72.1%) |
| 6 or 7 Rooms | 69 (30.5%) | 0 (0.0%) |
| 8 or more Rooms | 46 (20.3%) | 12 (27.9%) |
| Total | 226 (100.0%) | 43 (100.0%) |
Housing Structure by Heating Type in Garrison
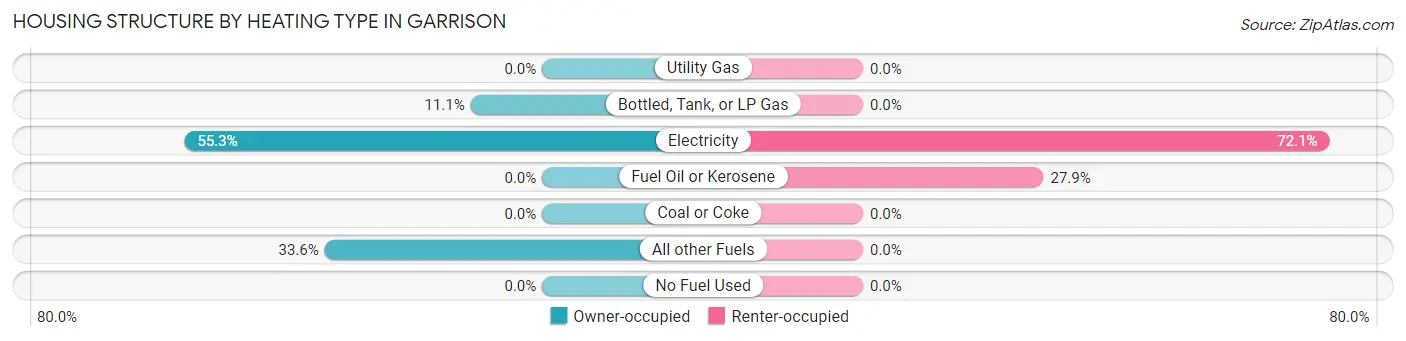
| Heating Type | Owner-occupied | Renter-occupied |
| Utility Gas | 0 (0.0%) | 0 (0.0%) |
| Bottled, Tank, or LP Gas | 25 (11.1%) | 0 (0.0%) |
| Electricity | 125 (55.3%) | 31 (72.1%) |
| Fuel Oil or Kerosene | 0 (0.0%) | 12 (27.9%) |
| Coal or Coke | 0 (0.0%) | 0 (0.0%) |
| All other Fuels | 76 (33.6%) | 0 (0.0%) |
| No Fuel Used | 0 (0.0%) | 0 (0.0%) |
| Total | 226 (100.0%) | 43 (100.0%) |
Household Vehicle Usage in Garrison
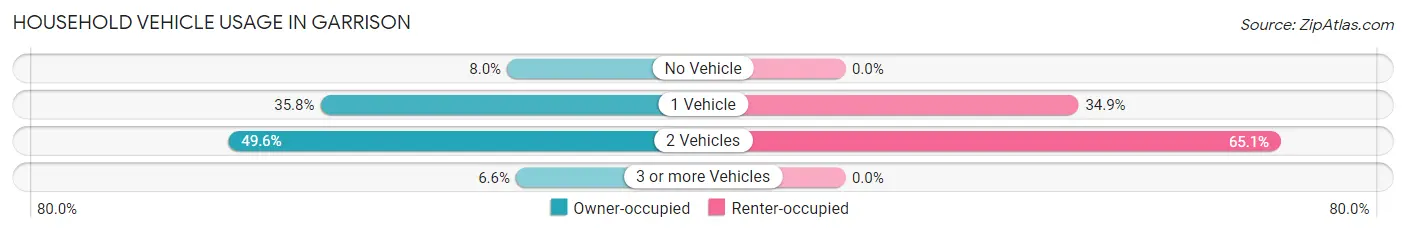
| Vehicles per Household | Owner-occupied | Renter-occupied |
| No Vehicle | 18 (8.0%) | 0 (0.0%) |
| 1 Vehicle | 81 (35.8%) | 15 (34.9%) |
| 2 Vehicles | 112 (49.6%) | 28 (65.1%) |
| 3 or more Vehicles | 15 (6.6%) | 0 (0.0%) |
| Total | 226 (100.0%) | 43 (100.0%) |
Real Estate & Mortgages in Garrison
Real Estate and Mortgage Overview in Garrison
| Characteristic | Without Mortgage | With Mortgage |
| Housing Units | 146 | 80 |
| Median Property Value | - | - |
| Median Household Income | $65,000 | $0 |
| Monthly Housing Costs | $356 | $0 |
| Real Estate Taxes | - | - |
Property Value by Mortgage Status in Garrison
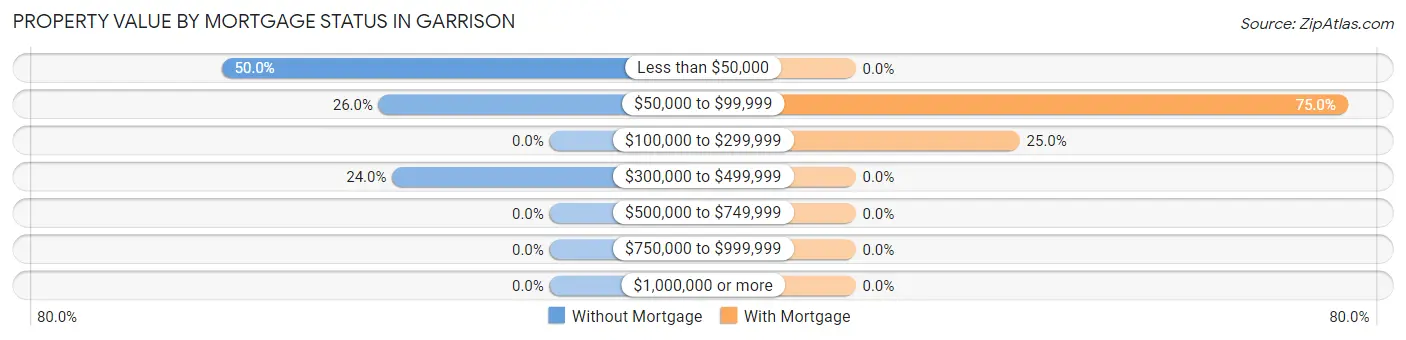
| Property Value | Without Mortgage | With Mortgage |
| Less than $50,000 | 73 (50.0%) | 0 (0.0%) |
| $50,000 to $99,999 | 38 (26.0%) | 60 (75.0%) |
| $100,000 to $299,999 | 0 (0.0%) | 20 (25.0%) |
| $300,000 to $499,999 | 35 (24.0%) | 0 (0.0%) |
| $500,000 to $749,999 | 0 (0.0%) | 0 (0.0%) |
| $750,000 to $999,999 | 0 (0.0%) | 0 (0.0%) |
| $1,000,000 or more | 0 (0.0%) | 0 (0.0%) |
| Total | 146 (100.0%) | 80 (100.0%) |
Household Income by Mortgage Status in Garrison
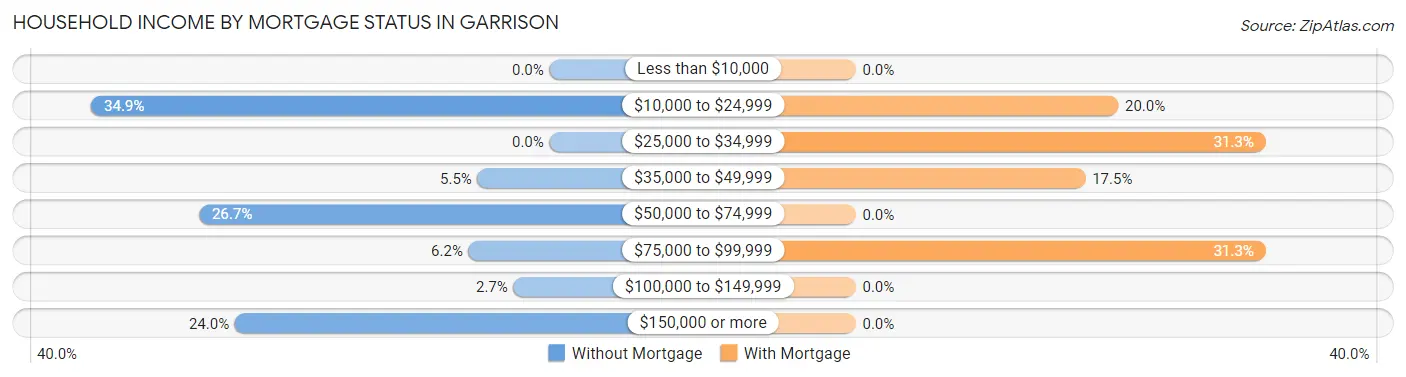
| Household Income | Without Mortgage | With Mortgage |
| Less than $10,000 | 0 (0.0%) | 0 (0.0%) |
| $10,000 to $24,999 | 51 (34.9%) | 16 (20.0%) |
| $25,000 to $34,999 | 0 (0.0%) | 25 (31.2%) |
| $35,000 to $49,999 | 8 (5.5%) | 14 (17.5%) |
| $50,000 to $74,999 | 39 (26.7%) | 0 (0.0%) |
| $75,000 to $99,999 | 9 (6.2%) | 25 (31.2%) |
| $100,000 to $149,999 | 4 (2.7%) | 0 (0.0%) |
| $150,000 or more | 35 (24.0%) | 0 (0.0%) |
| Total | 146 (100.0%) | 80 (100.0%) |
Property Value to Household Income Ratio in Garrison
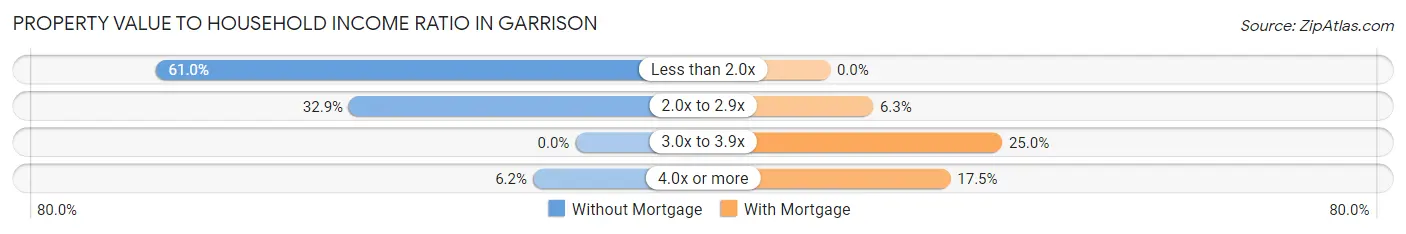
| Value-to-Income Ratio | Without Mortgage | With Mortgage |
| Less than 2.0x | 89 (61.0%) | 0 (0.0%) |
| 2.0x to 2.9x | 48 (32.9%) | 5 (6.2%) |
| 3.0x to 3.9x | 0 (0.0%) | 20 (25.0%) |
| 4.0x or more | 9 (6.2%) | 14 (17.5%) |
| Total | 146 (100.0%) | 80 (100.0%) |
Real Estate Taxes by Mortgage Status in Garrison
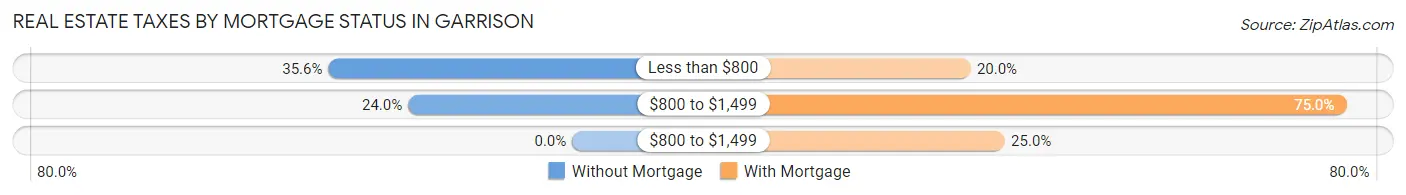
| Property Taxes | Without Mortgage | With Mortgage |
| Less than $800 | 52 (35.6%) | 16 (20.0%) |
| $800 to $1,499 | 35 (24.0%) | 60 (75.0%) |
| $800 to $1,499 | 0 (0.0%) | 20 (25.0%) |
| Total | 146 (100.0%) | 80 (100.0%) |
Health & Disability in Garrison
Health Insurance Coverage by Age in Garrison
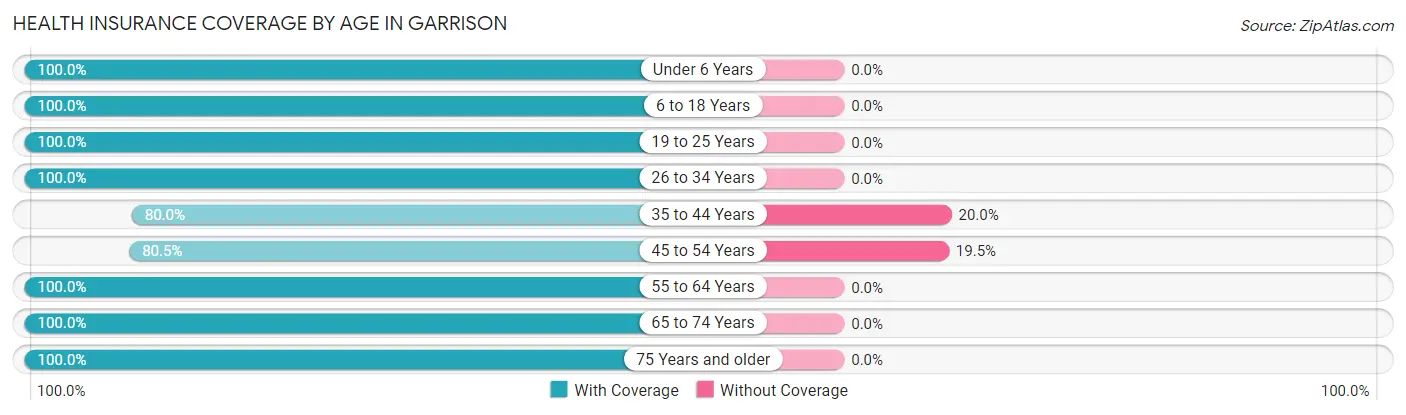
| Age Bracket | With Coverage | Without Coverage |
| Under 6 Years | 56 (100.0%) | 0 (0.0%) |
| 6 to 18 Years | 143 (100.0%) | 0 (0.0%) |
| 19 to 25 Years | 25 (100.0%) | 0 (0.0%) |
| 26 to 34 Years | 58 (100.0%) | 0 (0.0%) |
| 35 to 44 Years | 56 (80.0%) | 14 (20.0%) |
| 45 to 54 Years | 66 (80.5%) | 16 (19.5%) |
| 55 to 64 Years | 249 (100.0%) | 0 (0.0%) |
| 65 to 74 Years | 102 (100.0%) | 0 (0.0%) |
| 75 Years and older | 103 (100.0%) | 0 (0.0%) |
| Total | 858 (96.6%) | 30 (3.4%) |
Health Insurance Coverage by Citizenship Status in Garrison
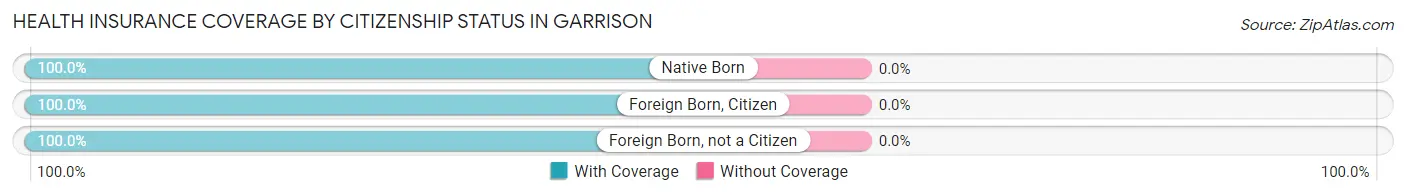
| Citizenship Status | With Coverage | Without Coverage |
| Native Born | 56 (100.0%) | 0 (0.0%) |
| Foreign Born, Citizen | 143 (100.0%) | 0 (0.0%) |
| Foreign Born, not a Citizen | 25 (100.0%) | 0 (0.0%) |
Health Insurance Coverage by Household Income in Garrison
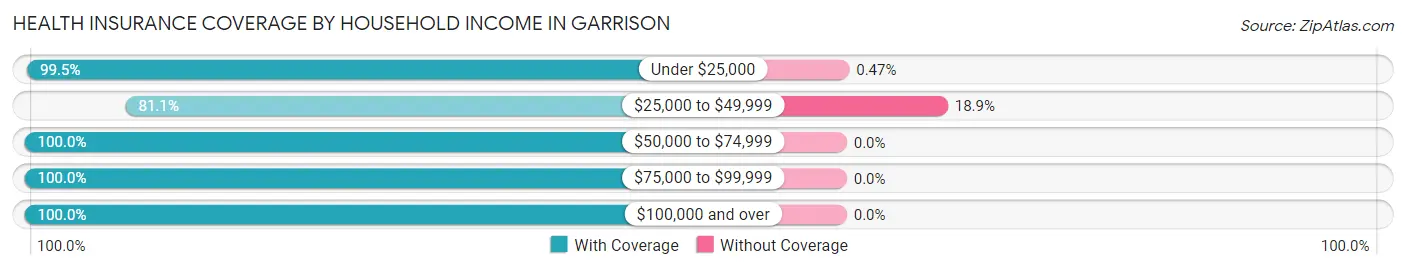
| Household Income | With Coverage | Without Coverage |
| Under $25,000 | 426 (99.5%) | 2 (0.5%) |
| $25,000 to $49,999 | 120 (81.1%) | 28 (18.9%) |
| $50,000 to $74,999 | 142 (100.0%) | 0 (0.0%) |
| $75,000 to $99,999 | 39 (100.0%) | 0 (0.0%) |
| $100,000 and over | 131 (100.0%) | 0 (0.0%) |
Public vs Private Health Insurance Coverage by Age in Garrison
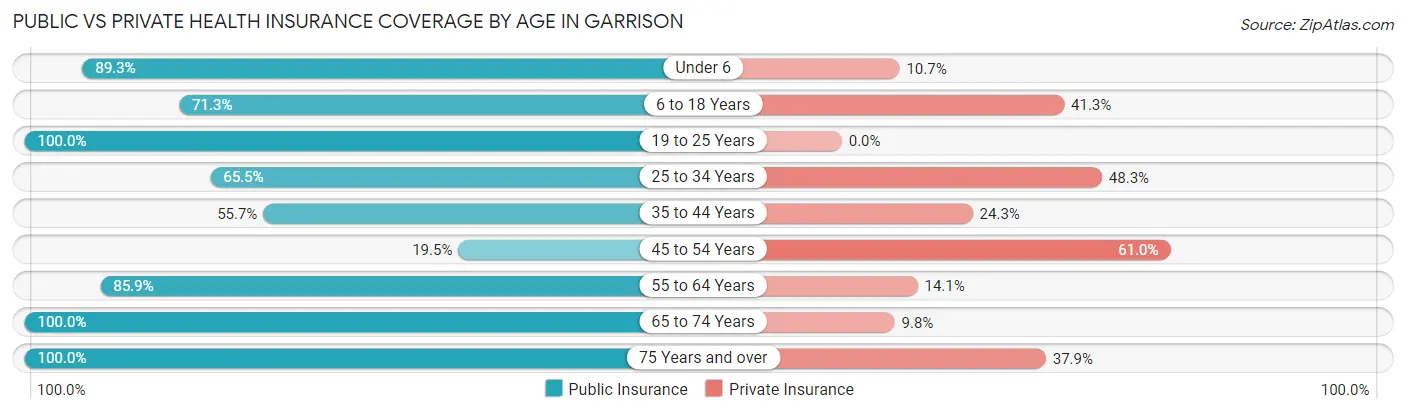
| Age Bracket | Public Insurance | Private Insurance |
| Under 6 | 50 (89.3%) | 6 (10.7%) |
| 6 to 18 Years | 102 (71.3%) | 59 (41.3%) |
| 19 to 25 Years | 25 (100.0%) | 0 (0.0%) |
| 25 to 34 Years | 38 (65.5%) | 28 (48.3%) |
| 35 to 44 Years | 39 (55.7%) | 17 (24.3%) |
| 45 to 54 Years | 16 (19.5%) | 50 (61.0%) |
| 55 to 64 Years | 214 (85.9%) | 35 (14.1%) |
| 65 to 74 Years | 102 (100.0%) | 10 (9.8%) |
| 75 Years and over | 103 (100.0%) | 39 (37.9%) |
| Total | 689 (77.6%) | 244 (27.5%) |
Disability Status by Sex by Age in Garrison
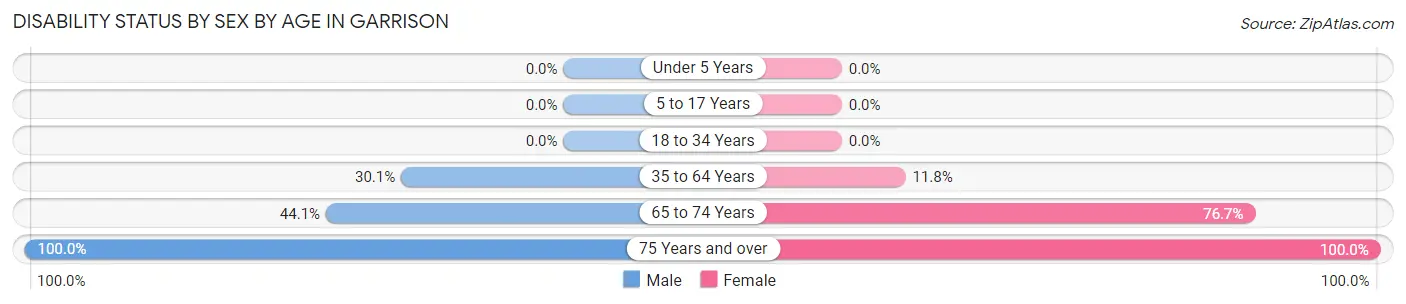
| Age Bracket | Male | Female |
| Under 5 Years | 0 (0.0%) | 0 (0.0%) |
| 5 to 17 Years | 0 (0.0%) | 0 (0.0%) |
| 18 to 34 Years | 0 (0.0%) | 0 (0.0%) |
| 35 to 64 Years | 47 (30.1%) | 29 (11.8%) |
| 65 to 74 Years | 26 (44.1%) | 33 (76.7%) |
| 75 Years and over | 14 (100.0%) | 89 (100.0%) |
Disability Class by Sex by Age in Garrison
Disability Class: Hearing Difficulty
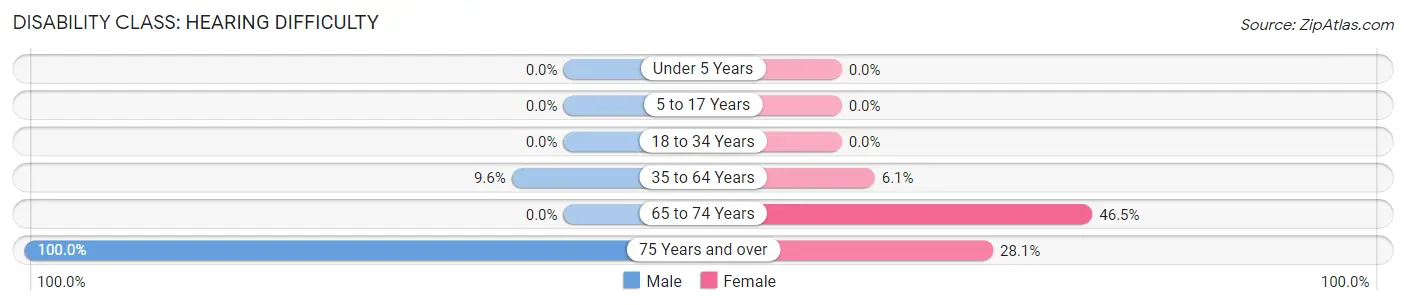
| Age Bracket | Male | Female |
| Under 5 Years | 0 (0.0%) | 0 (0.0%) |
| 5 to 17 Years | 0 (0.0%) | 0 (0.0%) |
| 18 to 34 Years | 0 (0.0%) | 0 (0.0%) |
| 35 to 64 Years | 15 (9.6%) | 15 (6.1%) |
| 65 to 74 Years | 0 (0.0%) | 20 (46.5%) |
| 75 Years and over | 14 (100.0%) | 25 (28.1%) |
Disability Class: Vision Difficulty

| Age Bracket | Male | Female |
| Under 5 Years | 0 (0.0%) | 0 (0.0%) |
| 5 to 17 Years | 0 (0.0%) | 0 (0.0%) |
| 18 to 34 Years | 0 (0.0%) | 0 (0.0%) |
| 35 to 64 Years | 32 (20.5%) | 0 (0.0%) |
| 65 to 74 Years | 26 (44.1%) | 0 (0.0%) |
| 75 Years and over | 0 (0.0%) | 25 (28.1%) |
Disability Class: Cognitive Difficulty
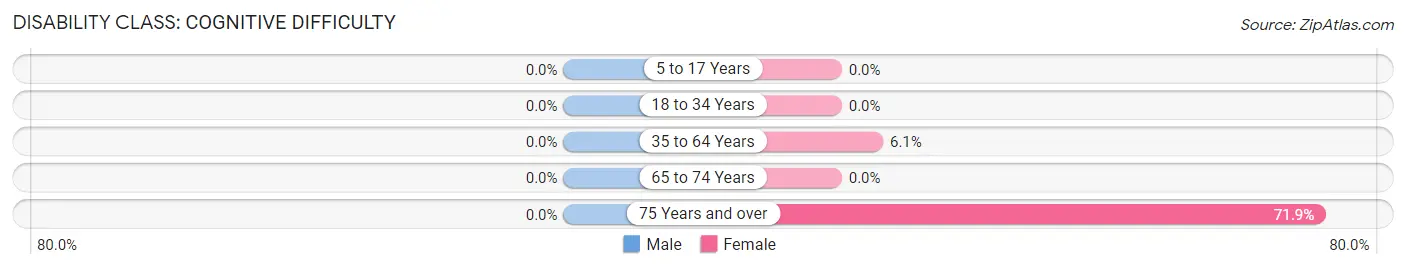
| Age Bracket | Male | Female |
| 5 to 17 Years | 0 (0.0%) | 0 (0.0%) |
| 18 to 34 Years | 0 (0.0%) | 0 (0.0%) |
| 35 to 64 Years | 0 (0.0%) | 15 (6.1%) |
| 65 to 74 Years | 0 (0.0%) | 0 (0.0%) |
| 75 Years and over | 0 (0.0%) | 64 (71.9%) |
Disability Class: Ambulatory Difficulty
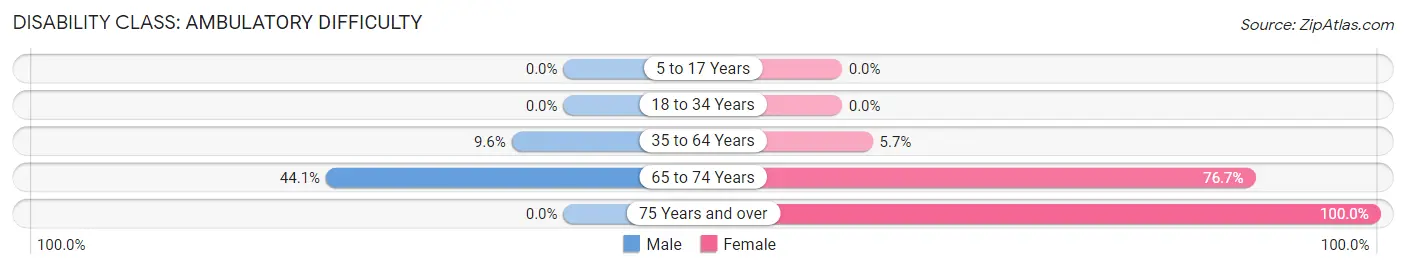
| Age Bracket | Male | Female |
| 5 to 17 Years | 0 (0.0%) | 0 (0.0%) |
| 18 to 34 Years | 0 (0.0%) | 0 (0.0%) |
| 35 to 64 Years | 15 (9.6%) | 14 (5.7%) |
| 65 to 74 Years | 26 (44.1%) | 33 (76.7%) |
| 75 Years and over | 0 (0.0%) | 89 (100.0%) |
Disability Class: Self-Care Difficulty
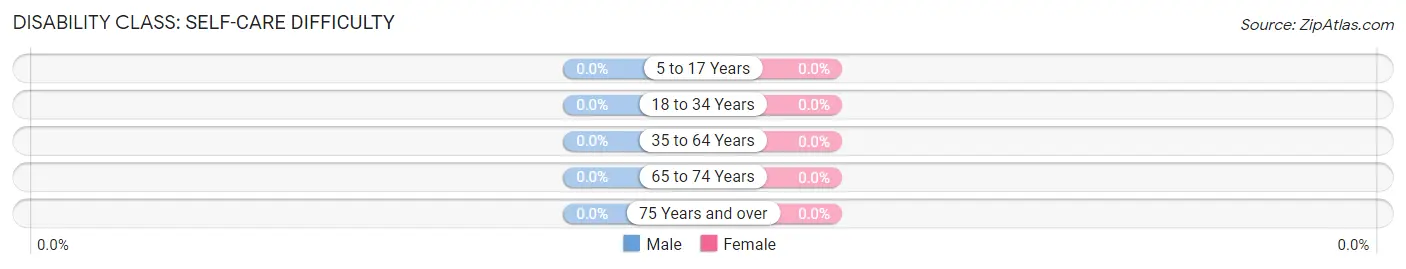
| Age Bracket | Male | Female |
| 5 to 17 Years | 0 (0.0%) | 0 (0.0%) |
| 18 to 34 Years | 0 (0.0%) | 0 (0.0%) |
| 35 to 64 Years | 0 (0.0%) | 0 (0.0%) |
| 65 to 74 Years | 0 (0.0%) | 0 (0.0%) |
| 75 Years and over | 0 (0.0%) | 0 (0.0%) |
Technology Access in Garrison
Computing Device Access in Garrison
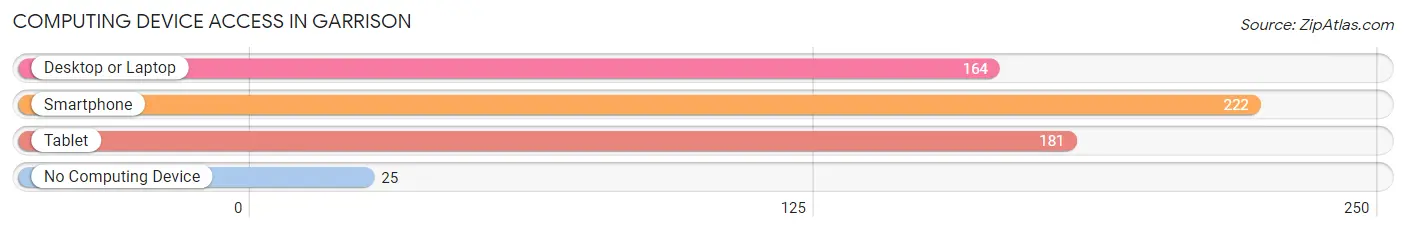
| Device Type | # Households | % Households |
| Desktop or Laptop | 164 | 61.0% |
| Smartphone | 222 | 82.5% |
| Tablet | 181 | 67.3% |
| No Computing Device | 25 | 9.3% |
| Total | 269 | 100.0% |
Internet Access in Garrison
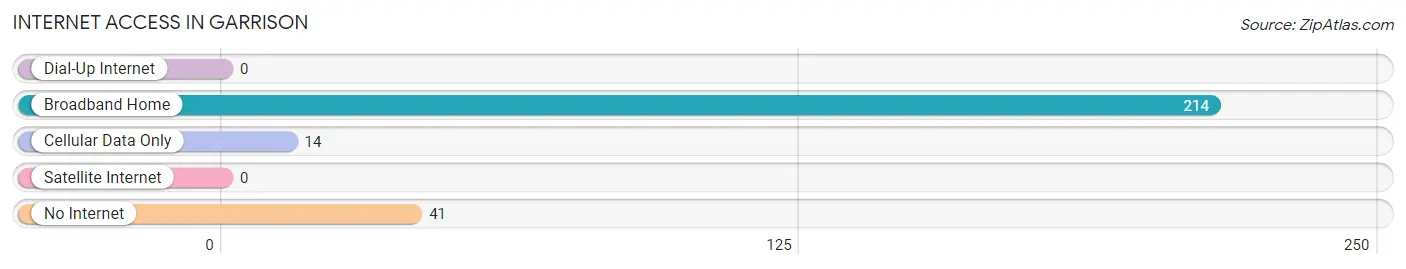
| Internet Type | # Households | % Households |
| Dial-Up Internet | 0 | 0.0% |
| Broadband Home | 214 | 79.5% |
| Cellular Data Only | 14 | 5.2% |
| Satellite Internet | 0 | 0.0% |
| No Internet | 41 | 15.2% |
| Total | 269 | 100.0% |
Garrison Summary
Garrison, Kentucky is a small town located in the western part of the state, in the foothills of the Appalachian Mountains. It is situated in the county of Lewis, and is part of the Maysville Micropolitan Statistical Area. The town has a population of just over 500 people, and is known for its rural charm and friendly atmosphere.
History
Garrison was founded in 1818 by a group of settlers from Virginia. The town was named after a Revolutionary War hero, General William Garrison. The town was originally a farming community, and the main crops grown were corn, wheat, and tobacco. In the late 19th century, the town began to grow and develop, and by the early 20th century, it had become a thriving community.
Geography
Garrison is located in the western part of Lewis County, in the foothills of the Appalachian Mountains. The town is situated on the banks of the Licking River, and is surrounded by rolling hills and lush forests. The climate in Garrison is humid and subtropical, with hot summers and mild winters.
Economy
Garrison’s economy is largely based on agriculture and tourism. The town is home to several small farms, which produce a variety of crops, including corn, wheat, and tobacco. The town also has a thriving tourism industry, with visitors coming to enjoy the rural charm and natural beauty of the area.
Demographics
As of the 2010 census, the population of Garrison was 514 people. The racial makeup of the town was 97.3% White, 0.6% African American, 0.2% Native American, 0.2% Asian, and 1.7% from other races. The median household income was $30,938, and the median family income was $37,500.
Garrison is a small town with a rich history and a friendly atmosphere. It is a great place to live, work, and raise a family. The town is surrounded by natural beauty, and offers a variety of activities for visitors and residents alike.
Common Questions
What is Per Capita Income in Garrison?
Per Capita income in Garrison is $17,551.
What is the Median Household income in Garrison?
Median Household Income in Garrison is $40,156.
What is Inequality or Gini Index in Garrison?
Inequality or Gini Index in Garrison is 0.48.
What is the Total Population of Garrison?
Total Population of Garrison is 888.
What is the Total Male Population of Garrison?
Total Male Population of Garrison is 419.
What is the Total Female Population of Garrison?
Total Female Population of Garrison is 469.
What is the Ratio of Males per 100 Females in Garrison?
There are 89.34 Males per 100 Females in Garrison.
What is the Ratio of Females per 100 Males in Garrison?
There are 111.93 Females per 100 Males in Garrison.
What is the Median Population Age in Garrison?
Median Population Age in Garrison is 55.7 Years.
What is the Average Family Size in Garrison
Average Family Size in Garrison is 4.2 People.
What is the Average Household Size in Garrison
Average Household Size in Garrison is 3.3 People.
How Large is the Labor Force in Garrison?
There are 177 People in the Labor Forcein in Garrison.
What is the Percentage of People in the Labor Force in Garrison?
25.1% of People are in the Labor Force in Garrison.
What is the Unemployment Rate in Garrison?
Unemployment Rate in Garrison is 6.8%.