Salyersville, KY Map & Demographics
Salyersville Map
Salyersville Overview
$17,190
PER CAPITA INCOME
$29,280
AVG HOUSEHOLD INCOME
27.9%
WAGE / INCOME GAP [ % ]
72.1¢/ $1
WAGE / INCOME GAP [ $ ]
$9,932
FAMILY INCOME DEFICIT
0.46
INEQUALITY / GINI INDEX
1,880
TOTAL POPULATION
943
MALE POPULATION
937
FEMALE POPULATION
100.64
MALES / 100 FEMALES
99.36
FEMALES / 100 MALES
49.8
MEDIAN AGE
3.1
AVG FAMILY SIZE
2.3
AVG HOUSEHOLD SIZE
434
LABOR FORCE [ PEOPLE ]
28.6%
PERCENT IN LABOR FORCE
8.1%
UNEMPLOYMENT RATE
Salyersville Zip Codes
Salyersville Area Codes
Income in Salyersville
Income Overview in Salyersville
| Characteristic | Number | Measure |
| Per Capita Income | 1,880 | $17,190 |
| Median Family Income | 398 | $0 |
| Mean Family Income | 398 | $47,959 |
| Median Household Income | 759 | $29,280 |
| Mean Household Income | 759 | $39,980 |
| Income Deficit | 398 | $9,932 |
| Wage / Income Gap (%) | 1,880 | 27.91% |
| Wage / Income Gap ($) | 1,880 | 72.09¢ per $1 |
| Gini / Inequality Index | 1,880 | 0.46 |
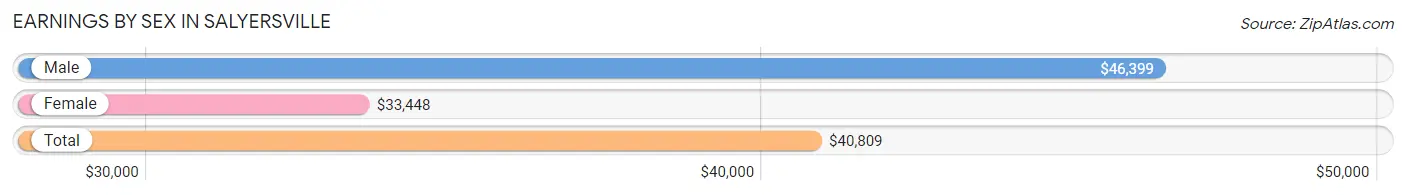
Earnings by Sex in Salyersville
Average Earnings in Salyersville are $40,809, $46,399 for men and $33,448 for women, a difference of 27.9%.
| Sex | Number | Average Earnings |
| Male | 245 (58.8%) | $46,399 |
| Female | 172 (41.2%) | $33,448 |
| Total | 417 (100.0%) | $40,809 |
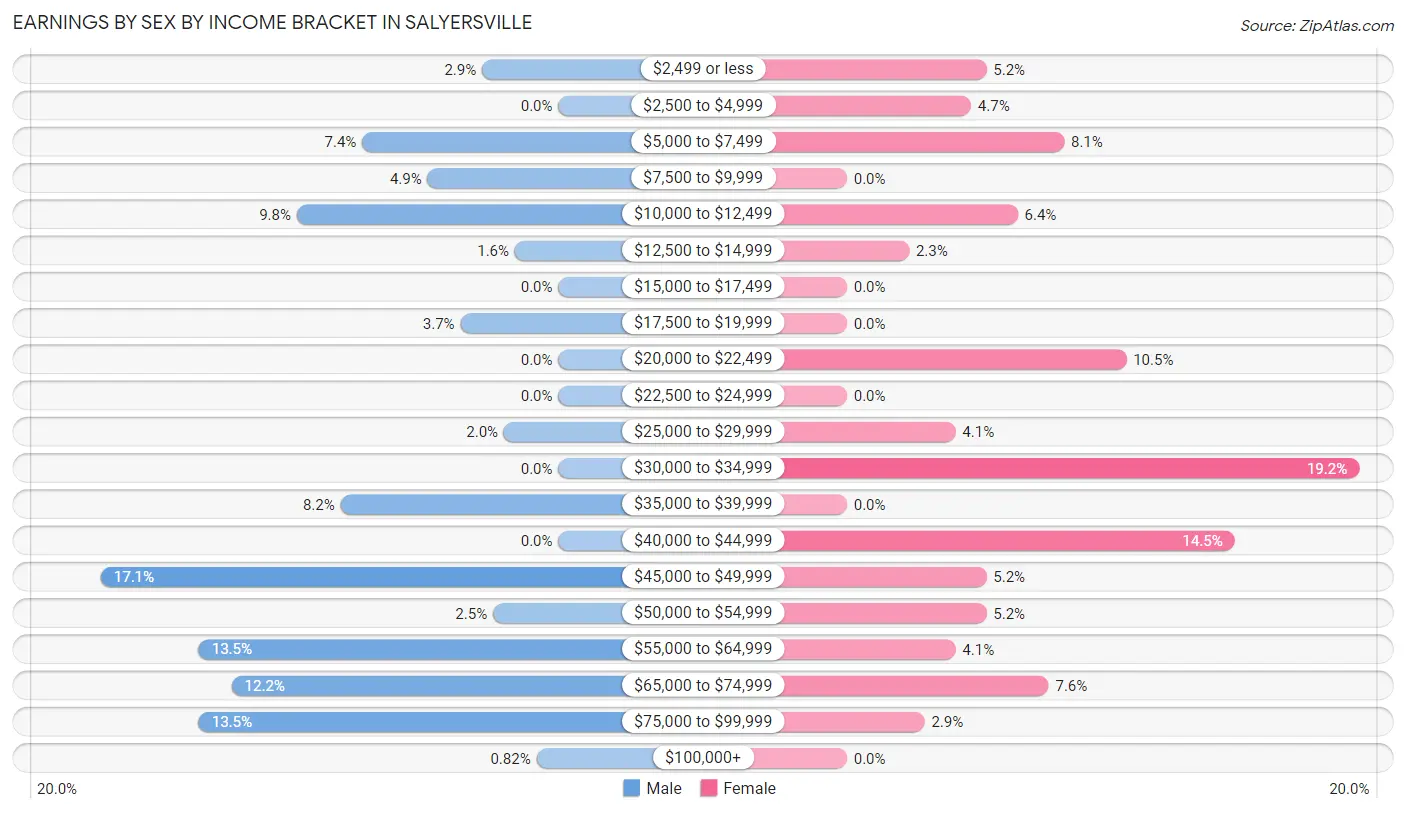
Earnings by Sex by Income Bracket in Salyersville
The most common earnings brackets in Salyersville are $45,000 to $49,999 for men (42 | 17.1%) and $30,000 to $34,999 for women (33 | 19.2%).
| Income | Male | Female |
| $2,499 or less | 7 (2.9%) | 9 (5.2%) |
| $2,500 to $4,999 | 0 (0.0%) | 8 (4.6%) |
| $5,000 to $7,499 | 18 (7.3%) | 14 (8.1%) |
| $7,500 to $9,999 | 12 (4.9%) | 0 (0.0%) |
| $10,000 to $12,499 | 24 (9.8%) | 11 (6.4%) |
| $12,500 to $14,999 | 4 (1.6%) | 4 (2.3%) |
| $15,000 to $17,499 | 0 (0.0%) | 0 (0.0%) |
| $17,500 to $19,999 | 9 (3.7%) | 0 (0.0%) |
| $20,000 to $22,499 | 0 (0.0%) | 18 (10.5%) |
| $22,500 to $24,999 | 0 (0.0%) | 0 (0.0%) |
| $25,000 to $29,999 | 5 (2.0%) | 7 (4.1%) |
| $30,000 to $34,999 | 0 (0.0%) | 33 (19.2%) |
| $35,000 to $39,999 | 20 (8.2%) | 0 (0.0%) |
| $40,000 to $44,999 | 0 (0.0%) | 25 (14.5%) |
| $45,000 to $49,999 | 42 (17.1%) | 9 (5.2%) |
| $50,000 to $54,999 | 6 (2.5%) | 9 (5.2%) |
| $55,000 to $64,999 | 33 (13.5%) | 7 (4.1%) |
| $65,000 to $74,999 | 30 (12.2%) | 13 (7.6%) |
| $75,000 to $99,999 | 33 (13.5%) | 5 (2.9%) |
| $100,000+ | 2 (0.8%) | 0 (0.0%) |
| Total | 245 (100.0%) | 172 (100.0%) |
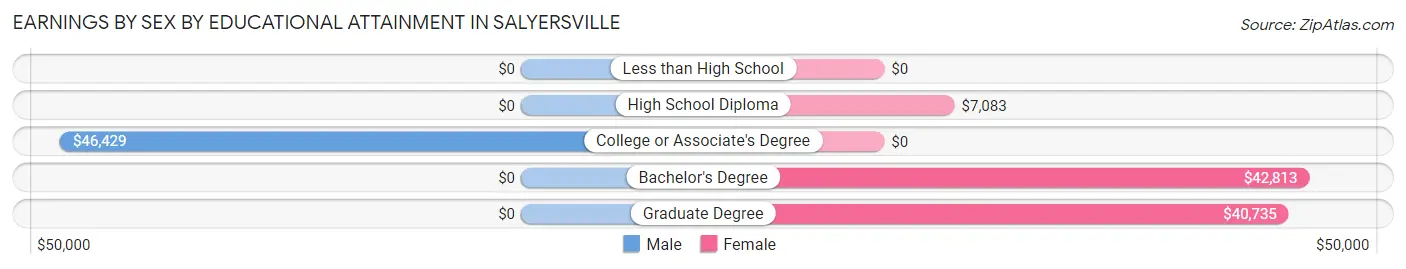
Earnings by Sex by Educational Attainment in Salyersville
Average earnings in Salyersville are $46,875 for men and $34,181 for women, a difference of 27.1%. Men with an educational attainment of college or associate's degree enjoy the highest average annual earnings of $46,429, while those with college or associate's degree education earn the least with $46,429. Women with an educational attainment of bachelor's degree earn the most with the average annual earnings of $42,813, while those with high school diploma education have the smallest earnings of $7,083.
| Educational Attainment | Male Income | Female Income |
| Less than High School | - | - |
| High School Diploma | - | - |
| College or Associate's Degree | $46,429 | $0 |
| Bachelor's Degree | - | - |
| Graduate Degree | - | - |
| Total | $46,875 | $34,181 |
Family Income in Salyersville
Family Income Brackets in Salyersville
According to the Salyersville family income data, there are 86 families falling into the $50,000 to $74,999 income range, which is the most common income bracket and makes up 21.6% of all families.
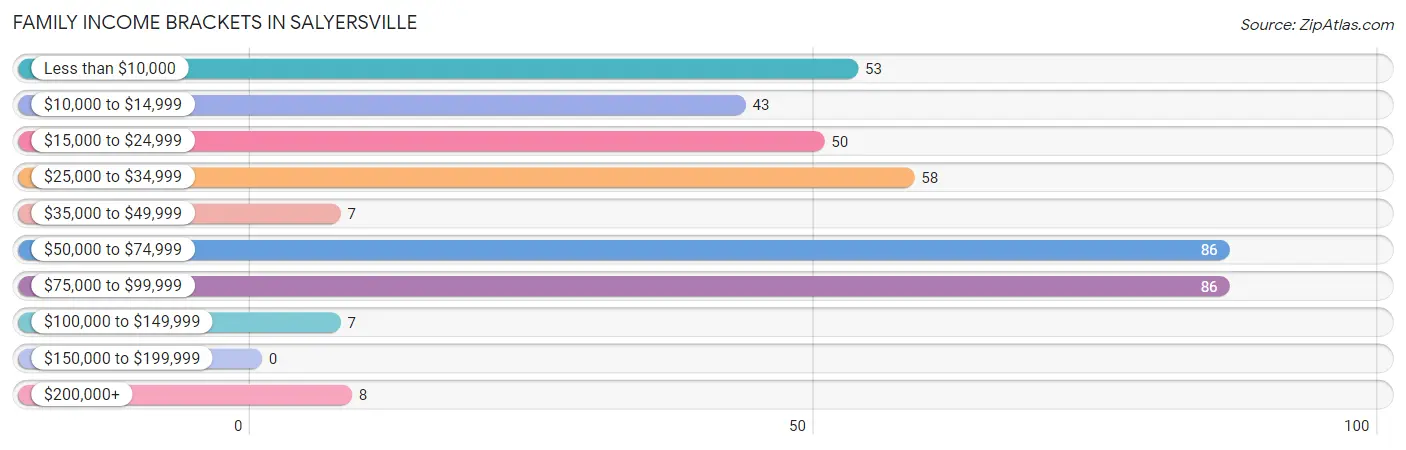
| Income Bracket | # Families | % Families |
| Less than $10,000 | 53 | 13.3% |
| $10,000 to $14,999 | 43 | 10.8% |
| $15,000 to $24,999 | 50 | 12.6% |
| $25,000 to $34,999 | 58 | 14.6% |
| $35,000 to $49,999 | 7 | 1.8% |
| $50,000 to $74,999 | 86 | 21.6% |
| $75,000 to $99,999 | 86 | 21.6% |
| $100,000 to $149,999 | 7 | 1.8% |
| $150,000 to $199,999 | 0 | 0.0% |
| $200,000+ | 8 | 2.0% |
Family Income by Famaliy Size in Salyersville
5-person families (60 | 15.1%) account for the highest median family income in Salyersville with $74,868 per family, while 5-person families (60 | 15.1%) have the highest median income of $14,974 per family member.
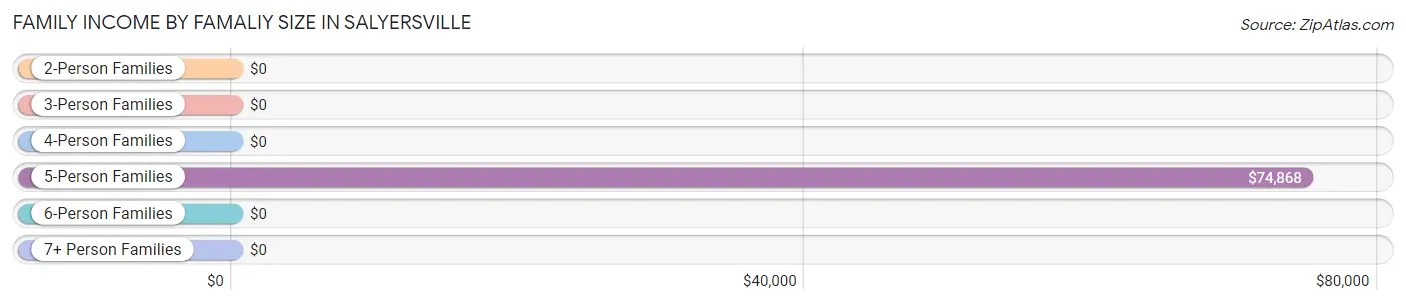
| Income Bracket | # Families | Median Income |
| 2-Person Families | 232 (58.3%) | $0 |
| 3-Person Families | 44 (11.1%) | $0 |
| 4-Person Families | 46 (11.6%) | $0 |
| 5-Person Families | 60 (15.1%) | $74,868 |
| 6-Person Families | 6 (1.5%) | $0 |
| 7+ Person Families | 10 (2.5%) | $0 |
| Total | 398 (100.0%) | $0 |
Family Income by Number of Earners in Salyersville
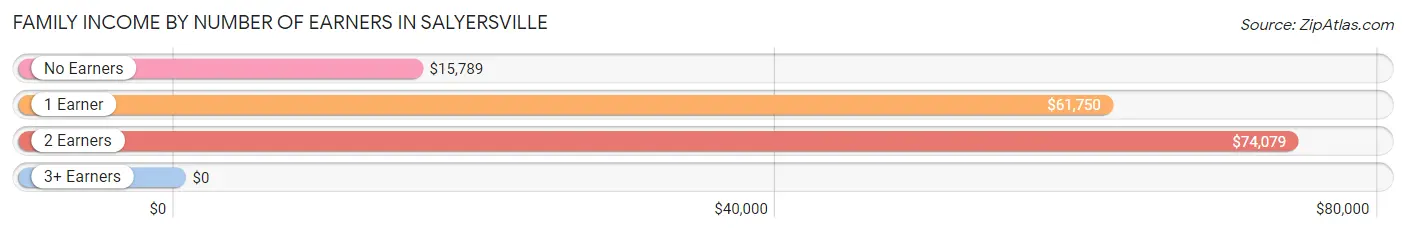
| Number of Earners | # Families | Median Income |
| No Earners | 200 (50.2%) | $15,789 |
| 1 Earner | 136 (34.2%) | $61,750 |
| 2 Earners | 50 (12.6%) | $74,079 |
| 3+ Earners | 12 (3.0%) | $0 |
| Total | 398 (100.0%) | $0 |
Household Income in Salyersville
Household Income Brackets in Salyersville
With 130 households falling in the category, the $75,000 to $99,999 income range is the most frequent in Salyersville, accounting for 17.1% of all households.
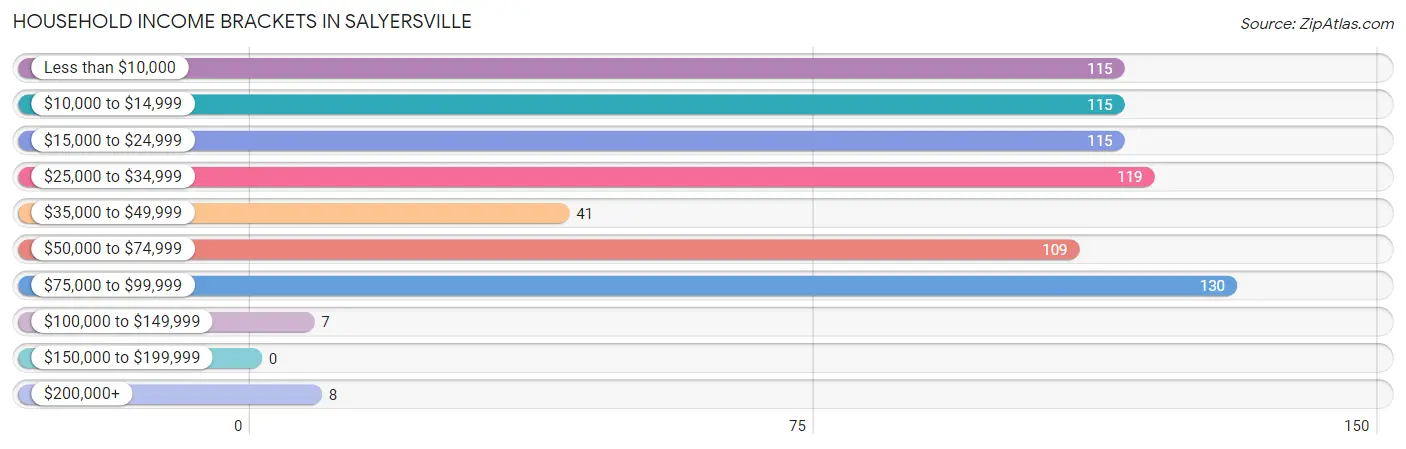
| Income Bracket | # Households | % Households |
| Less than $10,000 | 115 | 15.2% |
| $10,000 to $14,999 | 115 | 15.2% |
| $15,000 to $24,999 | 115 | 15.2% |
| $25,000 to $34,999 | 119 | 15.7% |
| $35,000 to $49,999 | 41 | 5.4% |
| $50,000 to $74,999 | 109 | 14.4% |
| $75,000 to $99,999 | 130 | 17.1% |
| $100,000 to $149,999 | 7 | 0.9% |
| $150,000 to $199,999 | 0 | 0.0% |
| $200,000+ | 8 | 1.1% |
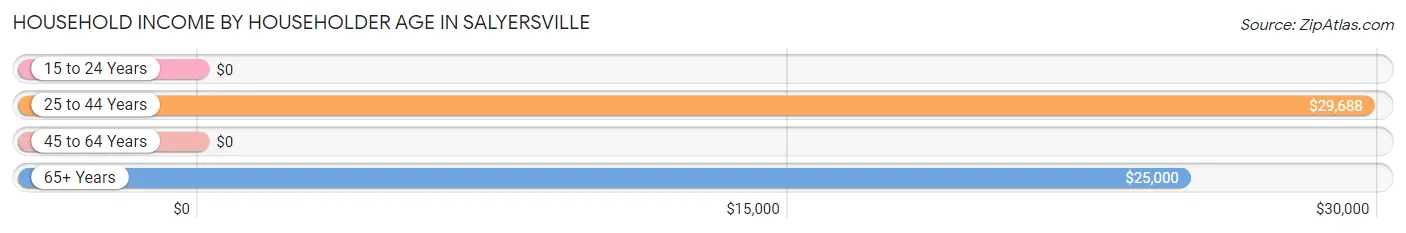
Household Income by Householder Age in Salyersville
The median household income in Salyersville is $29,280, with the highest median household income of $29,688 found in the 25 to 44 years age bracket for the primary householder. A total of 169 households (22.3%) fall into this category. Meanwhile, the 15 to 24 years age bracket for the primary householder has the lowest median household income of $0, with 12 households (1.6%) in this group.
| Income Bracket | # Households | Median Income |
| 15 to 24 Years | 12 (1.6%) | $0 |
| 25 to 44 Years | 169 (22.3%) | $29,688 |
| 45 to 64 Years | 408 (53.7%) | $0 |
| 65+ Years | 170 (22.4%) | $25,000 |
| Total | 759 (100.0%) | $29,280 |
Poverty in Salyersville
Income Below Poverty by Sex and Age in Salyersville
With 39.1% poverty level for males and 48.8% for females among the residents of Salyersville, under 5 year old males and 16 and 17 year old females are the most vulnerable to poverty, with 25 males (100.0%) and 21 females (100.0%) in their respective age groups living below the poverty level.
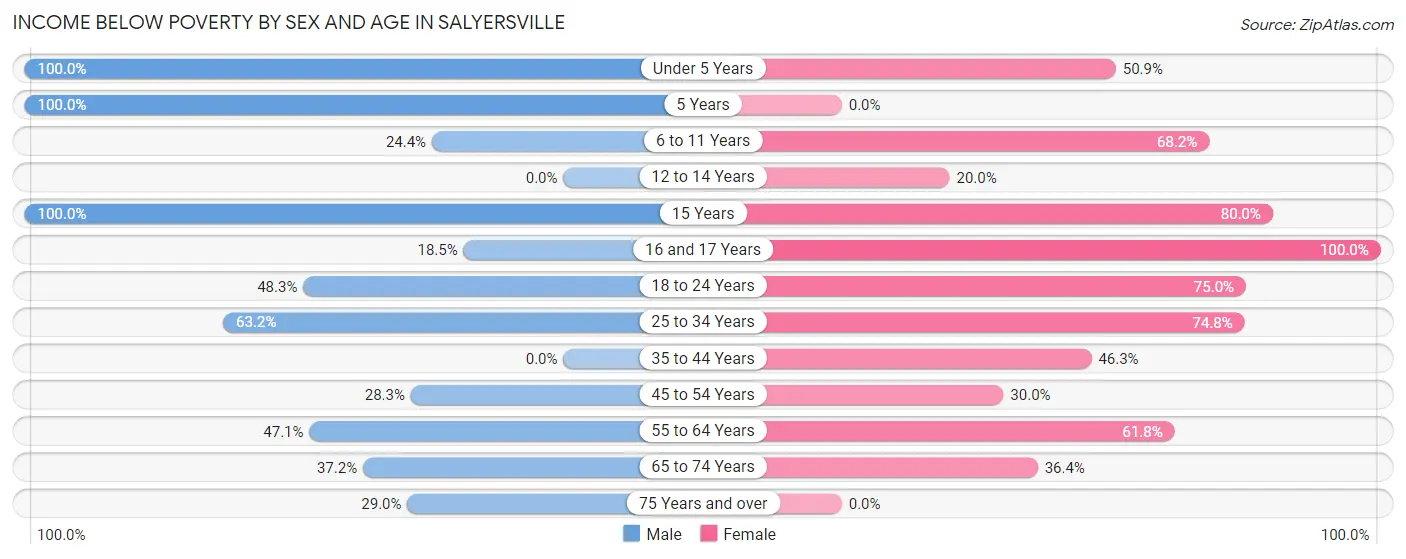
| Age Bracket | Male | Female |
| Under 5 Years | 25 (100.0%) | 59 (50.9%) |
| 5 Years | 15 (100.0%) | 0 (0.0%) |
| 6 to 11 Years | 10 (24.4%) | 30 (68.2%) |
| 12 to 14 Years | 0 (0.0%) | 5 (20.0%) |
| 15 Years | 48 (100.0%) | 20 (80.0%) |
| 16 and 17 Years | 15 (18.5%) | 21 (100.0%) |
| 18 to 24 Years | 14 (48.3%) | 27 (75.0%) |
| 25 to 34 Years | 24 (63.2%) | 77 (74.8%) |
| 35 to 44 Years | 0 (0.0%) | 38 (46.3%) |
| 45 to 54 Years | 62 (28.3%) | 36 (30.0%) |
| 55 to 64 Years | 66 (47.1%) | 63 (61.8%) |
| 65 to 74 Years | 45 (37.2%) | 40 (36.4%) |
| 75 Years and over | 22 (28.9%) | 0 (0.0%) |
| Total | 346 (39.1%) | 416 (48.8%) |
Income Above Poverty by Sex and Age in Salyersville
According to the poverty statistics in Salyersville, males aged 35 to 44 years and females aged 5 years are the age groups that are most secure financially, with 100.0% of males and 100.0% of females in these age groups living above the poverty line.
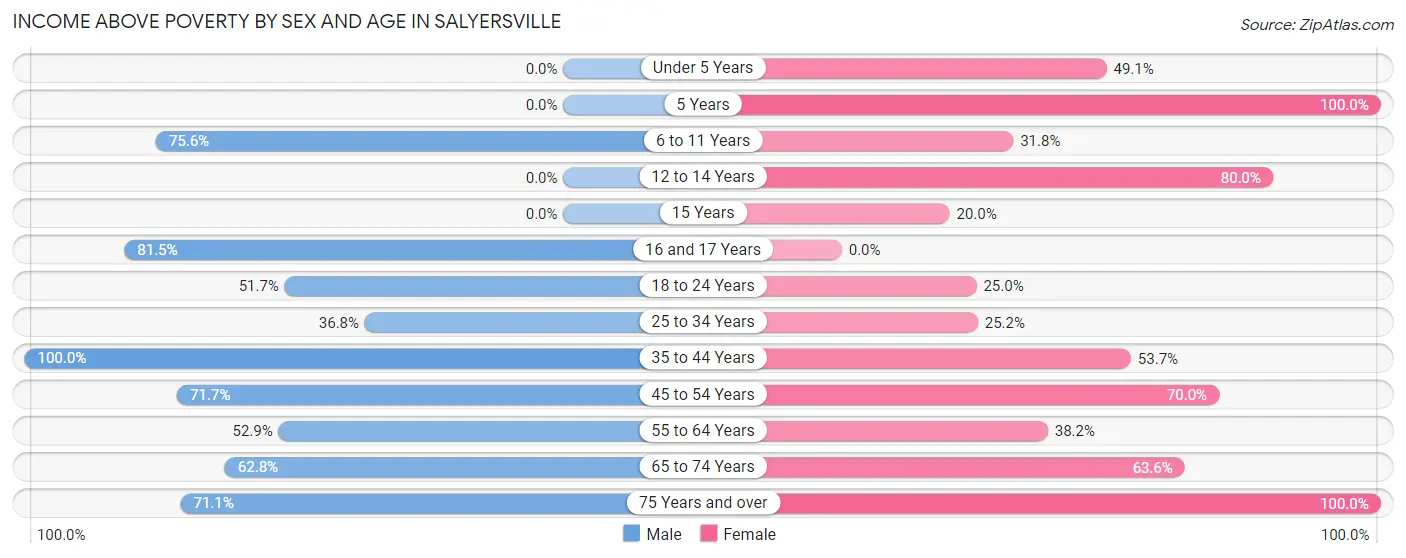
| Age Bracket | Male | Female |
| Under 5 Years | 0 (0.0%) | 57 (49.1%) |
| 5 Years | 0 (0.0%) | 12 (100.0%) |
| 6 to 11 Years | 31 (75.6%) | 14 (31.8%) |
| 12 to 14 Years | 0 (0.0%) | 20 (80.0%) |
| 15 Years | 0 (0.0%) | 5 (20.0%) |
| 16 and 17 Years | 66 (81.5%) | 0 (0.0%) |
| 18 to 24 Years | 15 (51.7%) | 9 (25.0%) |
| 25 to 34 Years | 14 (36.8%) | 26 (25.2%) |
| 35 to 44 Years | 53 (100.0%) | 44 (53.7%) |
| 45 to 54 Years | 157 (71.7%) | 84 (70.0%) |
| 55 to 64 Years | 74 (52.9%) | 39 (38.2%) |
| 65 to 74 Years | 76 (62.8%) | 70 (63.6%) |
| 75 Years and over | 54 (71.1%) | 57 (100.0%) |
| Total | 540 (61.0%) | 437 (51.2%) |
Income Below Poverty Among Married-Couple Families in Salyersville
The poverty statistics for married-couple families in Salyersville show that 27.0% or 70 of the total 259 families live below the poverty line. Families with 1 or 2 children have the highest poverty rate of 47.6%, comprising of 20 families. On the other hand, families with 3 or 4 children have the lowest poverty rate of 0.0%, which includes 0 families.
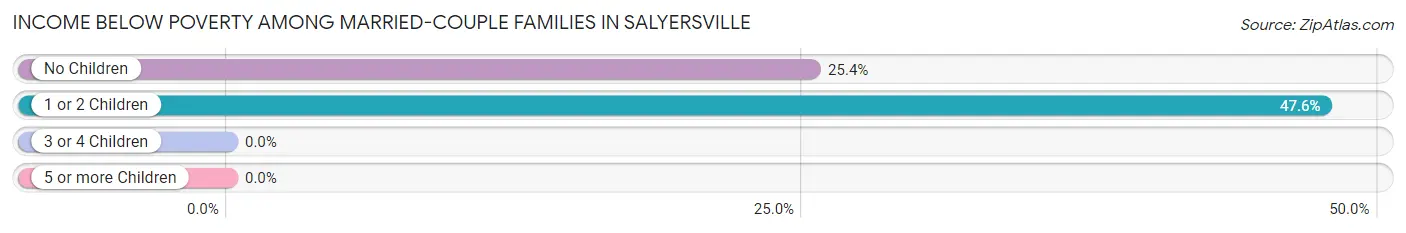
| Children | Above Poverty | Below Poverty |
| No Children | 147 (74.6%) | 50 (25.4%) |
| 1 or 2 Children | 22 (52.4%) | 20 (47.6%) |
| 3 or 4 Children | 10 (100.0%) | 0 (0.0%) |
| 5 or more Children | 10 (100.0%) | 0 (0.0%) |
| Total | 189 (73.0%) | 70 (27.0%) |
Income Below Poverty Among Single-Parent Households in Salyersville
According to the poverty data in Salyersville, 70.8% or 34 single-father households and 60.4% or 55 single-mother households are living below the poverty line. Among single-father households, those with no children have the highest poverty rate, with 23 households (100.0%) experiencing poverty. Likewise, among single-mother households, those with 3 or 4 children have the highest poverty rate, with 16 households (100.0%) falling below the poverty line.
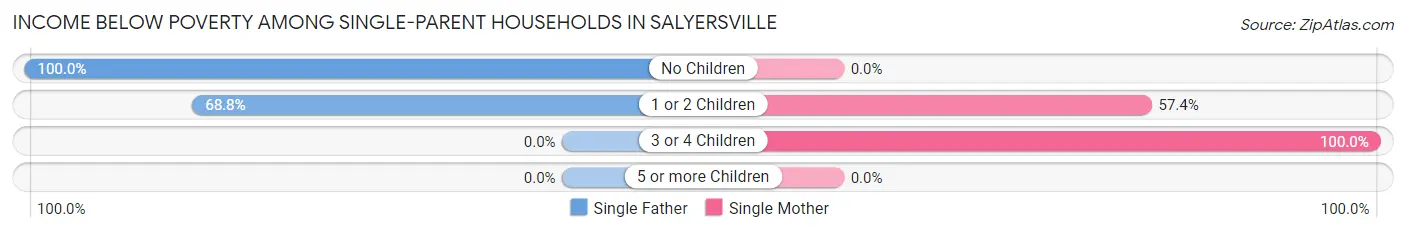
| Children | Single Father | Single Mother |
| No Children | 23 (100.0%) | 0 (0.0%) |
| 1 or 2 Children | 11 (68.8%) | 39 (57.4%) |
| 3 or 4 Children | 0 (0.0%) | 16 (100.0%) |
| 5 or more Children | 0 (0.0%) | 0 (0.0%) |
| Total | 34 (70.8%) | 55 (60.4%) |
Income Below Poverty Among Married-Couple vs Single-Parent Households in Salyersville
The poverty data for Salyersville shows that 70 of the married-couple family households (27.0%) and 89 of the single-parent households (64.0%) are living below the poverty level. Within the married-couple family households, those with 1 or 2 children have the highest poverty rate, with 20 households (47.6%) falling below the poverty line. Among the single-parent households, those with no children have the highest poverty rate, with 23 household (76.7%) living below poverty.
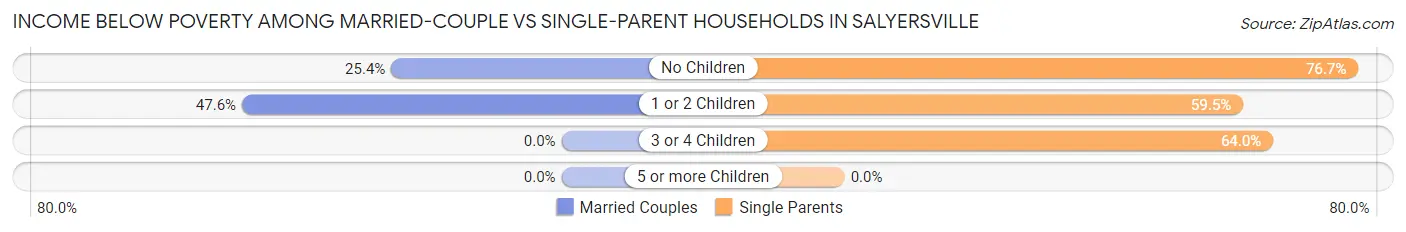
| Children | Married-Couple Families | Single-Parent Households |
| No Children | 50 (25.4%) | 23 (76.7%) |
| 1 or 2 Children | 20 (47.6%) | 50 (59.5%) |
| 3 or 4 Children | 0 (0.0%) | 16 (64.0%) |
| 5 or more Children | 0 (0.0%) | 0 (0.0%) |
| Total | 70 (27.0%) | 89 (64.0%) |
Race in Salyersville
The most populous races in Salyersville are White / Caucasian (1,800 | 95.7%), Hispanic or Latino (71 | 3.8%), and Asian (48 | 2.5%).
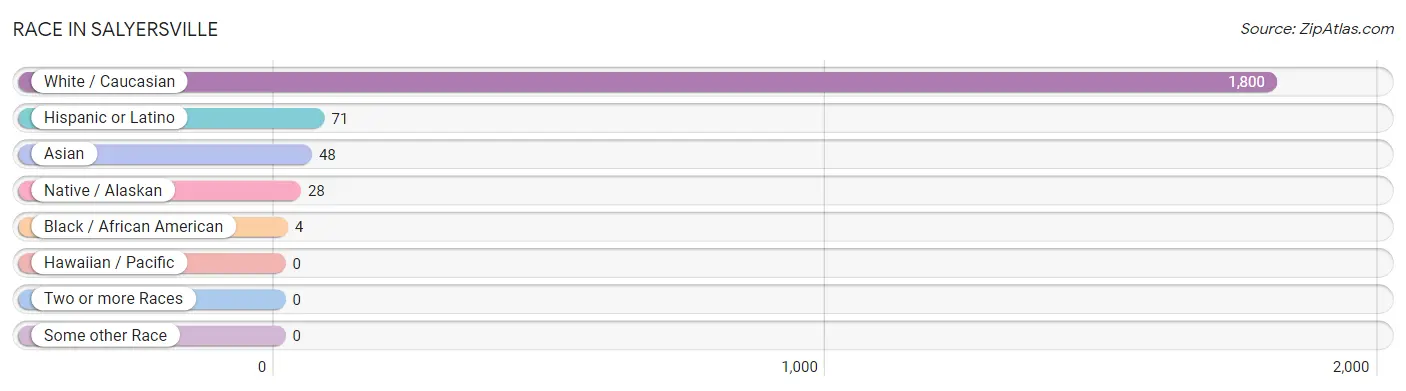
| Race | # Population | % Population |
| Asian | 48 | 2.5% |
| Black / African American | 4 | 0.2% |
| Hawaiian / Pacific | 0 | 0.0% |
| Hispanic or Latino | 71 | 3.8% |
| Native / Alaskan | 28 | 1.5% |
| White / Caucasian | 1,800 | 95.7% |
| Two or more Races | 0 | 0.0% |
| Some other Race | 0 | 0.0% |
| Total | 1,880 | 100.0% |
Ancestry in Salyersville
The most populous ancestries reported in Salyersville are American (595 | 31.7%), Irish (346 | 18.4%), English (219 | 11.7%), German (116 | 6.2%), and Indian (Asian) (48 | 2.5%), together accounting for 70.4% of all Salyersville residents.
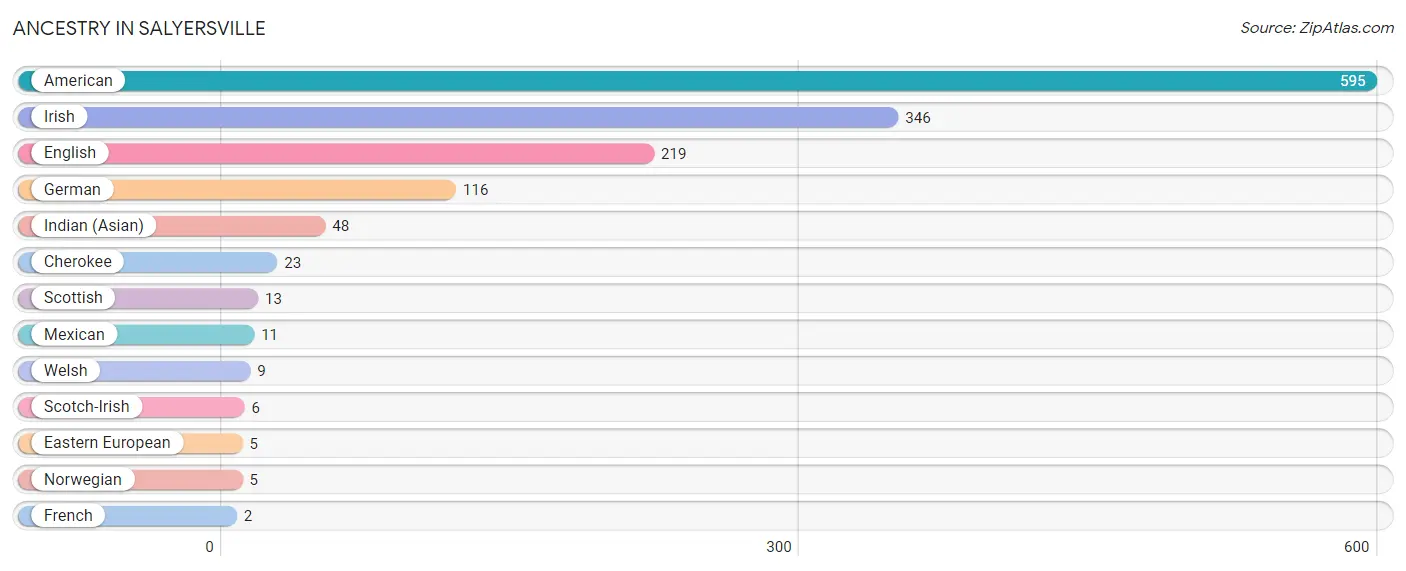
| Ancestry | # Population | % Population |
| American | 595 | 31.7% |
| Cherokee | 23 | 1.2% |
| Eastern European | 5 | 0.3% |
| English | 219 | 11.7% |
| French | 2 | 0.1% |
| German | 116 | 6.2% |
| Indian (Asian) | 48 | 2.5% |
| Irish | 346 | 18.4% |
| Mexican | 11 | 0.6% |
| Norwegian | 5 | 0.3% |
| Scotch-Irish | 6 | 0.3% |
| Scottish | 13 | 0.7% |
| Welsh | 9 | 0.5% | View All 13 Rows |
Immigrants in Salyersville
The most numerous immigrant groups reported in Salyersville came from Asia (48 | 2.5%), China (48 | 2.5%), Eastern Asia (48 | 2.5%), and Taiwan (48 | 2.5%), together accounting for 10.2% of all Salyersville residents.
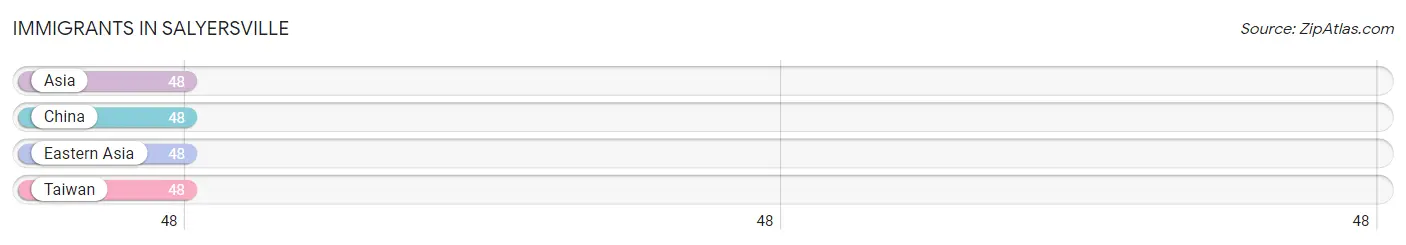
| Immigration Origin | # Population | % Population |
| Asia | 48 | 2.5% |
| China | 48 | 2.5% |
| Eastern Asia | 48 | 2.5% |
| Taiwan | 48 | 2.5% | View All 4 Rows |
Sex and Age in Salyersville
Sex and Age in Salyersville
The most populous age groups in Salyersville are 50 to 54 Years (142 | 15.1%) for men and Under 5 Years (116 | 12.4%) for women.
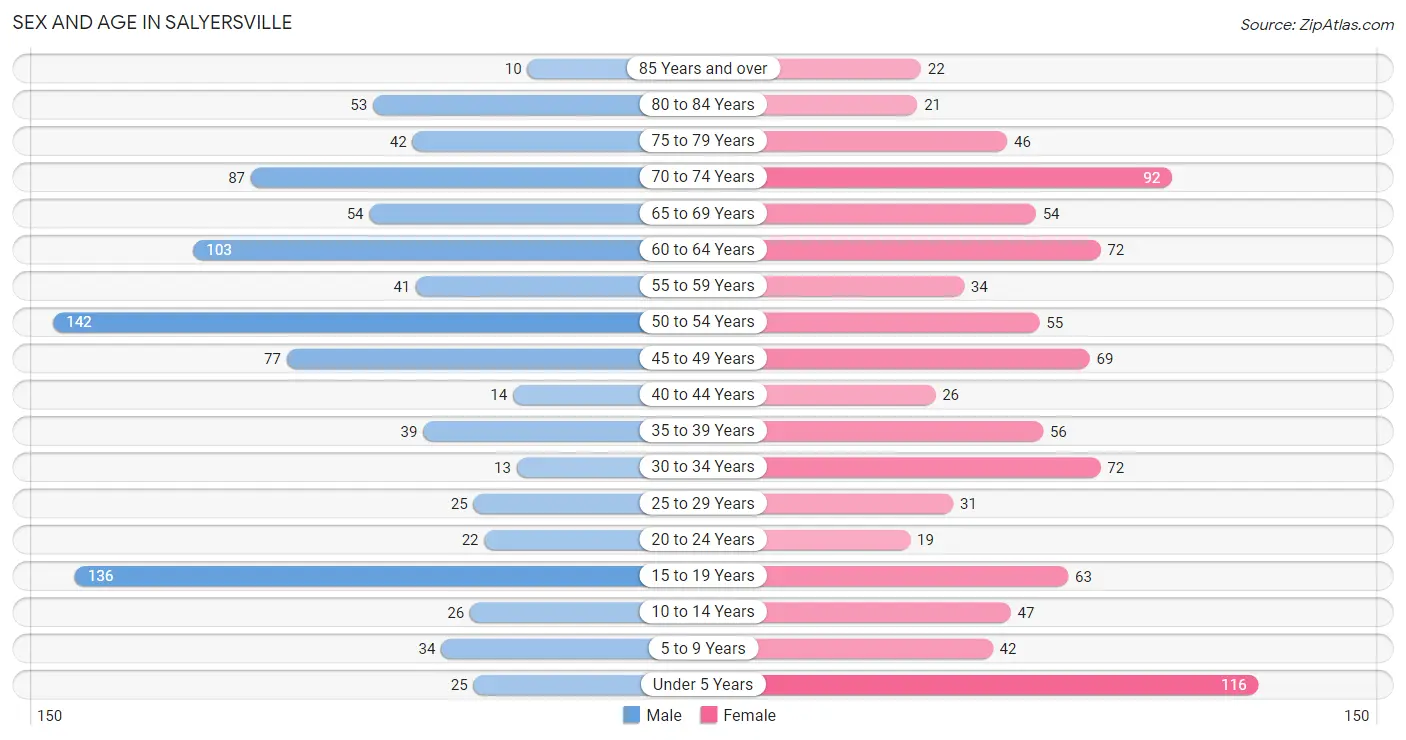
| Age Bracket | Male | Female |
| Under 5 Years | 25 (2.6%) | 116 (12.4%) |
| 5 to 9 Years | 34 (3.6%) | 42 (4.5%) |
| 10 to 14 Years | 26 (2.8%) | 47 (5.0%) |
| 15 to 19 Years | 136 (14.4%) | 63 (6.7%) |
| 20 to 24 Years | 22 (2.3%) | 19 (2.0%) |
| 25 to 29 Years | 25 (2.6%) | 31 (3.3%) |
| 30 to 34 Years | 13 (1.4%) | 72 (7.7%) |
| 35 to 39 Years | 39 (4.1%) | 56 (6.0%) |
| 40 to 44 Years | 14 (1.5%) | 26 (2.8%) |
| 45 to 49 Years | 77 (8.2%) | 69 (7.4%) |
| 50 to 54 Years | 142 (15.1%) | 55 (5.9%) |
| 55 to 59 Years | 41 (4.3%) | 34 (3.6%) |
| 60 to 64 Years | 103 (10.9%) | 72 (7.7%) |
| 65 to 69 Years | 54 (5.7%) | 54 (5.8%) |
| 70 to 74 Years | 87 (9.2%) | 92 (9.8%) |
| 75 to 79 Years | 42 (4.4%) | 46 (4.9%) |
| 80 to 84 Years | 53 (5.6%) | 21 (2.2%) |
| 85 Years and over | 10 (1.1%) | 22 (2.4%) |
| Total | 943 (100.0%) | 937 (100.0%) |
Families and Households in Salyersville
Median Family Size in Salyersville
The median family size in Salyersville is 3.08 persons per family, with single female/mother families (91 | 22.9%) accounting for the largest median family size of 4.08 persons per family. On the other hand, married-couple families (259 | 65.1%) represent the smallest median family size with 2.66 persons per family.
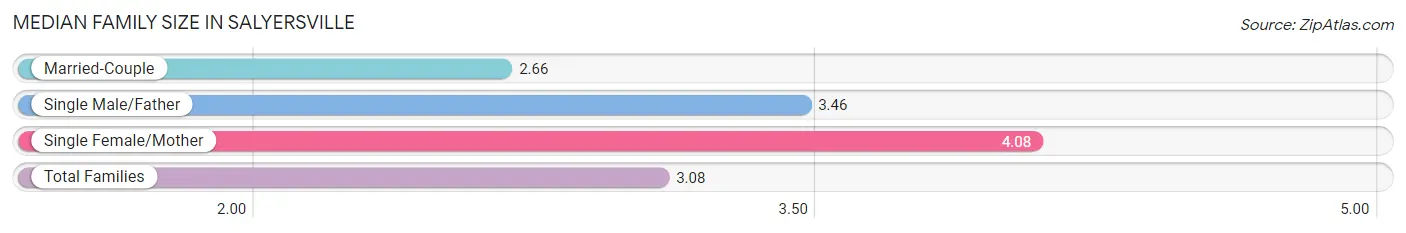
| Family Type | # Families | Family Size |
| Married-Couple | 259 (65.1%) | 2.66 |
| Single Male/Father | 48 (12.1%) | 3.46 |
| Single Female/Mother | 91 (22.9%) | 4.08 |
| Total Families | 398 (100.0%) | 3.08 |
Median Household Size in Salyersville
The median household size in Salyersville is 2.31 persons per household, with single female/mother households (91 | 12.0%) accounting for the largest median household size of 5 persons per household. non-family households (361 | 47.6%) represent the smallest median household size with 1.20 persons per household.
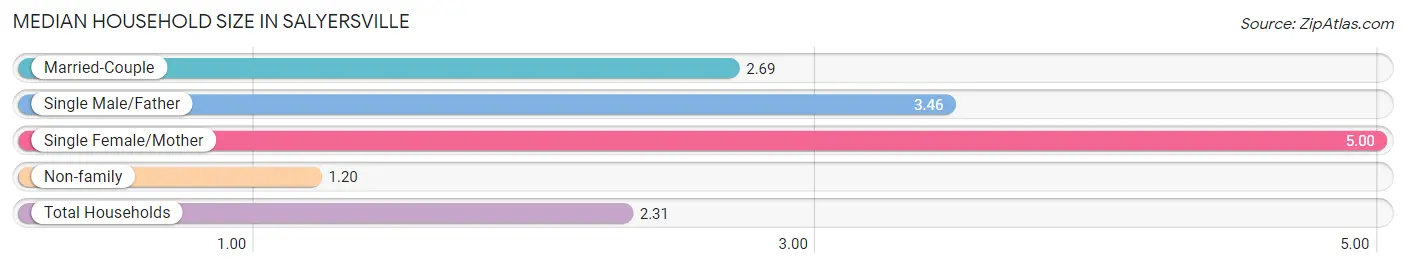
| Household Type | # Households | Household Size |
| Married-Couple | 259 (34.1%) | 2.69 |
| Single Male/Father | 48 (6.3%) | 3.46 |
| Single Female/Mother | 91 (12.0%) | 5.00 |
| Non-family | 361 (47.6%) | 1.20 |
| Total Households | 759 (100.0%) | 2.31 |
Household Size by Marriage Status in Salyersville
Out of a total of 759 households in Salyersville, 398 (52.4%) are family households, while 361 (47.6%) are nonfamily households. The most numerous type of family households are 2-person households, comprising 224, and the most common type of nonfamily households are 1-person households, comprising 315.
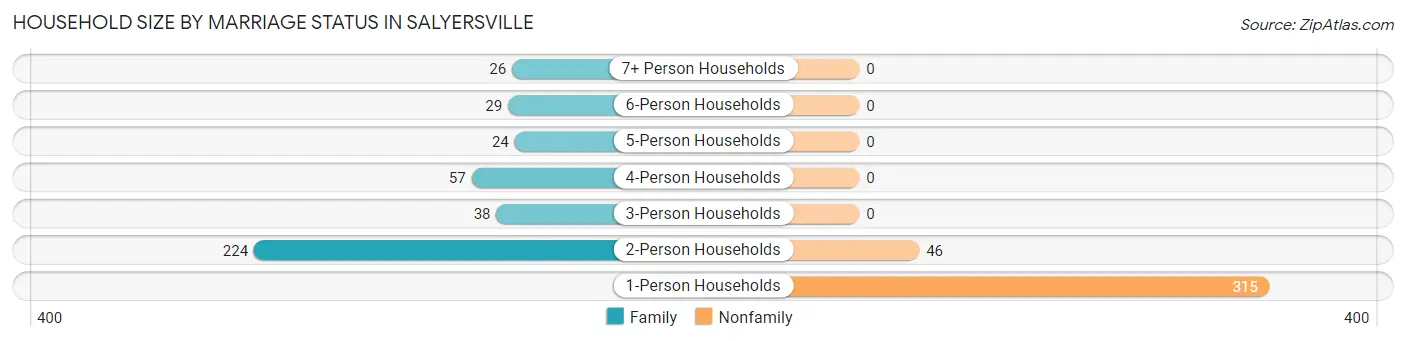
| Household Size | Family Households | Nonfamily Households |
| 1-Person Households | - | 315 (41.5%) |
| 2-Person Households | 224 (29.5%) | 46 (6.1%) |
| 3-Person Households | 38 (5.0%) | 0 (0.0%) |
| 4-Person Households | 57 (7.5%) | 0 (0.0%) |
| 5-Person Households | 24 (3.2%) | 0 (0.0%) |
| 6-Person Households | 29 (3.8%) | 0 (0.0%) |
| 7+ Person Households | 26 (3.4%) | 0 (0.0%) |
| Total | 398 (52.4%) | 361 (47.6%) |
Female Fertility in Salyersville
Fertility by Age in Salyersville
| Age Bracket | Women with Births | Births / 1,000 Women |
| 15 to 19 years | 0 (0.0%) | 0.0 |
| 20 to 34 years | 0 (0.0%) | 0.0 |
| 35 to 50 years | 0 (0.0%) | 0.0 |
| Total | 0 (0.0%) | 0.0 |
Fertility by Age by Marriage Status in Salyersville
| Age Bracket | Married | Unmarried |
| 15 to 19 years | 0 (0.0%) | 0 (0.0%) |
| 20 to 34 years | 0 (0.0%) | 0 (0.0%) |
| 35 to 50 years | 0 (0.0%) | 0 (0.0%) |
| Total | 0 (0.0%) | 0 (0.0%) |
Fertility by Education in Salyersville
| Educational Attainment | Women with Births | Births / 1,000 Women |
| Less than High School | 0 (0.0%) | 0.0 |
| High School Diploma | 0 (0.0%) | 0.0 |
| College or Associate's Degree | 0 (0.0%) | 0.0 |
| Bachelor's Degree | 0 (0.0%) | 0.0 |
| Graduate Degree | 0 (0.0%) | 0.0 |
| Total | 0 (0.0%) | 0.0 |
Fertility by Education by Marriage Status in Salyersville
| Educational Attainment | Married | Unmarried |
| Less than High School | 0 (0.0%) | 0 (0.0%) |
| High School Diploma | 0 (0.0%) | 0 (0.0%) |
| College or Associate's Degree | 0 (0.0%) | 0 (0.0%) |
| Bachelor's Degree | 0 (0.0%) | 0 (0.0%) |
| Graduate Degree | 0 (0.0%) | 0 (0.0%) |
| Total | 0 (0.0%) | 0 (0.0%) |
Employment Characteristics in Salyersville
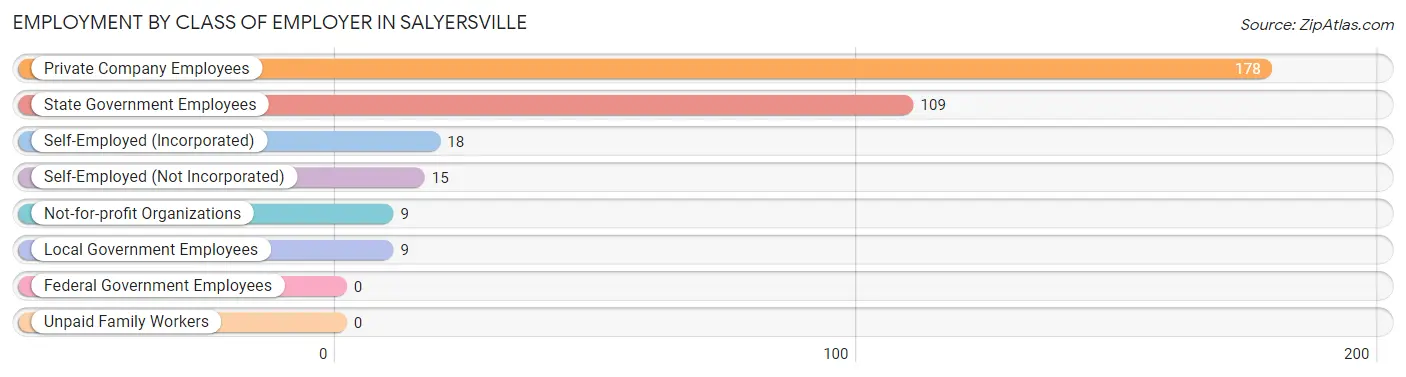
Employment by Class of Employer in Salyersville
Among the 338 employed individuals in Salyersville, private company employees (178 | 52.7%), state government employees (109 | 32.3%), and self-employed (incorporated) (18 | 5.3%) make up the most common classes of employment.
| Employer Class | # Employees | % Employees |
| Private Company Employees | 178 | 52.7% |
| Self-Employed (Incorporated) | 18 | 5.3% |
| Self-Employed (Not Incorporated) | 15 | 4.4% |
| Not-for-profit Organizations | 9 | 2.7% |
| Local Government Employees | 9 | 2.7% |
| State Government Employees | 109 | 32.3% |
| Federal Government Employees | 0 | 0.0% |
| Unpaid Family Workers | 0 | 0.0% |
| Total | 338 | 100.0% |
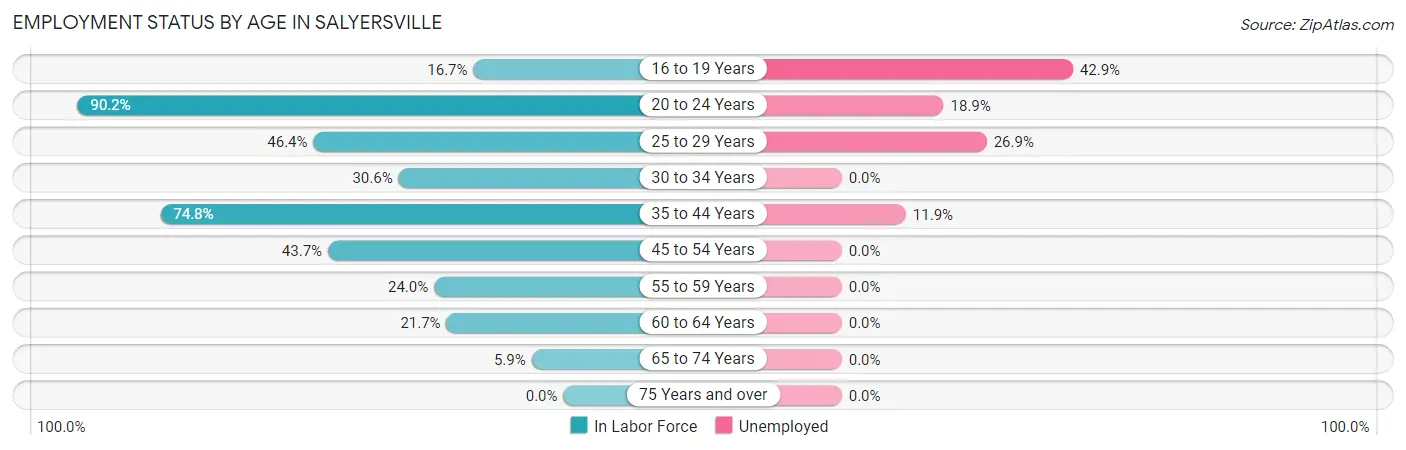
Employment Status by Age in Salyersville
According to the labor force statistics for Salyersville, out of the total population over 16 years of age (1,517), 28.6% or 434 individuals are in the labor force, with 8.1% or 35 of them unemployed. The age group with the highest labor force participation rate is 20 to 24 years, with 90.2% or 37 individuals in the labor force. Within the labor force, the 16 to 19 years age range has the highest percentage of unemployed individuals, with 42.9% or 9 of them being unemployed.
| Age Bracket | In Labor Force | Unemployed |
| 16 to 19 Years | 21 (16.7%) | 9 (42.9%) |
| 20 to 24 Years | 37 (90.2%) | 7 (18.9%) |
| 25 to 29 Years | 26 (46.4%) | 7 (26.9%) |
| 30 to 34 Years | 26 (30.6%) | 0 (0.0%) |
| 35 to 44 Years | 101 (74.8%) | 12 (11.9%) |
| 45 to 54 Years | 150 (43.7%) | 0 (0.0%) |
| 55 to 59 Years | 18 (24.0%) | 0 (0.0%) |
| 60 to 64 Years | 38 (21.7%) | 0 (0.0%) |
| 65 to 74 Years | 17 (5.9%) | 0 (0.0%) |
| 75 Years and over | 0 (0.0%) | 0 (0.0%) |
| Total | 434 (28.6%) | 35 (8.1%) |
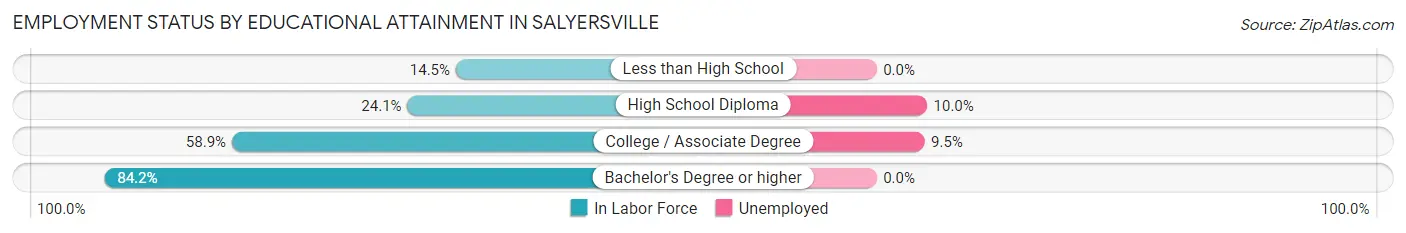
Employment Status by Educational Attainment in Salyersville
According to labor force statistics for Salyersville, 41.3% of individuals (359) out of the total population between 25 and 64 years of age (869) are in the labor force, with 5.3% or 19 of them being unemployed. The group with the highest labor force participation rate are those with the educational attainment of bachelor's degree or higher, with 84.2% or 133 individuals in the labor force. Within the labor force, individuals with high school diploma education have the highest percentage of unemployment, with 10.0% or 7 of them being unemployed.
| Educational Attainment | In Labor Force | Unemployed |
| Less than High School | 30 (14.5%) | 0 (0.0%) |
| High School Diploma | 70 (24.1%) | 29 (10.0%) |
| College / Associate Degree | 126 (58.9%) | 20 (9.5%) |
| Bachelor's Degree or higher | 133 (84.2%) | 0 (0.0%) |
| Total | 359 (41.3%) | 46 (5.3%) |
Employment Occupations by Sex in Salyersville
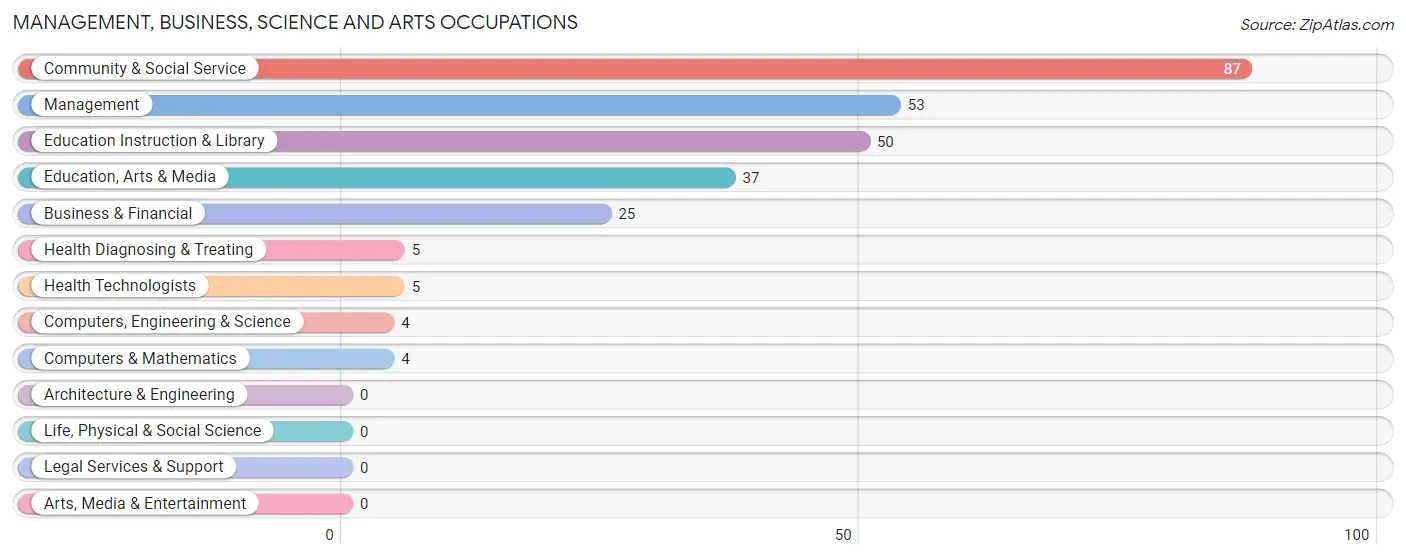
Management, Business, Science and Arts Occupations
The most common Management, Business, Science and Arts occupations in Salyersville are Community & Social Service (87 | 21.8%), Management (53 | 13.3%), Education Instruction & Library (50 | 12.5%), Education, Arts & Media (37 | 9.3%), and Business & Financial (25 | 6.3%).
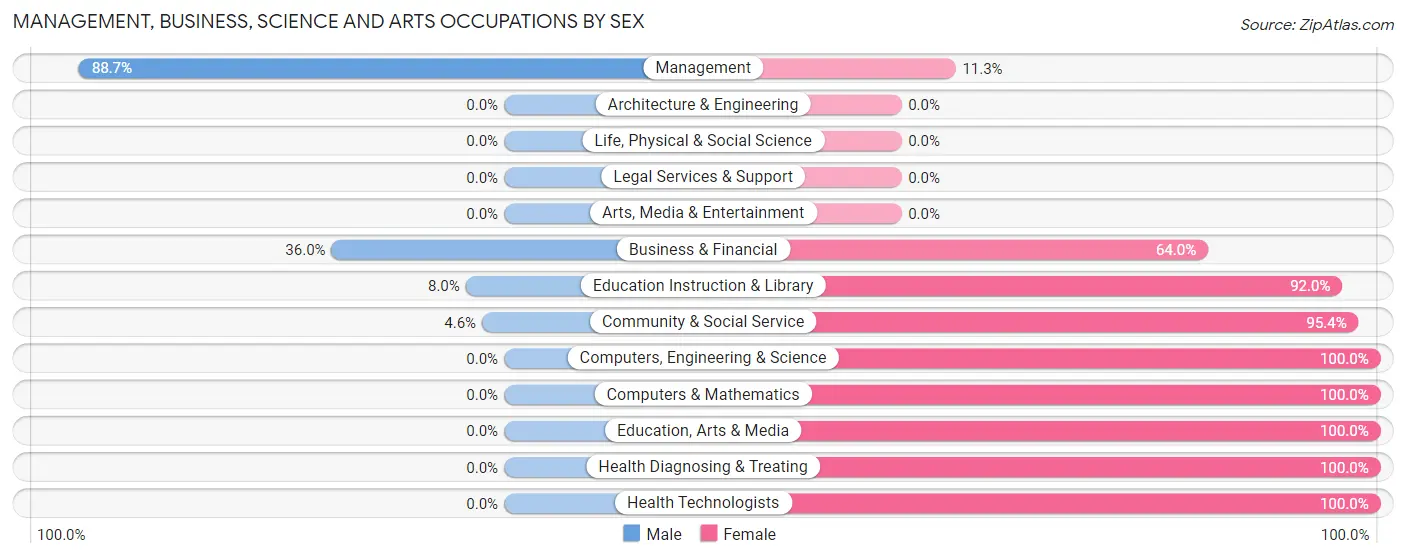
Management, Business, Science and Arts Occupations by Sex
Within the Management, Business, Science and Arts occupations in Salyersville, the most male-oriented occupations are Management (88.7%), Business & Financial (36.0%), and Education Instruction & Library (8.0%), while the most female-oriented occupations are Computers, Engineering & Science (100.0%), Computers & Mathematics (100.0%), and Education, Arts & Media (100.0%).
| Occupation | Male | Female |
| Management | 47 (88.7%) | 6 (11.3%) |
| Business & Financial | 9 (36.0%) | 16 (64.0%) |
| Computers, Engineering & Science | 0 (0.0%) | 4 (100.0%) |
| Computers & Mathematics | 0 (0.0%) | 4 (100.0%) |
| Architecture & Engineering | 0 (0.0%) | 0 (0.0%) |
| Life, Physical & Social Science | 0 (0.0%) | 0 (0.0%) |
| Community & Social Service | 4 (4.6%) | 83 (95.4%) |
| Education, Arts & Media | 0 (0.0%) | 37 (100.0%) |
| Legal Services & Support | 0 (0.0%) | 0 (0.0%) |
| Education Instruction & Library | 4 (8.0%) | 46 (92.0%) |
| Arts, Media & Entertainment | 0 (0.0%) | 0 (0.0%) |
| Health Diagnosing & Treating | 0 (0.0%) | 5 (100.0%) |
| Health Technologists | 0 (0.0%) | 5 (100.0%) |
| Total (Category) | 60 (34.5%) | 114 (65.5%) |
| Total (Overall) | 236 (59.2%) | 163 (40.8%) |
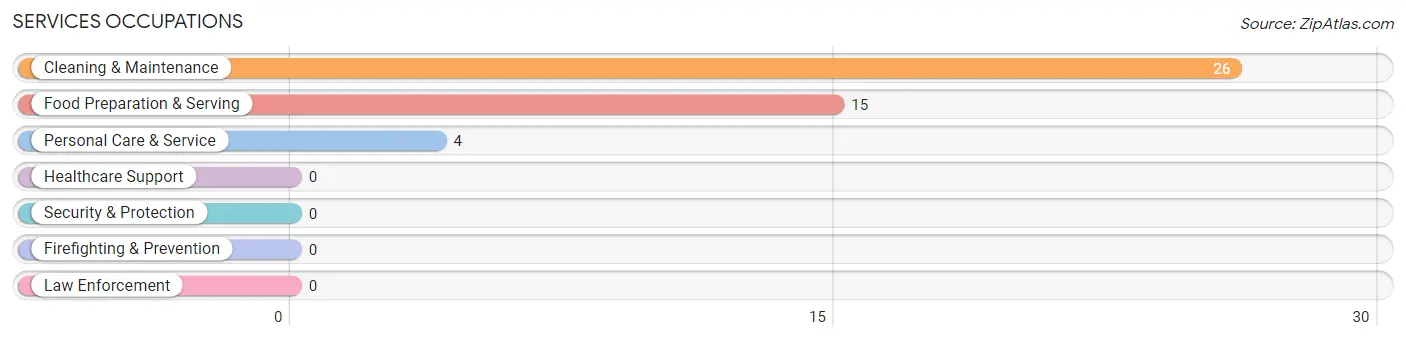
Services Occupations
The most common Services occupations in Salyersville are Cleaning & Maintenance (26 | 6.5%), Food Preparation & Serving (15 | 3.8%), and Personal Care & Service (4 | 1.0%).
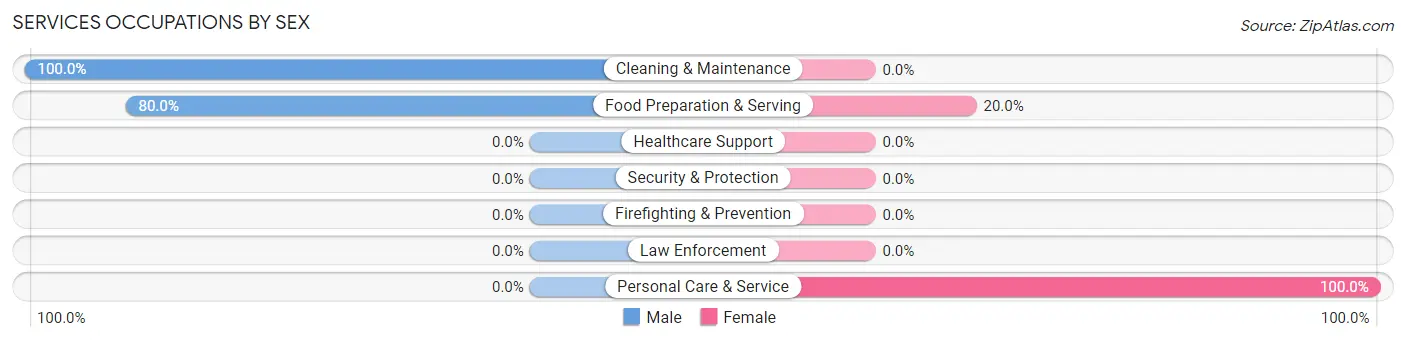
Services Occupations by Sex
Within the Services occupations in Salyersville, the most male-oriented occupations are Cleaning & Maintenance (100.0%), and Food Preparation & Serving (80.0%), while the most female-oriented occupations are Personal Care & Service (100.0%), and Food Preparation & Serving (20.0%).
| Occupation | Male | Female |
| Healthcare Support | 0 (0.0%) | 0 (0.0%) |
| Security & Protection | 0 (0.0%) | 0 (0.0%) |
| Firefighting & Prevention | 0 (0.0%) | 0 (0.0%) |
| Law Enforcement | 0 (0.0%) | 0 (0.0%) |
| Food Preparation & Serving | 12 (80.0%) | 3 (20.0%) |
| Cleaning & Maintenance | 26 (100.0%) | 0 (0.0%) |
| Personal Care & Service | 0 (0.0%) | 4 (100.0%) |
| Total (Category) | 38 (84.4%) | 7 (15.6%) |
| Total (Overall) | 236 (59.2%) | 163 (40.8%) |
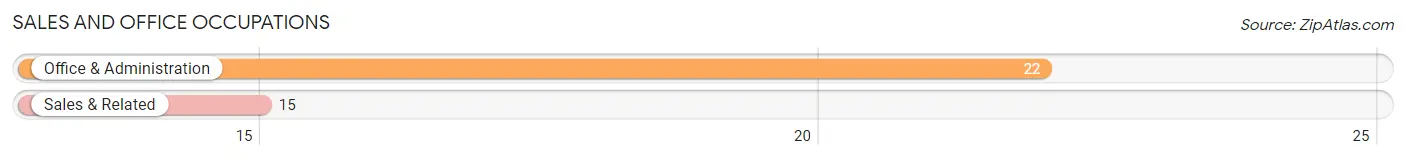
Sales and Office Occupations
The most common Sales and Office occupations in Salyersville are Office & Administration (22 | 5.5%), and Sales & Related (15 | 3.8%).
Sales and Office Occupations by Sex
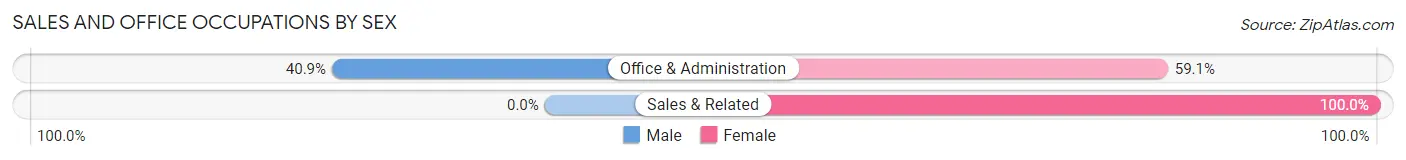
| Occupation | Male | Female |
| Sales & Related | 0 (0.0%) | 15 (100.0%) |
| Office & Administration | 9 (40.9%) | 13 (59.1%) |
| Total (Category) | 9 (24.3%) | 28 (75.7%) |
| Total (Overall) | 236 (59.2%) | 163 (40.8%) |
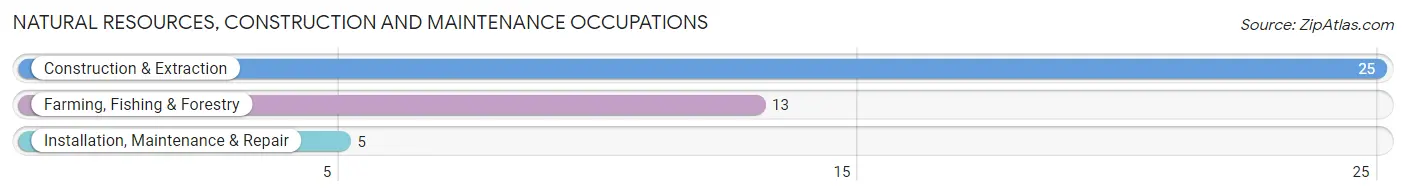
Natural Resources, Construction and Maintenance Occupations
The most common Natural Resources, Construction and Maintenance occupations in Salyersville are Construction & Extraction (25 | 6.3%), Farming, Fishing & Forestry (13 | 3.3%), and Installation, Maintenance & Repair (5 | 1.3%).
Natural Resources, Construction and Maintenance Occupations by Sex
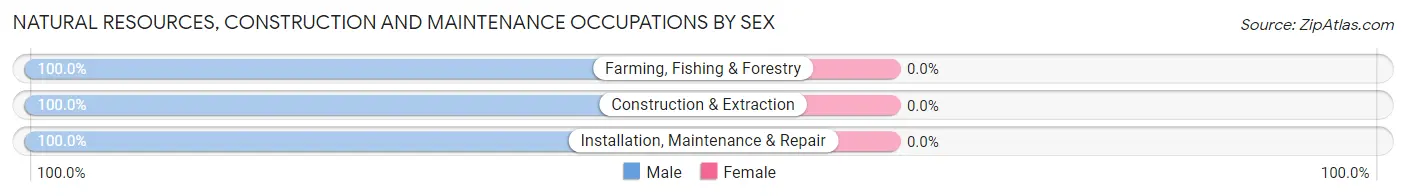
| Occupation | Male | Female |
| Farming, Fishing & Forestry | 13 (100.0%) | 0 (0.0%) |
| Construction & Extraction | 25 (100.0%) | 0 (0.0%) |
| Installation, Maintenance & Repair | 5 (100.0%) | 0 (0.0%) |
| Total (Category) | 43 (100.0%) | 0 (0.0%) |
| Total (Overall) | 236 (59.2%) | 163 (40.8%) |
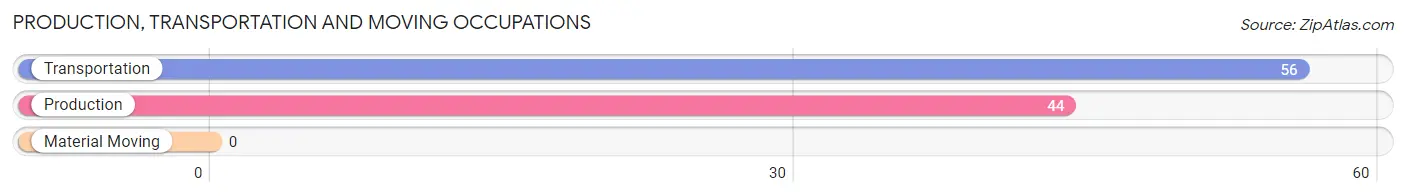
Production, Transportation and Moving Occupations
The most common Production, Transportation and Moving occupations in Salyersville are Transportation (56 | 14.0%), and Production (44 | 11.0%).
Production, Transportation and Moving Occupations by Sex
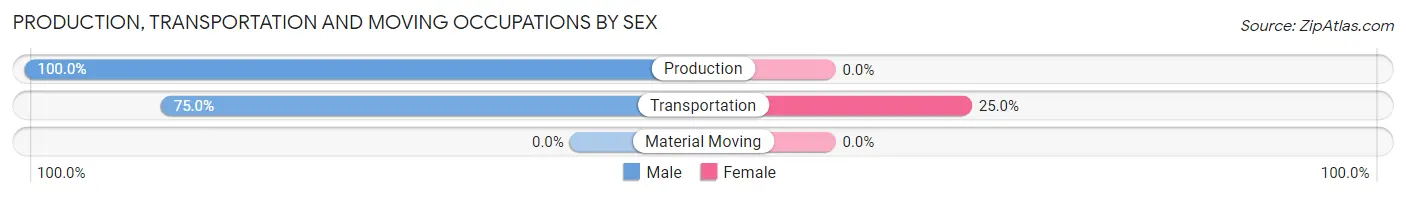
| Occupation | Male | Female |
| Production | 44 (100.0%) | 0 (0.0%) |
| Transportation | 42 (75.0%) | 14 (25.0%) |
| Material Moving | 0 (0.0%) | 0 (0.0%) |
| Total (Category) | 86 (86.0%) | 14 (14.0%) |
| Total (Overall) | 236 (59.2%) | 163 (40.8%) |
Employment Industries by Sex in Salyersville
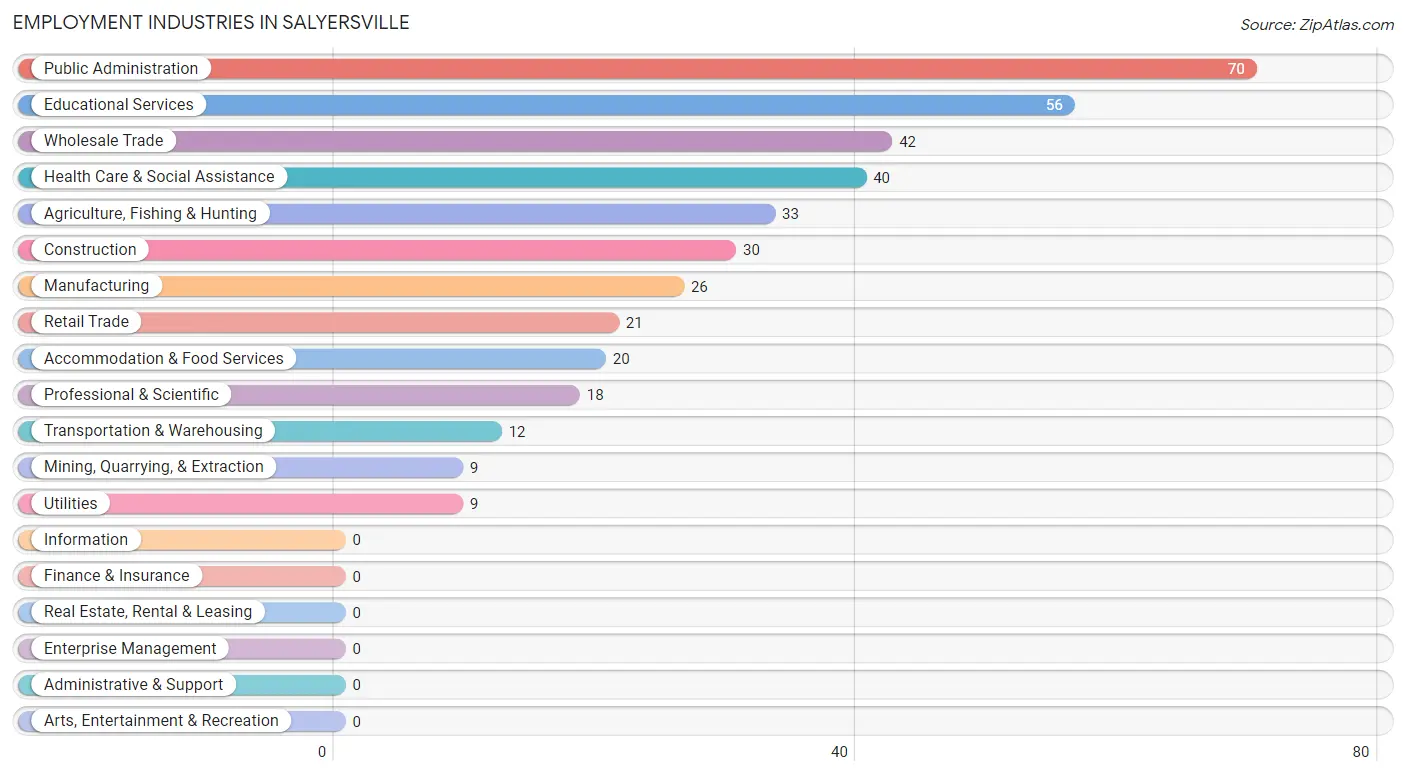
Employment Industries in Salyersville
The major employment industries in Salyersville include Public Administration (70 | 17.5%), Educational Services (56 | 14.0%), Wholesale Trade (42 | 10.5%), Health Care & Social Assistance (40 | 10.0%), and Agriculture, Fishing & Hunting (33 | 8.3%).
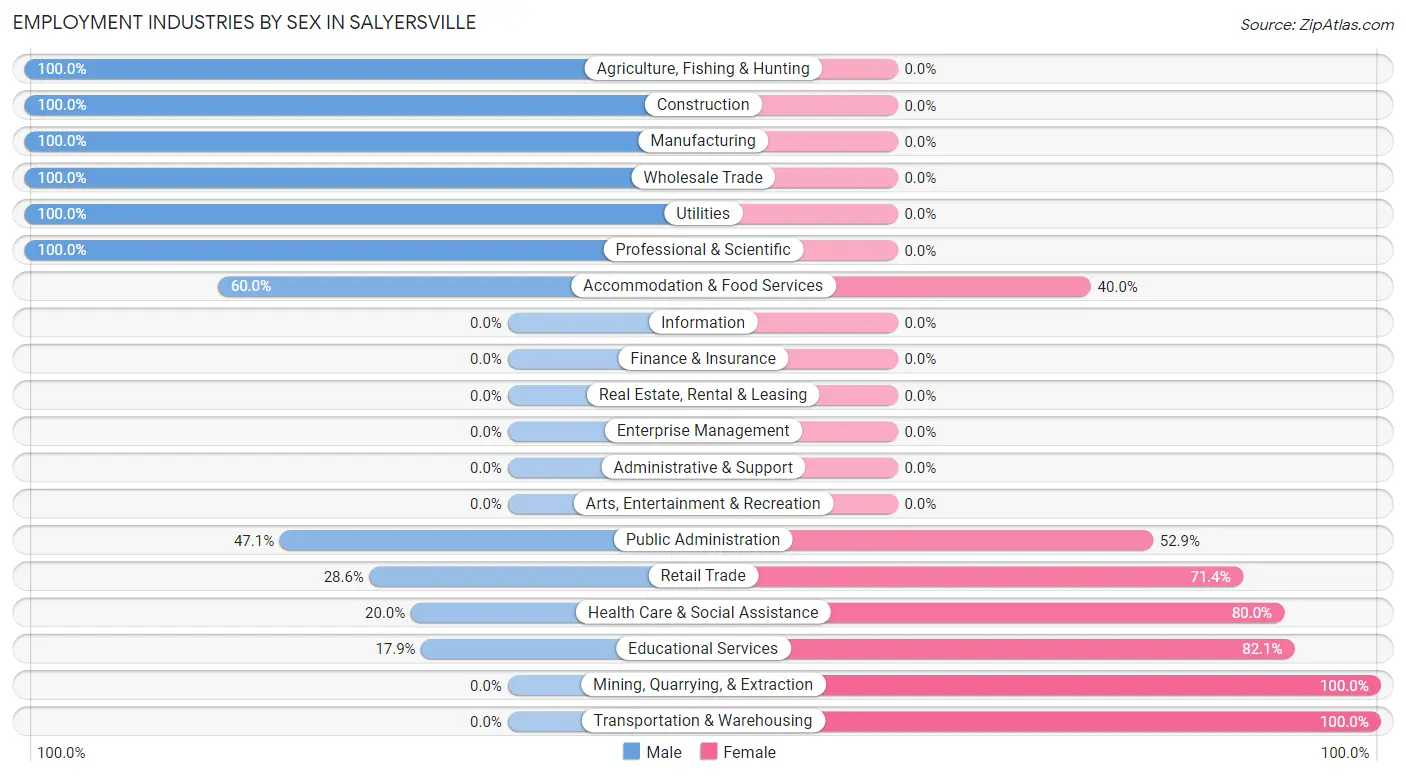
Employment Industries by Sex in Salyersville
The Salyersville industries that see more men than women are Agriculture, Fishing & Hunting (100.0%), Construction (100.0%), and Manufacturing (100.0%), whereas the industries that tend to have a higher number of women are Mining, Quarrying, & Extraction (100.0%), Transportation & Warehousing (100.0%), and Educational Services (82.1%).
| Industry | Male | Female |
| Agriculture, Fishing & Hunting | 33 (100.0%) | 0 (0.0%) |
| Mining, Quarrying, & Extraction | 0 (0.0%) | 9 (100.0%) |
| Construction | 30 (100.0%) | 0 (0.0%) |
| Manufacturing | 26 (100.0%) | 0 (0.0%) |
| Wholesale Trade | 42 (100.0%) | 0 (0.0%) |
| Retail Trade | 6 (28.6%) | 15 (71.4%) |
| Transportation & Warehousing | 0 (0.0%) | 12 (100.0%) |
| Utilities | 9 (100.0%) | 0 (0.0%) |
| Information | 0 (0.0%) | 0 (0.0%) |
| Finance & Insurance | 0 (0.0%) | 0 (0.0%) |
| Real Estate, Rental & Leasing | 0 (0.0%) | 0 (0.0%) |
| Professional & Scientific | 18 (100.0%) | 0 (0.0%) |
| Enterprise Management | 0 (0.0%) | 0 (0.0%) |
| Administrative & Support | 0 (0.0%) | 0 (0.0%) |
| Educational Services | 10 (17.9%) | 46 (82.1%) |
| Health Care & Social Assistance | 8 (20.0%) | 32 (80.0%) |
| Arts, Entertainment & Recreation | 0 (0.0%) | 0 (0.0%) |
| Accommodation & Food Services | 12 (60.0%) | 8 (40.0%) |
| Public Administration | 33 (47.1%) | 37 (52.9%) |
| Total | 236 (59.2%) | 163 (40.8%) |
Education in Salyersville
School Enrollment in Salyersville
The most common levels of schooling among the 394 students in Salyersville are high school (201 | 51.0%), elementary school (57 | 14.5%), and middle school (55 | 14.0%).
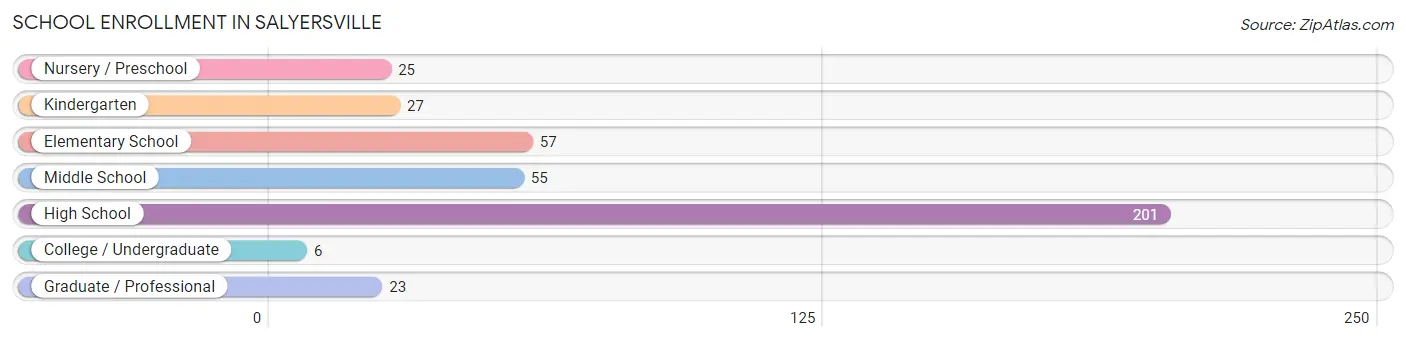
| School Level | # Students | % Students |
| Nursery / Preschool | 25 | 6.4% |
| Kindergarten | 27 | 6.9% |
| Elementary School | 57 | 14.5% |
| Middle School | 55 | 14.0% |
| High School | 201 | 51.0% |
| College / Undergraduate | 6 | 1.5% |
| Graduate / Professional | 23 | 5.8% |
| Total | 394 | 100.0% |
School Enrollment by Age by Funding Source in Salyersville
Out of a total of 394 students who are enrolled in schools in Salyersville, 23 (5.8%) attend a private institution, while the remaining 371 (94.2%) are enrolled in public schools. The age group of 35 years and over has the highest likelihood of being enrolled in private schools, with 23 (85.2% in the age bracket) enrolled. Conversely, the age group of 3 to 4 year olds has the lowest likelihood of being enrolled in a private school, with 25 (100.0% in the age bracket) attending a public institution.
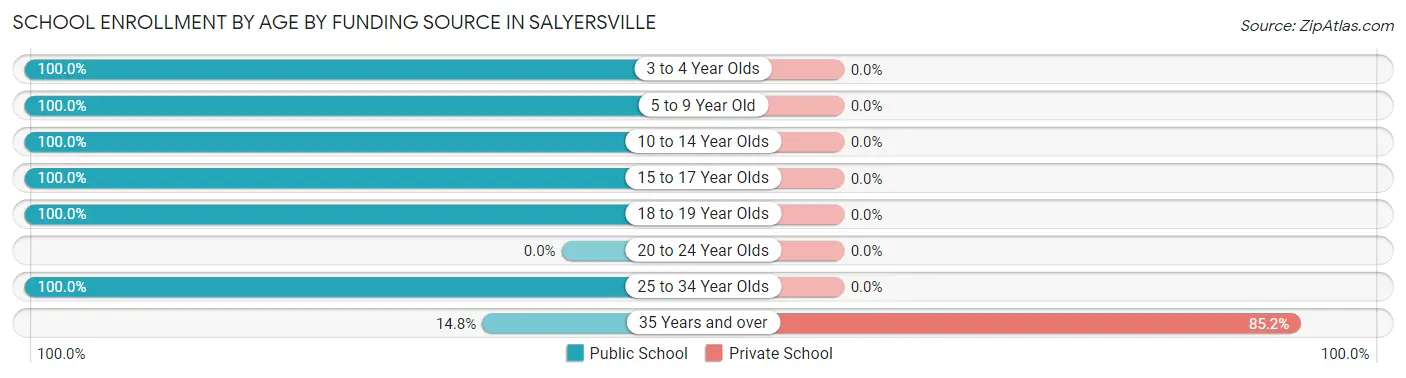
| Age Bracket | Public School | Private School |
| 3 to 4 Year Olds | 25 (100.0%) | 0 (0.0%) |
| 5 to 9 Year Old | 76 (100.0%) | 0 (0.0%) |
| 10 to 14 Year Olds | 73 (100.0%) | 0 (0.0%) |
| 15 to 17 Year Olds | 175 (100.0%) | 0 (0.0%) |
| 18 to 19 Year Olds | 16 (100.0%) | 0 (0.0%) |
| 20 to 24 Year Olds | 0 (0.0%) | 0 (0.0%) |
| 25 to 34 Year Olds | 2 (100.0%) | 0 (0.0%) |
| 35 Years and over | 4 (14.8%) | 23 (85.2%) |
| Total | 371 (94.2%) | 23 (5.8%) |
Educational Attainment by Field of Study in Salyersville
Science & technology (64 | 31.5%), bio, nature & agricultural (40 | 19.7%), education (34 | 16.8%), psychology (17 | 8.4%), and communications (14 | 6.9%) are the most common fields of study among 203 individuals in Salyersville who have obtained a bachelor's degree or higher.
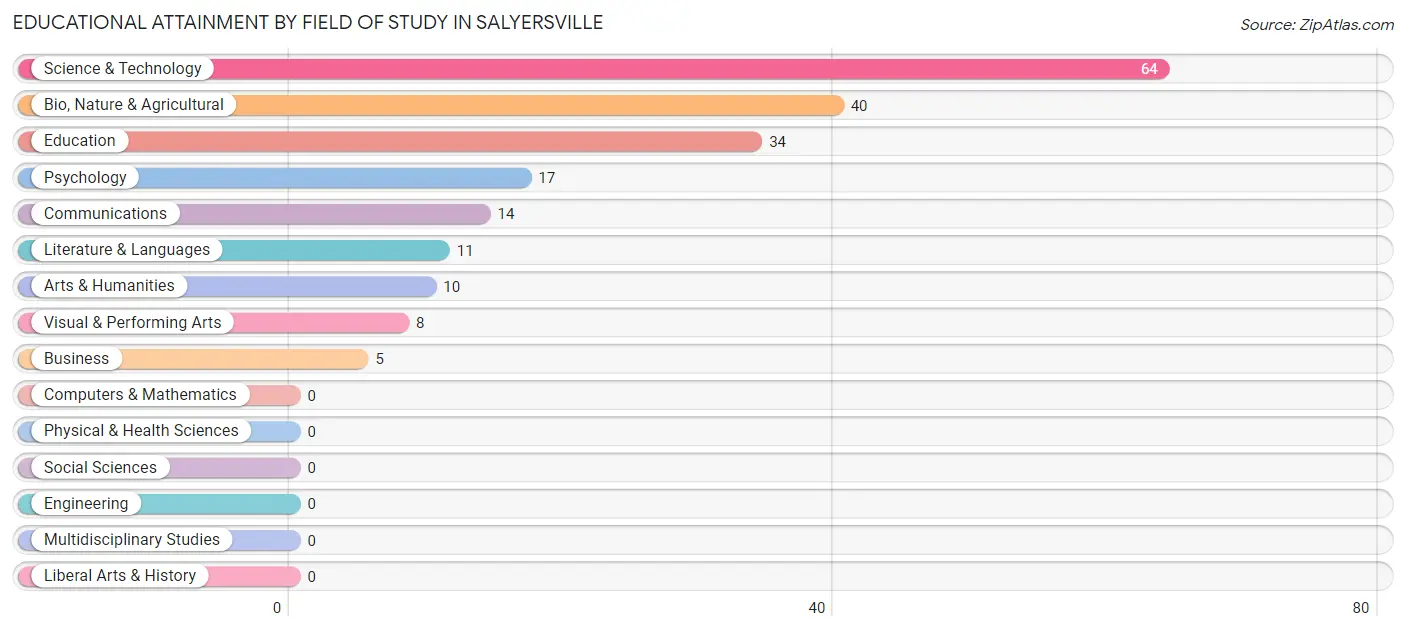
| Field of Study | # Graduates | % Graduates |
| Computers & Mathematics | 0 | 0.0% |
| Bio, Nature & Agricultural | 40 | 19.7% |
| Physical & Health Sciences | 0 | 0.0% |
| Psychology | 17 | 8.4% |
| Social Sciences | 0 | 0.0% |
| Engineering | 0 | 0.0% |
| Multidisciplinary Studies | 0 | 0.0% |
| Science & Technology | 64 | 31.5% |
| Business | 5 | 2.5% |
| Education | 34 | 16.8% |
| Literature & Languages | 11 | 5.4% |
| Liberal Arts & History | 0 | 0.0% |
| Visual & Performing Arts | 8 | 3.9% |
| Communications | 14 | 6.9% |
| Arts & Humanities | 10 | 4.9% |
| Total | 203 | 100.0% |
Transportation & Commute in Salyersville
Vehicle Availability by Sex in Salyersville
The most prevalent vehicle ownership categories in Salyersville are males with 2 vehicles (81, accounting for 42.2%) and females with 2 vehicles (58, making up 55.5%).
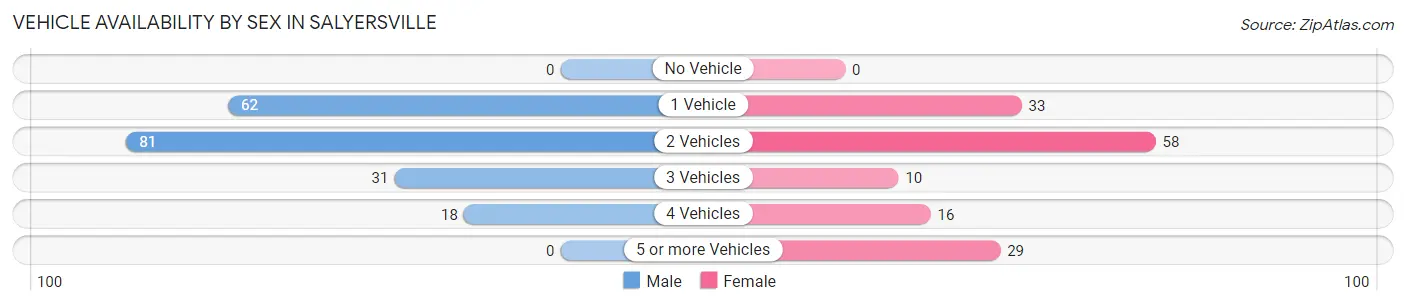
| Vehicles Available | Male | Female |
| No Vehicle | 0 (0.0%) | 0 (0.0%) |
| 1 Vehicle | 62 (32.3%) | 33 (22.6%) |
| 2 Vehicles | 81 (42.2%) | 58 (39.7%) |
| 3 Vehicles | 31 (16.2%) | 10 (6.9%) |
| 4 Vehicles | 18 (9.4%) | 16 (11.0%) |
| 5 or more Vehicles | 0 (0.0%) | 29 (19.9%) |
| Total | 192 (100.0%) | 146 (100.0%) |
Commute Time in Salyersville
The most frequently occuring commute durations in Salyersville are 5 to 9 minutes (98 commuters, 30.9%), 90 or more minutes (63 commuters, 19.9%), and less than 5 minutes (49 commuters, 15.5%).
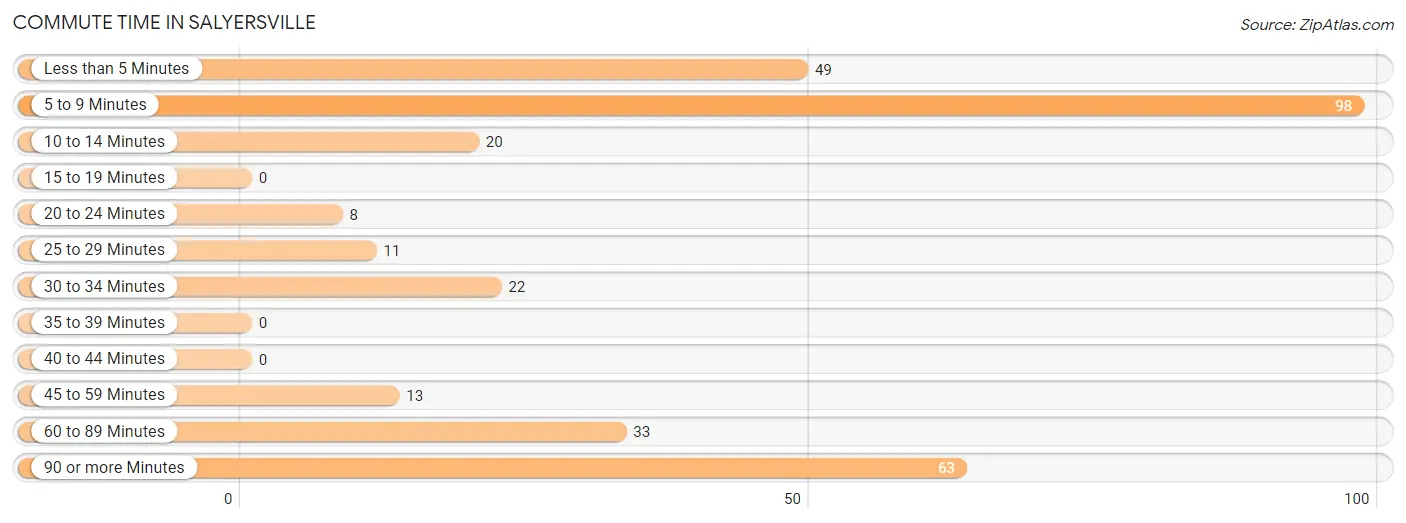
| Commute Time | # Commuters | % Commuters |
| Less than 5 Minutes | 49 | 15.5% |
| 5 to 9 Minutes | 98 | 30.9% |
| 10 to 14 Minutes | 20 | 6.3% |
| 15 to 19 Minutes | 0 | 0.0% |
| 20 to 24 Minutes | 8 | 2.5% |
| 25 to 29 Minutes | 11 | 3.5% |
| 30 to 34 Minutes | 22 | 6.9% |
| 35 to 39 Minutes | 0 | 0.0% |
| 40 to 44 Minutes | 0 | 0.0% |
| 45 to 59 Minutes | 13 | 4.1% |
| 60 to 89 Minutes | 33 | 10.4% |
| 90 or more Minutes | 63 | 19.9% |
Commute Time by Sex in Salyersville
The most common commute times in Salyersville are 90 or more minutes (56 commuters, 29.2%) for males and 5 to 9 minutes (58 commuters, 46.4%) for females.
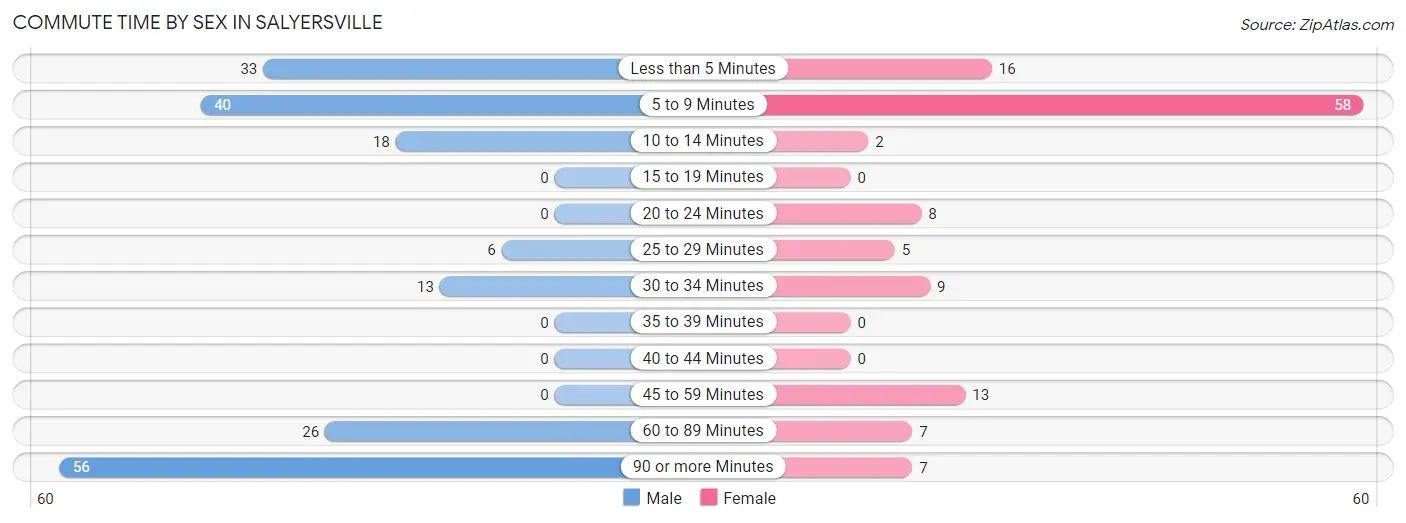
| Commute Time | Male | Female |
| Less than 5 Minutes | 33 (17.2%) | 16 (12.8%) |
| 5 to 9 Minutes | 40 (20.8%) | 58 (46.4%) |
| 10 to 14 Minutes | 18 (9.4%) | 2 (1.6%) |
| 15 to 19 Minutes | 0 (0.0%) | 0 (0.0%) |
| 20 to 24 Minutes | 0 (0.0%) | 8 (6.4%) |
| 25 to 29 Minutes | 6 (3.1%) | 5 (4.0%) |
| 30 to 34 Minutes | 13 (6.8%) | 9 (7.2%) |
| 35 to 39 Minutes | 0 (0.0%) | 0 (0.0%) |
| 40 to 44 Minutes | 0 (0.0%) | 0 (0.0%) |
| 45 to 59 Minutes | 0 (0.0%) | 13 (10.4%) |
| 60 to 89 Minutes | 26 (13.5%) | 7 (5.6%) |
| 90 or more Minutes | 56 (29.2%) | 7 (5.6%) |
Time of Departure to Work by Sex in Salyersville
The most frequent times of departure to work in Salyersville are 7:00 AM to 7:29 AM (49, 25.5%) for males and 7:00 AM to 7:29 AM (42, 33.6%) for females.
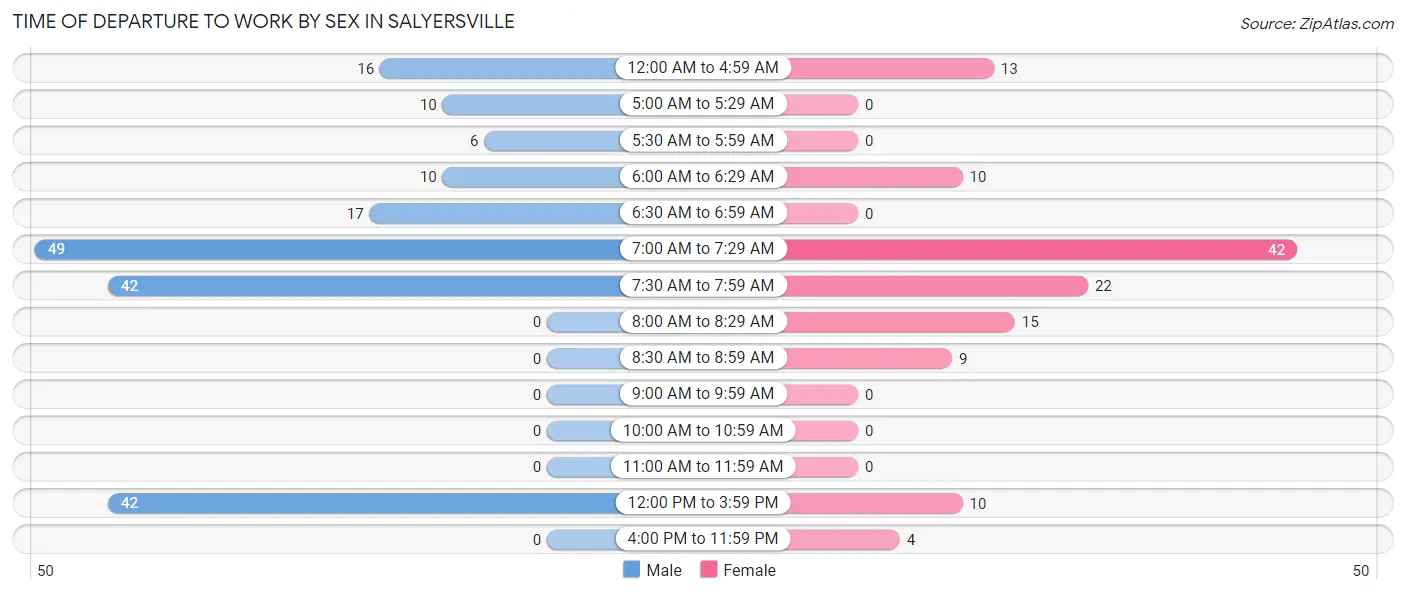
| Time of Departure | Male | Female |
| 12:00 AM to 4:59 AM | 16 (8.3%) | 13 (10.4%) |
| 5:00 AM to 5:29 AM | 10 (5.2%) | 0 (0.0%) |
| 5:30 AM to 5:59 AM | 6 (3.1%) | 0 (0.0%) |
| 6:00 AM to 6:29 AM | 10 (5.2%) | 10 (8.0%) |
| 6:30 AM to 6:59 AM | 17 (8.8%) | 0 (0.0%) |
| 7:00 AM to 7:29 AM | 49 (25.5%) | 42 (33.6%) |
| 7:30 AM to 7:59 AM | 42 (21.9%) | 22 (17.6%) |
| 8:00 AM to 8:29 AM | 0 (0.0%) | 15 (12.0%) |
| 8:30 AM to 8:59 AM | 0 (0.0%) | 9 (7.2%) |
| 9:00 AM to 9:59 AM | 0 (0.0%) | 0 (0.0%) |
| 10:00 AM to 10:59 AM | 0 (0.0%) | 0 (0.0%) |
| 11:00 AM to 11:59 AM | 0 (0.0%) | 0 (0.0%) |
| 12:00 PM to 3:59 PM | 42 (21.9%) | 10 (8.0%) |
| 4:00 PM to 11:59 PM | 0 (0.0%) | 4 (3.2%) |
| Total | 192 (100.0%) | 125 (100.0%) |
Housing Occupancy in Salyersville
Occupancy by Ownership in Salyersville
Of the total 759 dwellings in Salyersville, owner-occupied units account for 416 (54.8%), while renter-occupied units make up 343 (45.2%).
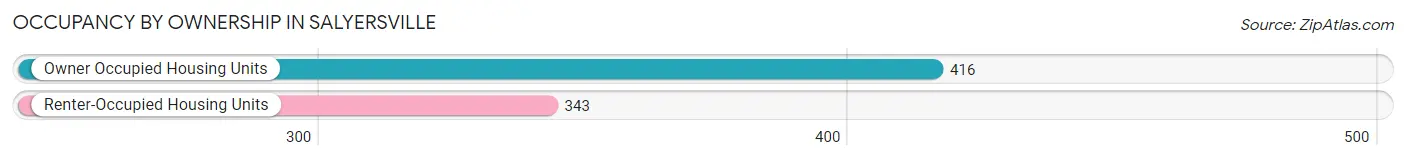
| Occupancy | # Housing Units | % Housing Units |
| Owner Occupied Housing Units | 416 | 54.8% |
| Renter-Occupied Housing Units | 343 | 45.2% |
| Total Occupied Housing Units | 759 | 100.0% |
Occupancy by Household Size in Salyersville
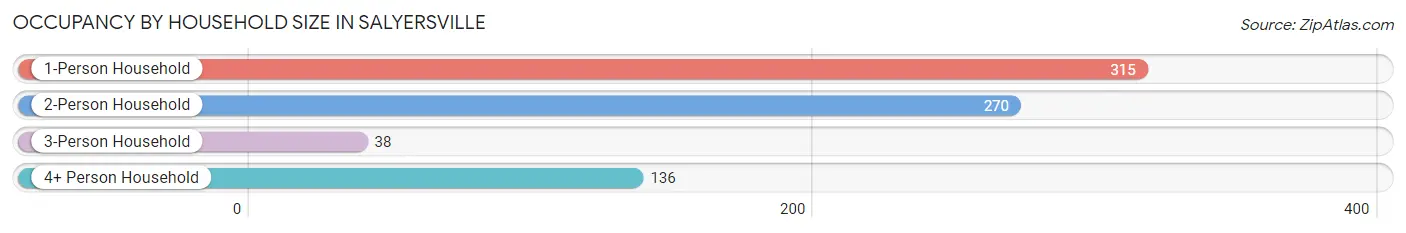
| Household Size | # Housing Units | % Housing Units |
| 1-Person Household | 315 | 41.5% |
| 2-Person Household | 270 | 35.6% |
| 3-Person Household | 38 | 5.0% |
| 4+ Person Household | 136 | 17.9% |
| Total Housing Units | 759 | 100.0% |
Occupancy by Ownership by Household Size in Salyersville
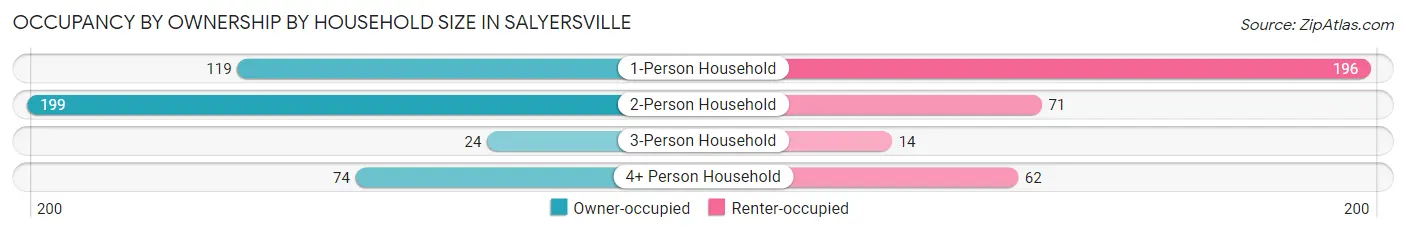
| Household Size | Owner-occupied | Renter-occupied |
| 1-Person Household | 119 (37.8%) | 196 (62.2%) |
| 2-Person Household | 199 (73.7%) | 71 (26.3%) |
| 3-Person Household | 24 (63.2%) | 14 (36.8%) |
| 4+ Person Household | 74 (54.4%) | 62 (45.6%) |
| Total Housing Units | 416 (54.8%) | 343 (45.2%) |
Occupancy by Educational Attainment in Salyersville
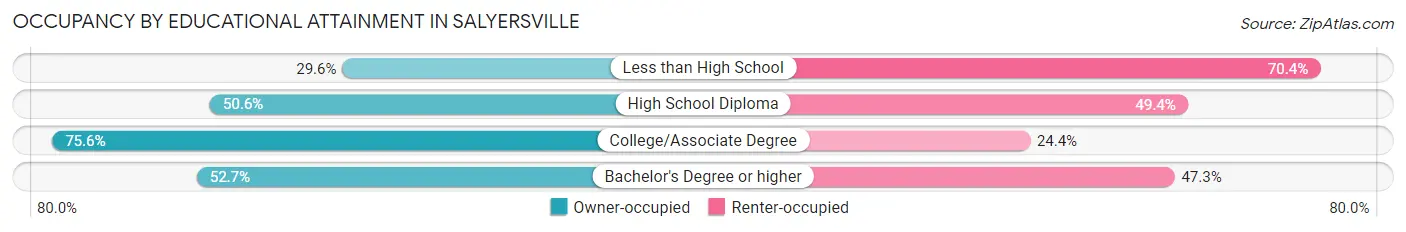
| Household Size | Owner-occupied | Renter-occupied |
| Less than High School | 45 (29.6%) | 107 (70.4%) |
| High School Diploma | 126 (50.6%) | 123 (49.4%) |
| College/Associate Degree | 186 (75.6%) | 60 (24.4%) |
| Bachelor's Degree or higher | 59 (52.7%) | 53 (47.3%) |
Occupancy by Age of Householder in Salyersville
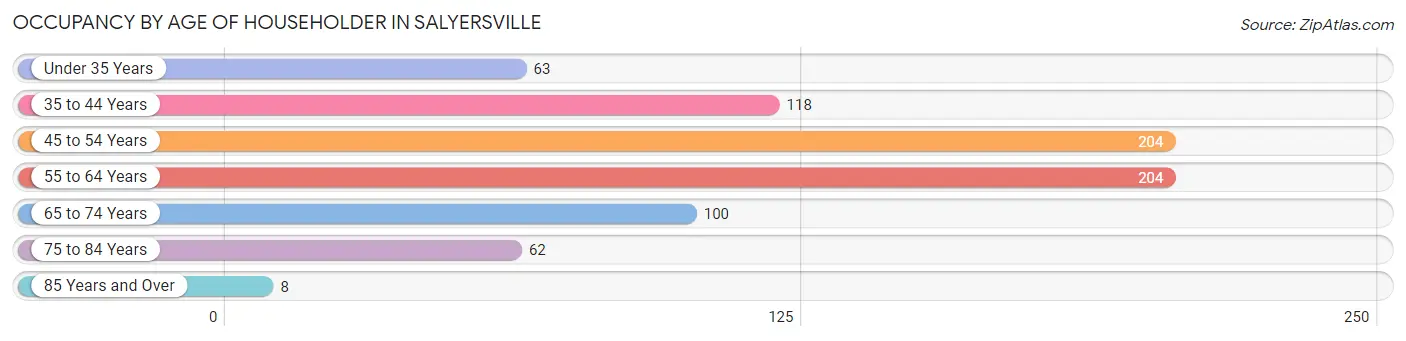
| Age Bracket | # Households | % Households |
| Under 35 Years | 63 | 8.3% |
| 35 to 44 Years | 118 | 15.5% |
| 45 to 54 Years | 204 | 26.9% |
| 55 to 64 Years | 204 | 26.9% |
| 65 to 74 Years | 100 | 13.2% |
| 75 to 84 Years | 62 | 8.2% |
| 85 Years and Over | 8 | 1.1% |
| Total | 759 | 100.0% |
Housing Finances in Salyersville
Median Income by Occupancy in Salyersville
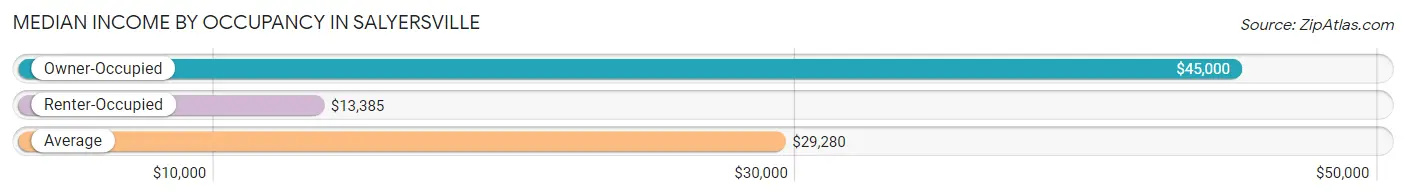
| Occupancy Type | # Households | Median Income |
| Owner-Occupied | 416 (54.8%) | $45,000 |
| Renter-Occupied | 343 (45.2%) | $13,385 |
| Average | 759 (100.0%) | $29,280 |
Occupancy by Householder Income Bracket in Salyersville
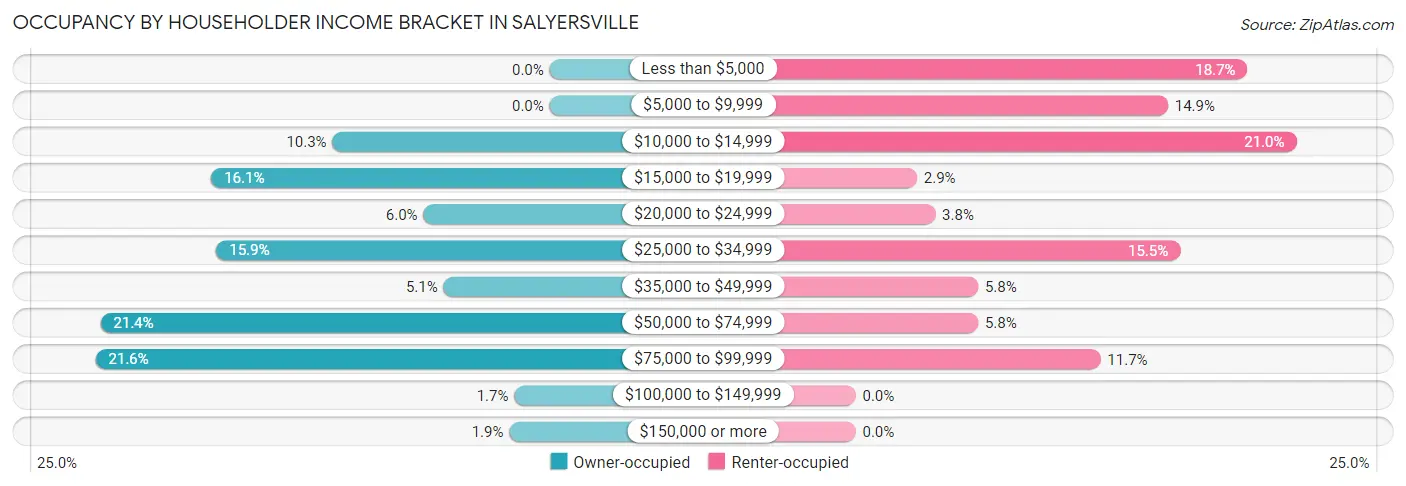
| Income Bracket | Owner-occupied | Renter-occupied |
| Less than $5,000 | 0 (0.0%) | 64 (18.7%) |
| $5,000 to $9,999 | 0 (0.0%) | 51 (14.9%) |
| $10,000 to $14,999 | 43 (10.3%) | 72 (21.0%) |
| $15,000 to $19,999 | 67 (16.1%) | 10 (2.9%) |
| $20,000 to $24,999 | 25 (6.0%) | 13 (3.8%) |
| $25,000 to $34,999 | 66 (15.9%) | 53 (15.4%) |
| $35,000 to $49,999 | 21 (5.1%) | 20 (5.8%) |
| $50,000 to $74,999 | 89 (21.4%) | 20 (5.8%) |
| $75,000 to $99,999 | 90 (21.6%) | 40 (11.7%) |
| $100,000 to $149,999 | 7 (1.7%) | 0 (0.0%) |
| $150,000 or more | 8 (1.9%) | 0 (0.0%) |
| Total | 416 (100.0%) | 343 (100.0%) |
Monthly Housing Cost Tiers in Salyersville
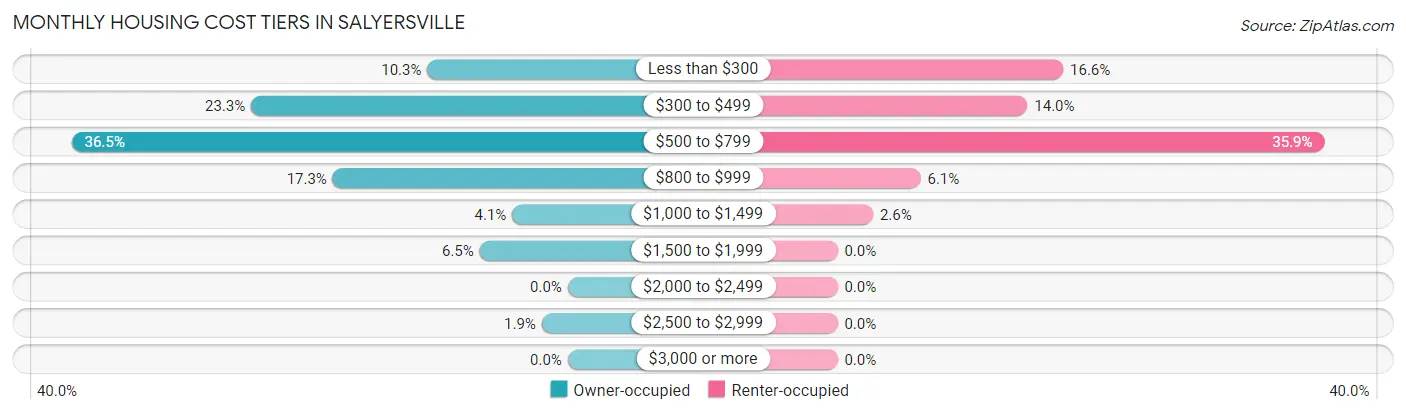
| Monthly Cost | Owner-occupied | Renter-occupied |
| Less than $300 | 43 (10.3%) | 57 (16.6%) |
| $300 to $499 | 97 (23.3%) | 48 (14.0%) |
| $500 to $799 | 152 (36.5%) | 123 (35.9%) |
| $800 to $999 | 72 (17.3%) | 21 (6.1%) |
| $1,000 to $1,499 | 17 (4.1%) | 9 (2.6%) |
| $1,500 to $1,999 | 27 (6.5%) | 0 (0.0%) |
| $2,000 to $2,499 | 0 (0.0%) | 0 (0.0%) |
| $2,500 to $2,999 | 8 (1.9%) | 0 (0.0%) |
| $3,000 or more | 0 (0.0%) | 0 (0.0%) |
| Total | 416 (100.0%) | 343 (100.0%) |
Physical Housing Characteristics in Salyersville
Housing Structures in Salyersville
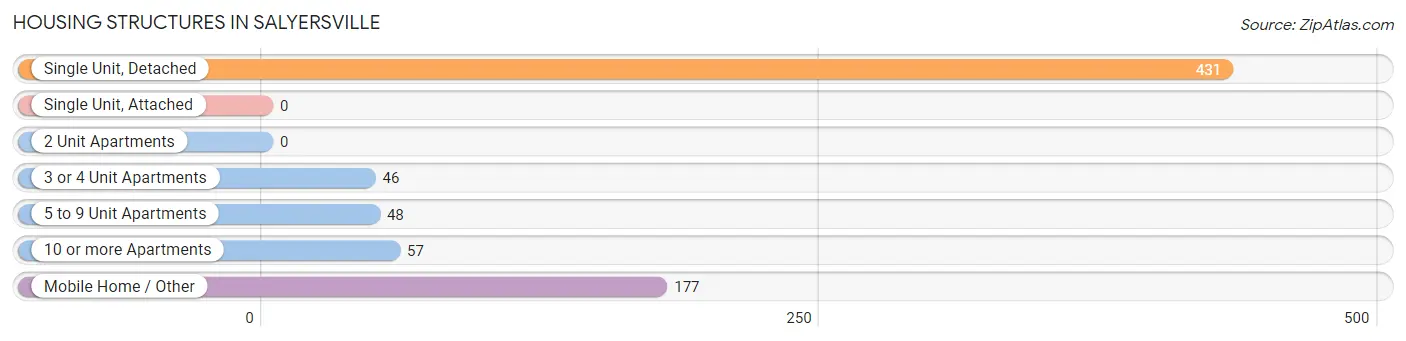
| Structure Type | # Housing Units | % Housing Units |
| Single Unit, Detached | 431 | 56.8% |
| Single Unit, Attached | 0 | 0.0% |
| 2 Unit Apartments | 0 | 0.0% |
| 3 or 4 Unit Apartments | 46 | 6.1% |
| 5 to 9 Unit Apartments | 48 | 6.3% |
| 10 or more Apartments | 57 | 7.5% |
| Mobile Home / Other | 177 | 23.3% |
| Total | 759 | 100.0% |
Housing Structures by Occupancy in Salyersville
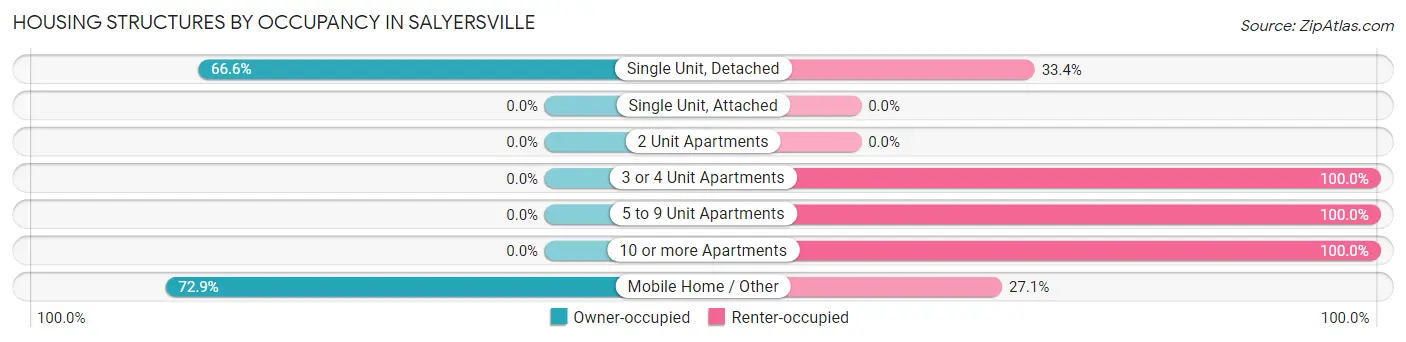
| Structure Type | Owner-occupied | Renter-occupied |
| Single Unit, Detached | 287 (66.6%) | 144 (33.4%) |
| Single Unit, Attached | 0 (0.0%) | 0 (0.0%) |
| 2 Unit Apartments | 0 (0.0%) | 0 (0.0%) |
| 3 or 4 Unit Apartments | 0 (0.0%) | 46 (100.0%) |
| 5 to 9 Unit Apartments | 0 (0.0%) | 48 (100.0%) |
| 10 or more Apartments | 0 (0.0%) | 57 (100.0%) |
| Mobile Home / Other | 129 (72.9%) | 48 (27.1%) |
| Total | 416 (54.8%) | 343 (45.2%) |
Housing Structures by Number of Rooms in Salyersville
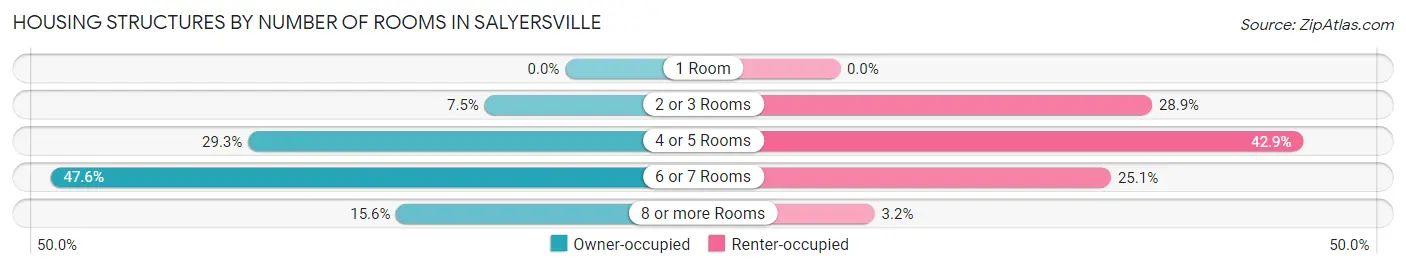
| Number of Rooms | Owner-occupied | Renter-occupied |
| 1 Room | 0 (0.0%) | 0 (0.0%) |
| 2 or 3 Rooms | 31 (7.4%) | 99 (28.9%) |
| 4 or 5 Rooms | 122 (29.3%) | 147 (42.9%) |
| 6 or 7 Rooms | 198 (47.6%) | 86 (25.1%) |
| 8 or more Rooms | 65 (15.6%) | 11 (3.2%) |
| Total | 416 (100.0%) | 343 (100.0%) |
Housing Structure by Heating Type in Salyersville
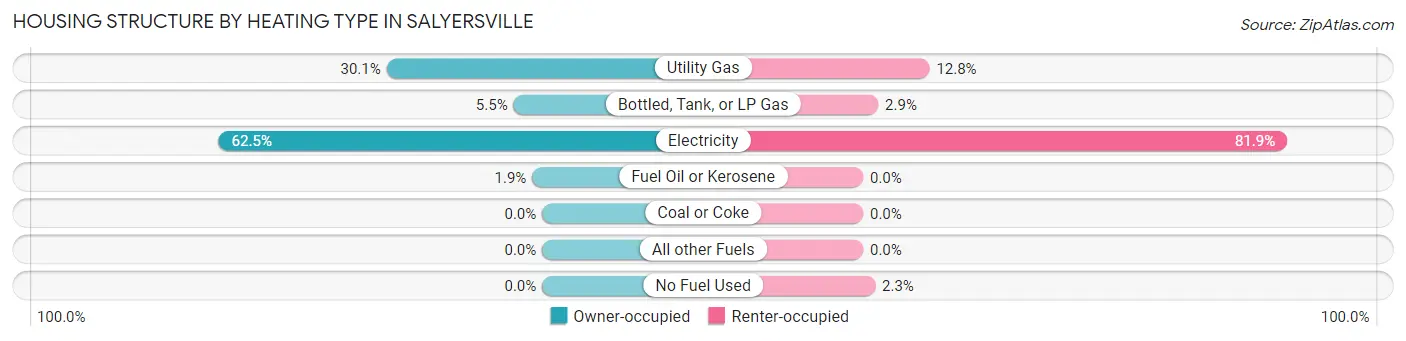
| Heating Type | Owner-occupied | Renter-occupied |
| Utility Gas | 125 (30.0%) | 44 (12.8%) |
| Bottled, Tank, or LP Gas | 23 (5.5%) | 10 (2.9%) |
| Electricity | 260 (62.5%) | 281 (81.9%) |
| Fuel Oil or Kerosene | 8 (1.9%) | 0 (0.0%) |
| Coal or Coke | 0 (0.0%) | 0 (0.0%) |
| All other Fuels | 0 (0.0%) | 0 (0.0%) |
| No Fuel Used | 0 (0.0%) | 8 (2.3%) |
| Total | 416 (100.0%) | 343 (100.0%) |
Household Vehicle Usage in Salyersville
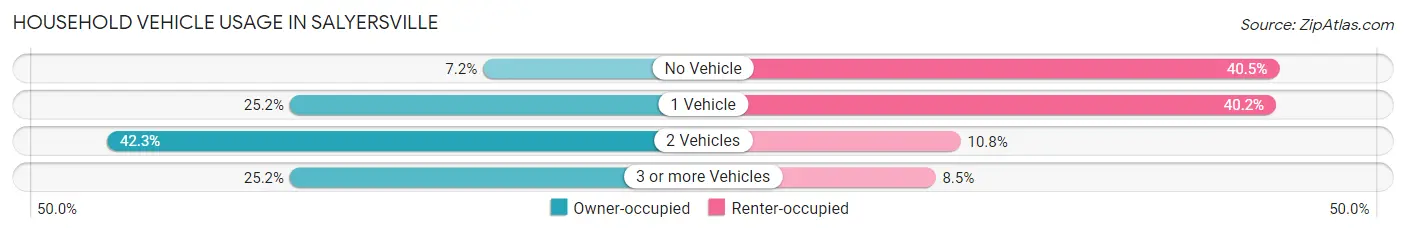
| Vehicles per Household | Owner-occupied | Renter-occupied |
| No Vehicle | 30 (7.2%) | 139 (40.5%) |
| 1 Vehicle | 105 (25.2%) | 138 (40.2%) |
| 2 Vehicles | 176 (42.3%) | 37 (10.8%) |
| 3 or more Vehicles | 105 (25.2%) | 29 (8.5%) |
| Total | 416 (100.0%) | 343 (100.0%) |
Real Estate & Mortgages in Salyersville
Real Estate and Mortgage Overview in Salyersville
| Characteristic | Without Mortgage | With Mortgage |
| Housing Units | 308 | 108 |
| Median Property Value | $90,600 | $169,400 |
| Median Household Income | $33,378 | $8 |
| Monthly Housing Costs | $539 | $0 |
| Real Estate Taxes | $1,063 | $0 |
Property Value by Mortgage Status in Salyersville
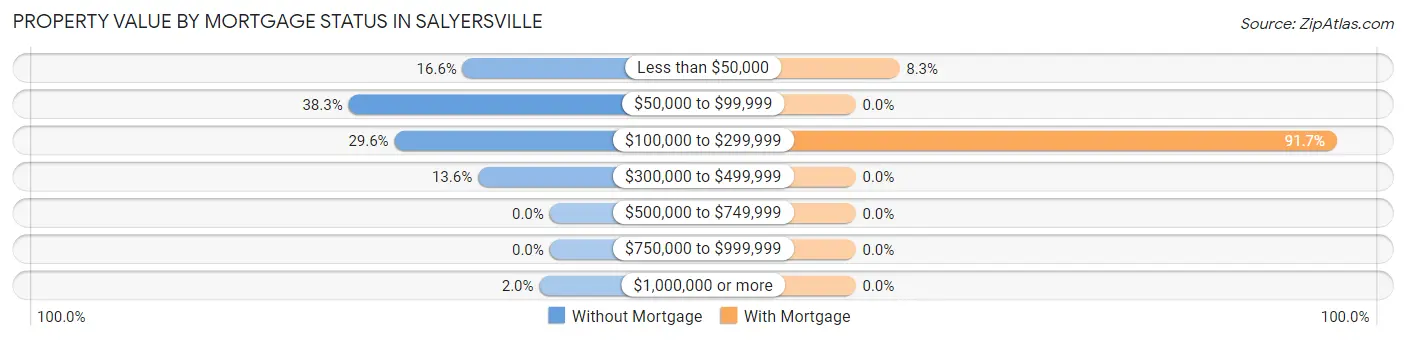
| Property Value | Without Mortgage | With Mortgage |
| Less than $50,000 | 51 (16.6%) | 9 (8.3%) |
| $50,000 to $99,999 | 118 (38.3%) | 0 (0.0%) |
| $100,000 to $299,999 | 91 (29.5%) | 99 (91.7%) |
| $300,000 to $499,999 | 42 (13.6%) | 0 (0.0%) |
| $500,000 to $749,999 | 0 (0.0%) | 0 (0.0%) |
| $750,000 to $999,999 | 0 (0.0%) | 0 (0.0%) |
| $1,000,000 or more | 6 (1.9%) | 0 (0.0%) |
| Total | 308 (100.0%) | 108 (100.0%) |
Household Income by Mortgage Status in Salyersville
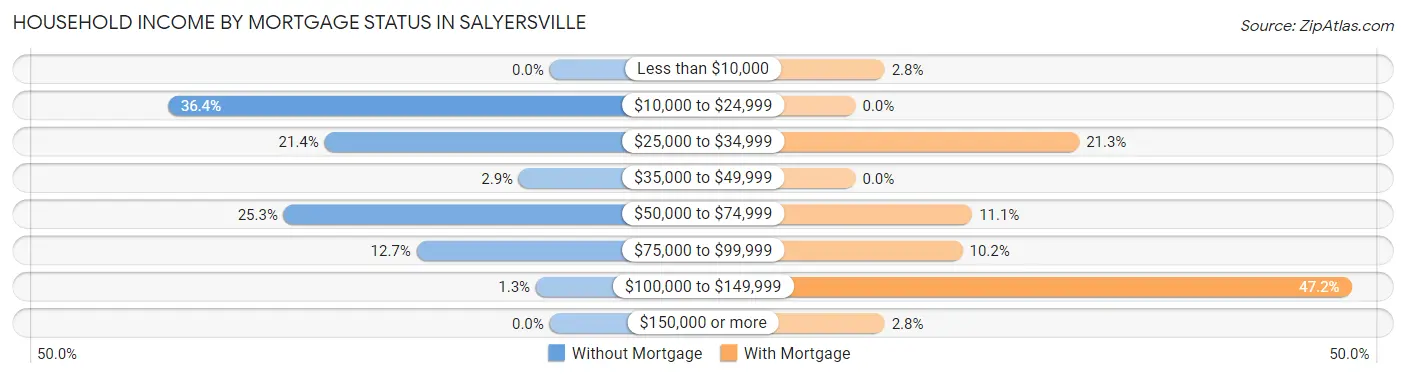
| Household Income | Without Mortgage | With Mortgage |
| Less than $10,000 | 0 (0.0%) | 3 (2.8%) |
| $10,000 to $24,999 | 112 (36.4%) | 0 (0.0%) |
| $25,000 to $34,999 | 66 (21.4%) | 23 (21.3%) |
| $35,000 to $49,999 | 9 (2.9%) | 0 (0.0%) |
| $50,000 to $74,999 | 78 (25.3%) | 12 (11.1%) |
| $75,000 to $99,999 | 39 (12.7%) | 11 (10.2%) |
| $100,000 to $149,999 | 4 (1.3%) | 51 (47.2%) |
| $150,000 or more | 0 (0.0%) | 3 (2.8%) |
| Total | 308 (100.0%) | 108 (100.0%) |
Property Value to Household Income Ratio in Salyersville
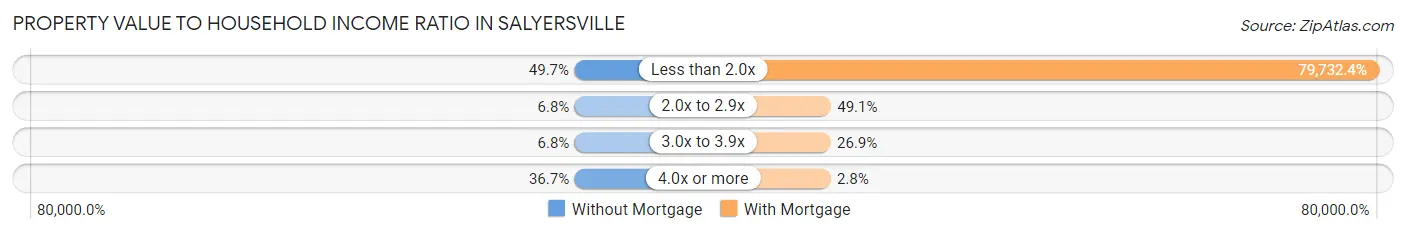
| Value-to-Income Ratio | Without Mortgage | With Mortgage |
| Less than 2.0x | 153 (49.7%) | 86,111 (79,732.4%) |
| 2.0x to 2.9x | 21 (6.8%) | 53 (49.1%) |
| 3.0x to 3.9x | 21 (6.8%) | 29 (26.9%) |
| 4.0x or more | 113 (36.7%) | 3 (2.8%) |
| Total | 308 (100.0%) | 108 (100.0%) |
Real Estate Taxes by Mortgage Status in Salyersville
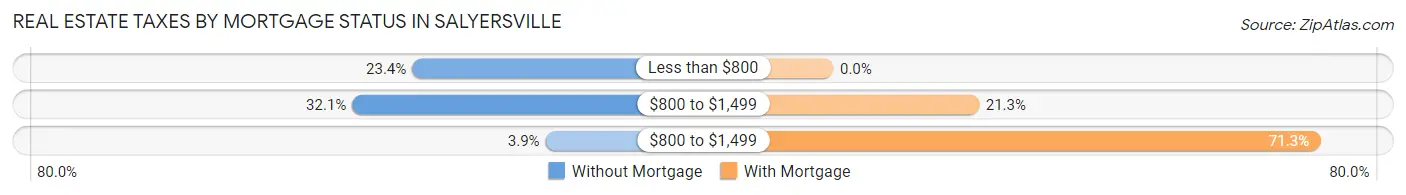
| Property Taxes | Without Mortgage | With Mortgage |
| Less than $800 | 72 (23.4%) | 0 (0.0%) |
| $800 to $1,499 | 99 (32.1%) | 23 (21.3%) |
| $800 to $1,499 | 12 (3.9%) | 77 (71.3%) |
| Total | 308 (100.0%) | 108 (100.0%) |
Health & Disability in Salyersville
Health Insurance Coverage by Age in Salyersville
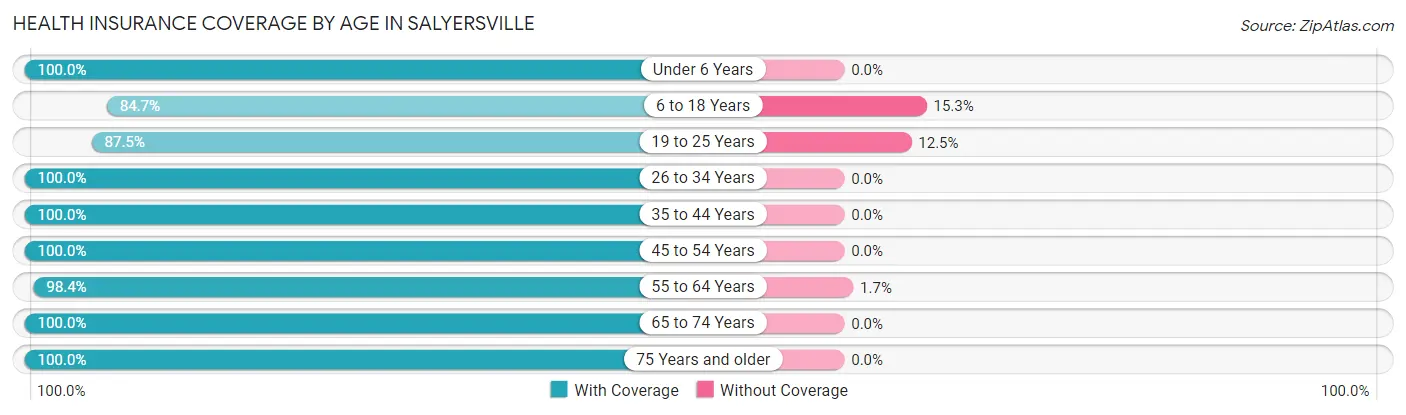
| Age Bracket | With Coverage | Without Coverage |
| Under 6 Years | 168 (100.0%) | 0 (0.0%) |
| 6 to 18 Years | 265 (84.7%) | 48 (15.3%) |
| 19 to 25 Years | 49 (87.5%) | 7 (12.5%) |
| 26 to 34 Years | 134 (100.0%) | 0 (0.0%) |
| 35 to 44 Years | 135 (100.0%) | 0 (0.0%) |
| 45 to 54 Years | 339 (100.0%) | 0 (0.0%) |
| 55 to 64 Years | 238 (98.4%) | 4 (1.7%) |
| 65 to 74 Years | 231 (100.0%) | 0 (0.0%) |
| 75 Years and older | 133 (100.0%) | 0 (0.0%) |
| Total | 1,692 (96.6%) | 59 (3.4%) |
Health Insurance Coverage by Citizenship Status in Salyersville
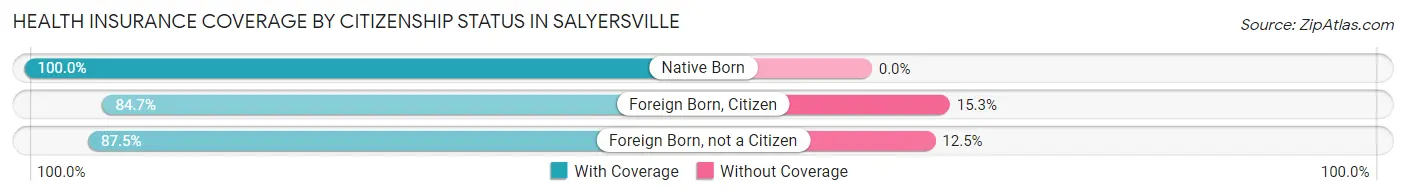
| Citizenship Status | With Coverage | Without Coverage |
| Native Born | 168 (100.0%) | 0 (0.0%) |
| Foreign Born, Citizen | 265 (84.7%) | 48 (15.3%) |
| Foreign Born, not a Citizen | 49 (87.5%) | 7 (12.5%) |
Health Insurance Coverage by Household Income in Salyersville
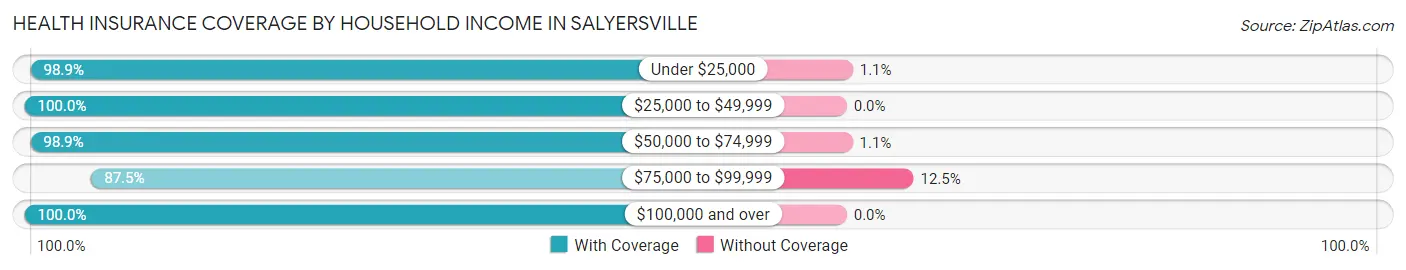
| Household Income | With Coverage | Without Coverage |
| Under $25,000 | 618 (98.9%) | 7 (1.1%) |
| $25,000 to $49,999 | 335 (100.0%) | 0 (0.0%) |
| $50,000 to $74,999 | 364 (98.9%) | 4 (1.1%) |
| $75,000 to $99,999 | 336 (87.5%) | 48 (12.5%) |
| $100,000 and over | 39 (100.0%) | 0 (0.0%) |
Public vs Private Health Insurance Coverage by Age in Salyersville
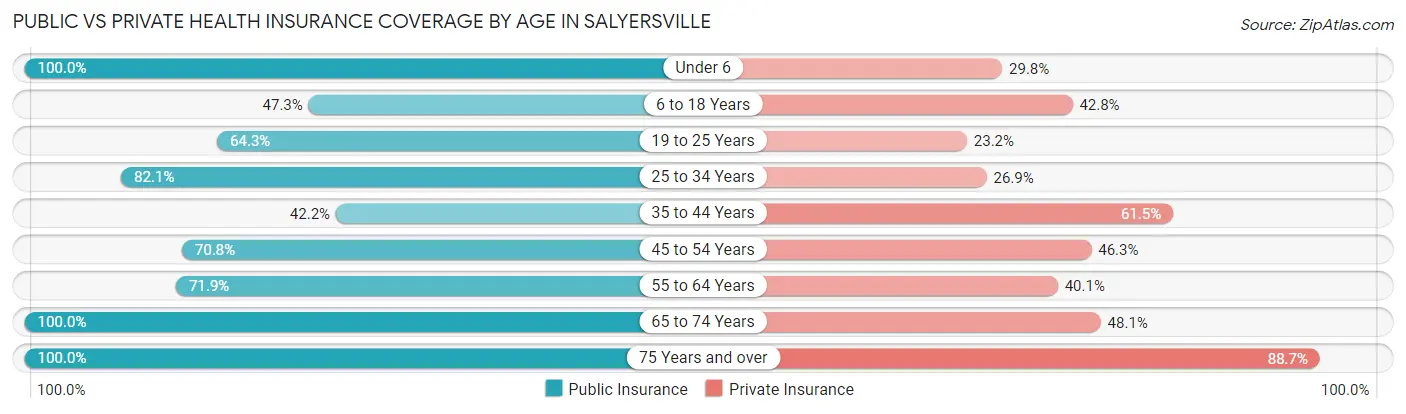
| Age Bracket | Public Insurance | Private Insurance |
| Under 6 | 168 (100.0%) | 50 (29.8%) |
| 6 to 18 Years | 148 (47.3%) | 134 (42.8%) |
| 19 to 25 Years | 36 (64.3%) | 13 (23.2%) |
| 25 to 34 Years | 110 (82.1%) | 36 (26.9%) |
| 35 to 44 Years | 57 (42.2%) | 83 (61.5%) |
| 45 to 54 Years | 240 (70.8%) | 157 (46.3%) |
| 55 to 64 Years | 174 (71.9%) | 97 (40.1%) |
| 65 to 74 Years | 231 (100.0%) | 111 (48.0%) |
| 75 Years and over | 133 (100.0%) | 118 (88.7%) |
| Total | 1,297 (74.1%) | 799 (45.6%) |
Disability Status by Sex by Age in Salyersville
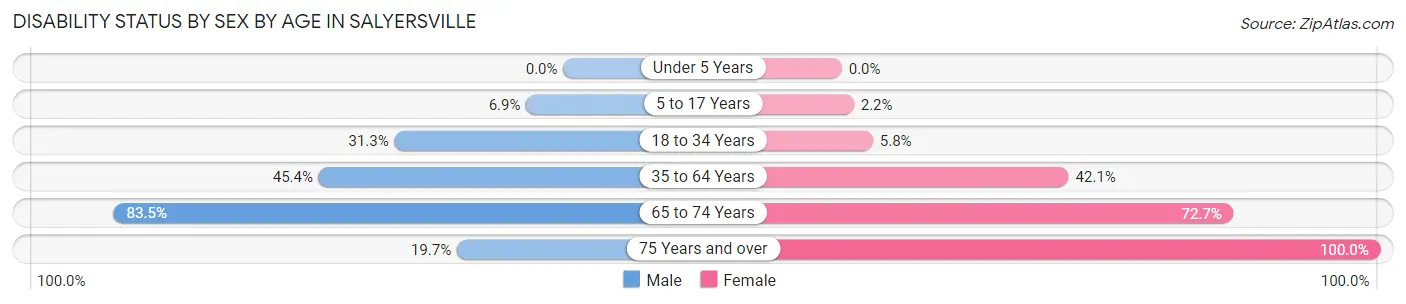
| Age Bracket | Male | Female |
| Under 5 Years | 0 (0.0%) | 0 (0.0%) |
| 5 to 17 Years | 13 (6.9%) | 3 (2.2%) |
| 18 to 34 Years | 21 (31.3%) | 8 (5.8%) |
| 35 to 64 Years | 187 (45.4%) | 128 (42.1%) |
| 65 to 74 Years | 101 (83.5%) | 80 (72.7%) |
| 75 Years and over | 15 (19.7%) | 57 (100.0%) |
Disability Class by Sex by Age in Salyersville
Disability Class: Hearing Difficulty
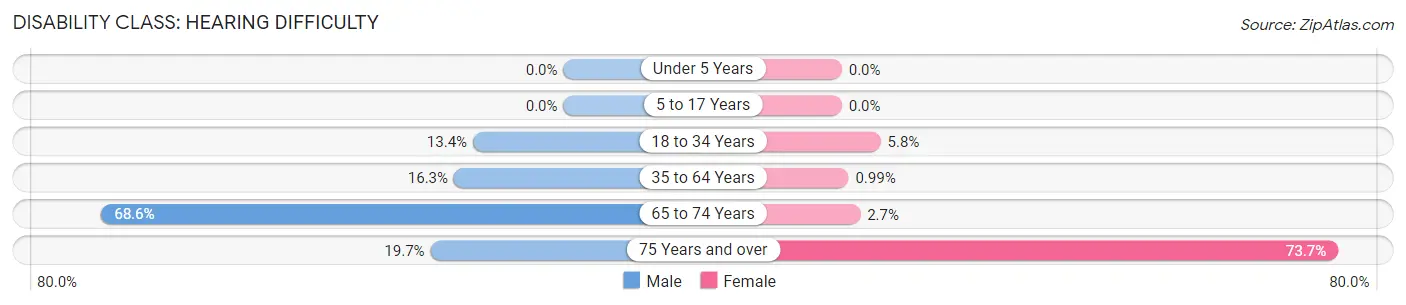
| Age Bracket | Male | Female |
| Under 5 Years | 0 (0.0%) | 0 (0.0%) |
| 5 to 17 Years | 0 (0.0%) | 0 (0.0%) |
| 18 to 34 Years | 9 (13.4%) | 8 (5.8%) |
| 35 to 64 Years | 67 (16.3%) | 3 (1.0%) |
| 65 to 74 Years | 83 (68.6%) | 3 (2.7%) |
| 75 Years and over | 15 (19.7%) | 42 (73.7%) |
Disability Class: Vision Difficulty
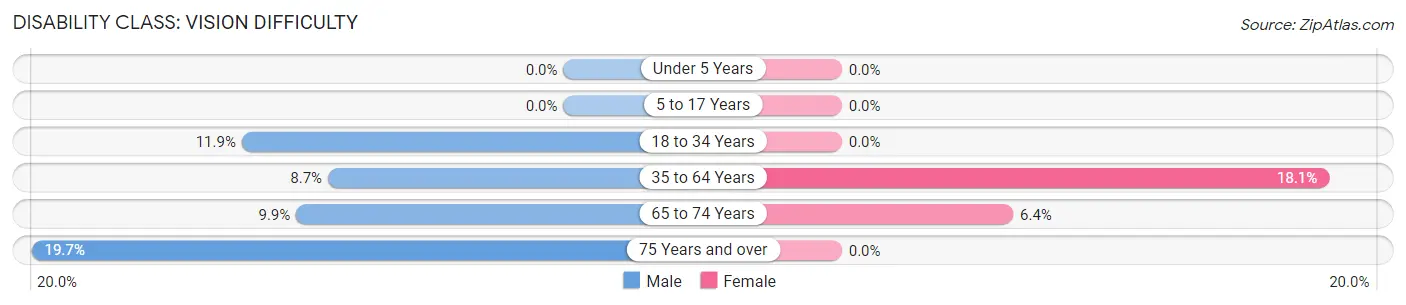
| Age Bracket | Male | Female |
| Under 5 Years | 0 (0.0%) | 0 (0.0%) |
| 5 to 17 Years | 0 (0.0%) | 0 (0.0%) |
| 18 to 34 Years | 8 (11.9%) | 0 (0.0%) |
| 35 to 64 Years | 36 (8.7%) | 55 (18.1%) |
| 65 to 74 Years | 12 (9.9%) | 7 (6.4%) |
| 75 Years and over | 15 (19.7%) | 0 (0.0%) |
Disability Class: Cognitive Difficulty
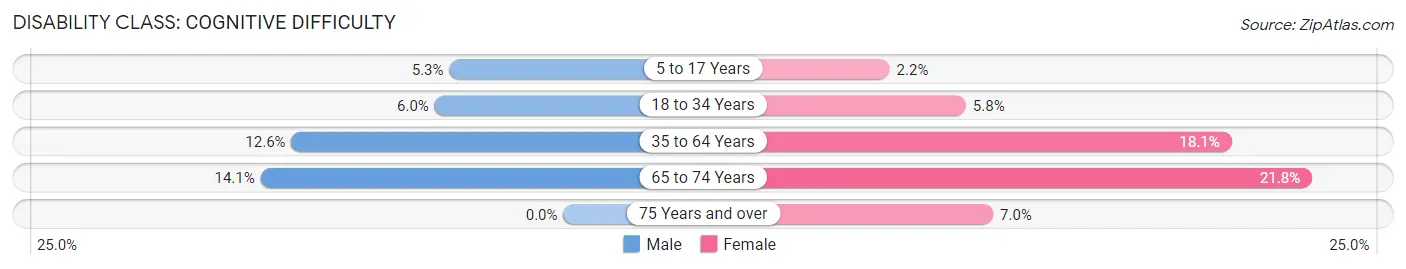
| Age Bracket | Male | Female |
| 5 to 17 Years | 10 (5.3%) | 3 (2.2%) |
| 18 to 34 Years | 4 (6.0%) | 8 (5.8%) |
| 35 to 64 Years | 52 (12.6%) | 55 (18.1%) |
| 65 to 74 Years | 17 (14.1%) | 24 (21.8%) |
| 75 Years and over | 0 (0.0%) | 4 (7.0%) |
Disability Class: Ambulatory Difficulty
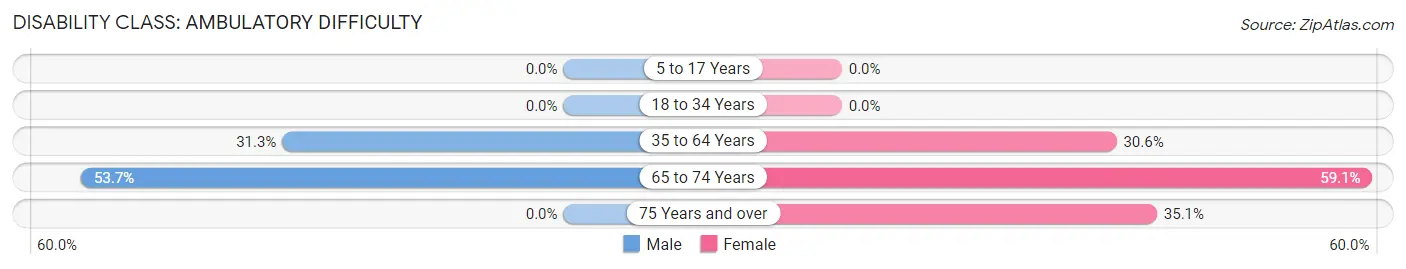
| Age Bracket | Male | Female |
| 5 to 17 Years | 0 (0.0%) | 0 (0.0%) |
| 18 to 34 Years | 0 (0.0%) | 0 (0.0%) |
| 35 to 64 Years | 129 (31.3%) | 93 (30.6%) |
| 65 to 74 Years | 65 (53.7%) | 65 (59.1%) |
| 75 Years and over | 0 (0.0%) | 20 (35.1%) |
Disability Class: Self-Care Difficulty
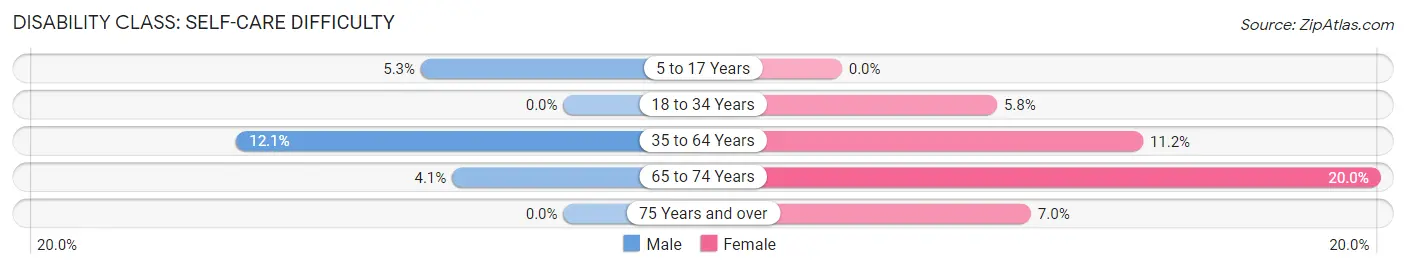
| Age Bracket | Male | Female |
| 5 to 17 Years | 10 (5.3%) | 0 (0.0%) |
| 18 to 34 Years | 0 (0.0%) | 8 (5.8%) |
| 35 to 64 Years | 50 (12.1%) | 34 (11.2%) |
| 65 to 74 Years | 5 (4.1%) | 22 (20.0%) |
| 75 Years and over | 0 (0.0%) | 4 (7.0%) |
Technology Access in Salyersville
Computing Device Access in Salyersville
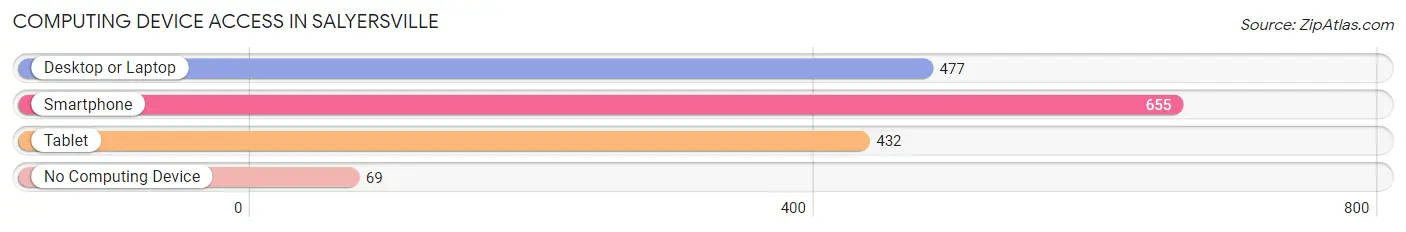
| Device Type | # Households | % Households |
| Desktop or Laptop | 477 | 62.8% |
| Smartphone | 655 | 86.3% |
| Tablet | 432 | 56.9% |
| No Computing Device | 69 | 9.1% |
| Total | 759 | 100.0% |
Internet Access in Salyersville
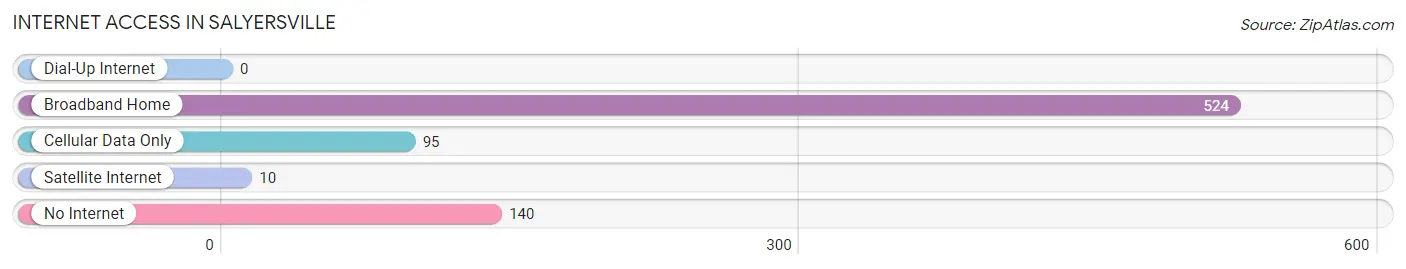
| Internet Type | # Households | % Households |
| Dial-Up Internet | 0 | 0.0% |
| Broadband Home | 524 | 69.0% |
| Cellular Data Only | 95 | 12.5% |
| Satellite Internet | 10 | 1.3% |
| No Internet | 140 | 18.4% |
| Total | 759 | 100.0% |
Salyersville Summary
Salyersville is a city located in Magoffin County, Kentucky, United States. It is the county seat of Magoffin County and the largest city in the county. The population was 1,845 at the 2010 census.
History
Salyersville was founded in 1854 by William Salyer, a local landowner. The city was named after him and was incorporated in 1872. The city was a major stop on the Kentucky Central Railroad, which connected the city to Lexington and Cincinnati. The railroad was a major factor in the city's growth and development.
In the late 19th century, Salyersville was a major center of the timber industry. The city was home to several sawmills and lumber companies, which provided employment for many of the city's residents.
Geography
Salyersville is located at the junction of U.S. Route 460 and Kentucky Route 114 in eastern Magoffin County. It is situated in the foothills of the Appalachian Mountains, about 30 miles east of Prestonsburg. The city is located at an elevation of 845 feet above sea level.
The city has a total area of 2.2 square miles, all of which is land. The city is located in a hilly region, with the highest point in the city being 1,000 feet above sea level.
Economy
The economy of Salyersville is largely based on agriculture and tourism. The city is home to several farms, which produce a variety of crops, including corn, soybeans, and tobacco. The city is also home to several tourist attractions, including the Magoffin County Historical Society Museum, the Salyersville Country Club, and the Salyersville Golf Course.
The city is also home to several manufacturing companies, including a furniture factory, a plastics factory, and a metal fabrication plant.
Demographics
As of the 2010 census, there were 1,845 people, 745 households, and 486 families residing in the city. The population density was 830.9 people per square mile. The racial makeup of the city was 97.2% White, 0.7% African American, 0.2% Native American, 0.2% Asian, 0.1% Pacific Islander, 0.7% from other races, and 0.9% from two or more races. Hispanic or Latino of any race were 1.3% of the population.
The median income for a household in the city was $20,938, and the median income for a family was $25,938. The per capita income for the city was $11,938. About 24.2% of families and 28.2% of the population were below the poverty line, including 37.2% of those under age 18 and 22.2% of those age 65 or over.
Common Questions
What is Per Capita Income in Salyersville?
Per Capita income in Salyersville is $17,190.
What is the Median Household income in Salyersville?
Median Household Income in Salyersville is $29,280.
What is Income or Wage Gap in Salyersville?
Income or Wage Gap in Salyersville is 27.9%.
Women in Salyersville earn 72.1 cents for every dollar earned by a man.
What is Family Income Deficit in Salyersville?
Family Income Deficit in Salyersville is $9,932.
Families that are below poverty line in Salyersville earn $9,932 less on average than the poverty threshold level.
What is Inequality or Gini Index in Salyersville?
Inequality or Gini Index in Salyersville is 0.46.
What is the Total Population of Salyersville?
Total Population of Salyersville is 1,880.
What is the Total Male Population of Salyersville?
Total Male Population of Salyersville is 943.
What is the Total Female Population of Salyersville?
Total Female Population of Salyersville is 937.
What is the Ratio of Males per 100 Females in Salyersville?
There are 100.64 Males per 100 Females in Salyersville.
What is the Ratio of Females per 100 Males in Salyersville?
There are 99.36 Females per 100 Males in Salyersville.
What is the Median Population Age in Salyersville?
Median Population Age in Salyersville is 49.8 Years.
What is the Average Family Size in Salyersville
Average Family Size in Salyersville is 3.1 People.
What is the Average Household Size in Salyersville
Average Household Size in Salyersville is 2.3 People.
How Large is the Labor Force in Salyersville?
There are 434 People in the Labor Forcein in Salyersville.
What is the Percentage of People in the Labor Force in Salyersville?
28.6% of People are in the Labor Force in Salyersville.
What is the Unemployment Rate in Salyersville?
Unemployment Rate in Salyersville is 8.1%.