White Plains, KY Map & Demographics
White Plains Map
White Plains Overview
$27,794
PER CAPITA INCOME
$70,000
AVG FAMILY INCOME
$41,125
AVG HOUSEHOLD INCOME
50.5%
WAGE / INCOME GAP [ % ]
49.5¢/ $1
WAGE / INCOME GAP [ $ ]
$9,400
FAMILY INCOME DEFICIT
0.44
INEQUALITY / GINI INDEX
1,009
TOTAL POPULATION
433
MALE POPULATION
576
FEMALE POPULATION
75.17
MALES / 100 FEMALES
133.03
FEMALES / 100 MALES
45.5
MEDIAN AGE
3.0
AVG FAMILY SIZE
2.2
AVG HOUSEHOLD SIZE
375
LABOR FORCE [ PEOPLE ]
46.6%
PERCENT IN LABOR FORCE
3.2%
UNEMPLOYMENT RATE
White Plains Zip Codes
White Plains Area Codes
Income in White Plains
Income Overview in White Plains
Per Capita Income in White Plains is $27,794, while median incomes of families and households are $70,000 and $41,125 respectively.
| Characteristic | Number | Measure |
| Per Capita Income | 1,009 | $27,794 |
| Median Family Income | 262 | $70,000 |
| Mean Family Income | 262 | $80,273 |
| Median Household Income | 453 | $41,125 |
| Mean Household Income | 453 | $59,978 |
| Income Deficit | 262 | $9,400 |
| Wage / Income Gap (%) | 1,009 | 50.48% |
| Wage / Income Gap ($) | 1,009 | 49.52¢ per $1 |
| Gini / Inequality Index | 1,009 | 0.44 |
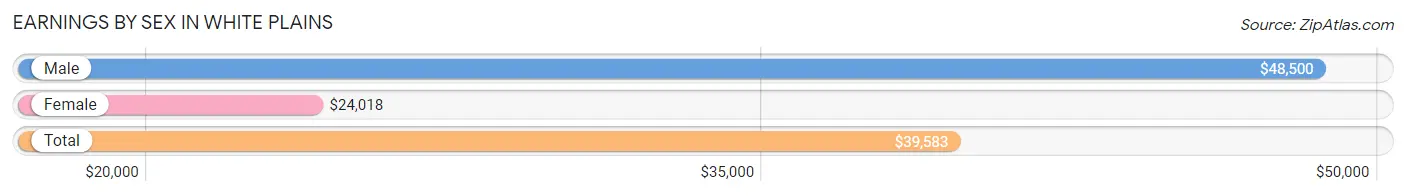
Earnings by Sex in White Plains
Average Earnings in White Plains are $39,583, $48,500 for men and $24,018 for women, a difference of 50.5%.
| Sex | Number | Average Earnings |
| Male | 214 (55.0%) | $48,500 |
| Female | 175 (45.0%) | $24,018 |
| Total | 389 (100.0%) | $39,583 |
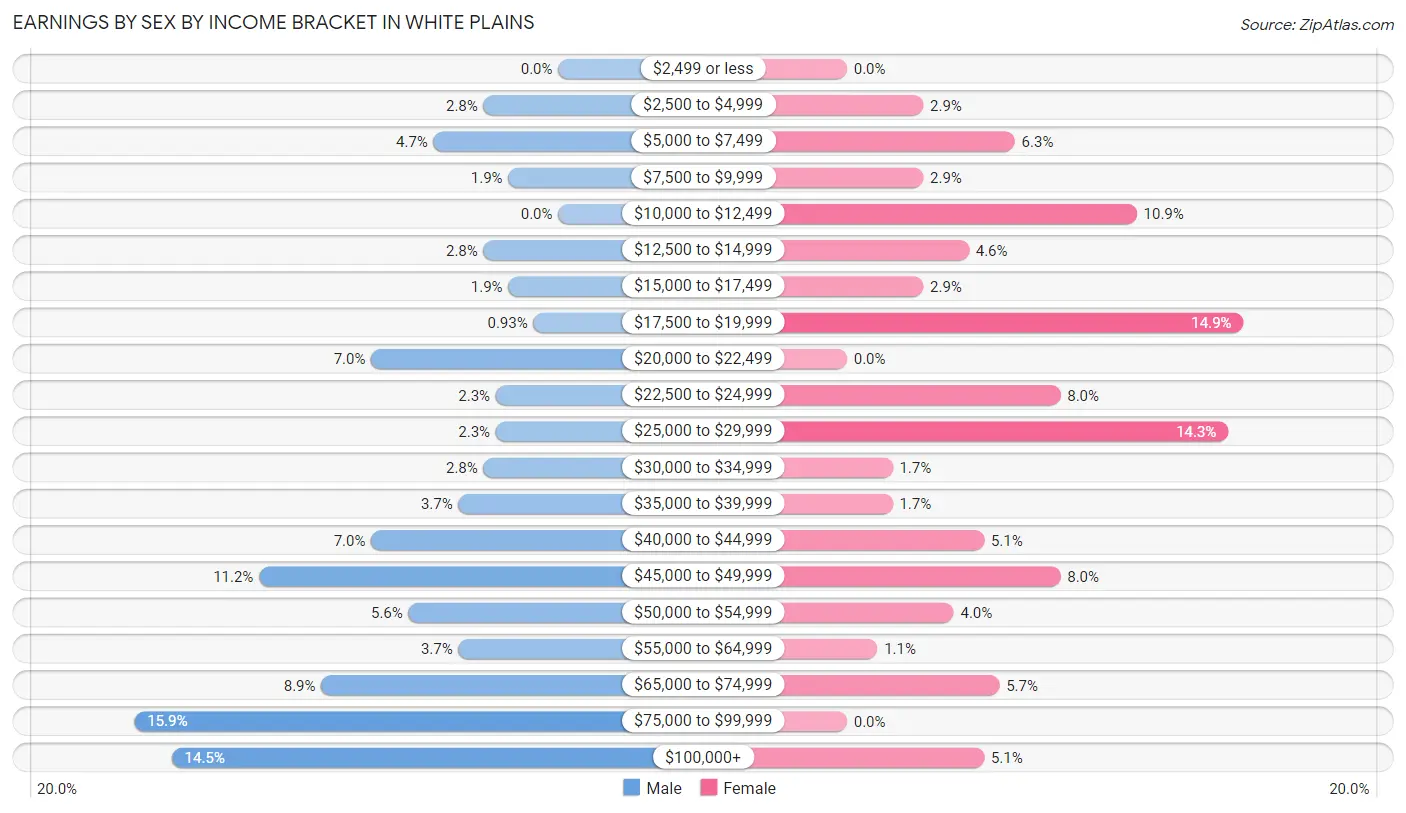
Earnings by Sex by Income Bracket in White Plains
The most common earnings brackets in White Plains are $75,000 to $99,999 for men (34 | 15.9%) and $17,500 to $19,999 for women (26 | 14.9%).
| Income | Male | Female |
| $2,499 or less | 0 (0.0%) | 0 (0.0%) |
| $2,500 to $4,999 | 6 (2.8%) | 5 (2.9%) |
| $5,000 to $7,499 | 10 (4.7%) | 11 (6.3%) |
| $7,500 to $9,999 | 4 (1.9%) | 5 (2.9%) |
| $10,000 to $12,499 | 0 (0.0%) | 19 (10.9%) |
| $12,500 to $14,999 | 6 (2.8%) | 8 (4.6%) |
| $15,000 to $17,499 | 4 (1.9%) | 5 (2.9%) |
| $17,500 to $19,999 | 2 (0.9%) | 26 (14.9%) |
| $20,000 to $22,499 | 15 (7.0%) | 0 (0.0%) |
| $22,500 to $24,999 | 5 (2.3%) | 14 (8.0%) |
| $25,000 to $29,999 | 5 (2.3%) | 25 (14.3%) |
| $30,000 to $34,999 | 6 (2.8%) | 3 (1.7%) |
| $35,000 to $39,999 | 8 (3.7%) | 3 (1.7%) |
| $40,000 to $44,999 | 15 (7.0%) | 9 (5.1%) |
| $45,000 to $49,999 | 24 (11.2%) | 14 (8.0%) |
| $50,000 to $54,999 | 12 (5.6%) | 7 (4.0%) |
| $55,000 to $64,999 | 8 (3.7%) | 2 (1.1%) |
| $65,000 to $74,999 | 19 (8.9%) | 10 (5.7%) |
| $75,000 to $99,999 | 34 (15.9%) | 0 (0.0%) |
| $100,000+ | 31 (14.5%) | 9 (5.1%) |
| Total | 214 (100.0%) | 175 (100.0%) |
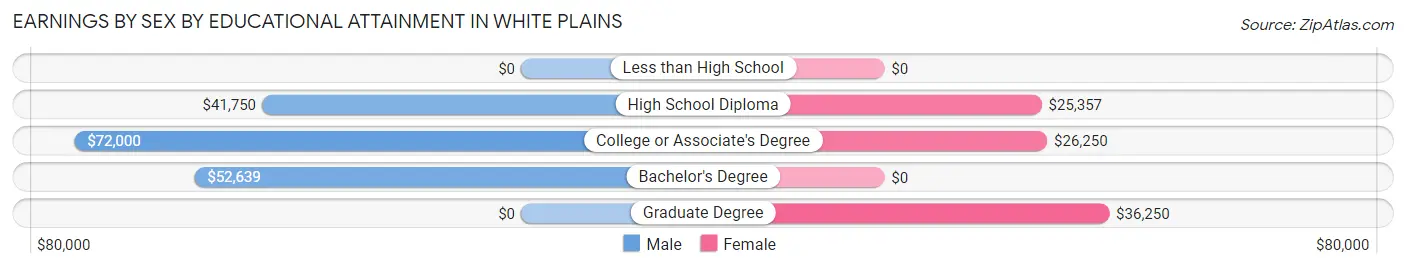
Earnings by Sex by Educational Attainment in White Plains
Average earnings in White Plains are $52,778 for men and $25,658 for women, a difference of 51.4%. Men with an educational attainment of college or associate's degree enjoy the highest average annual earnings of $72,000, while those with high school diploma education earn the least with $41,750. Women with an educational attainment of graduate degree earn the most with the average annual earnings of $36,250, while those with high school diploma education have the smallest earnings of $25,357.
| Educational Attainment | Male Income | Female Income |
| Less than High School | - | - |
| High School Diploma | $41,750 | $25,357 |
| College or Associate's Degree | $72,000 | $26,250 |
| Bachelor's Degree | $52,639 | $0 |
| Graduate Degree | - | - |
| Total | $52,778 | $25,658 |
Family Income in White Plains
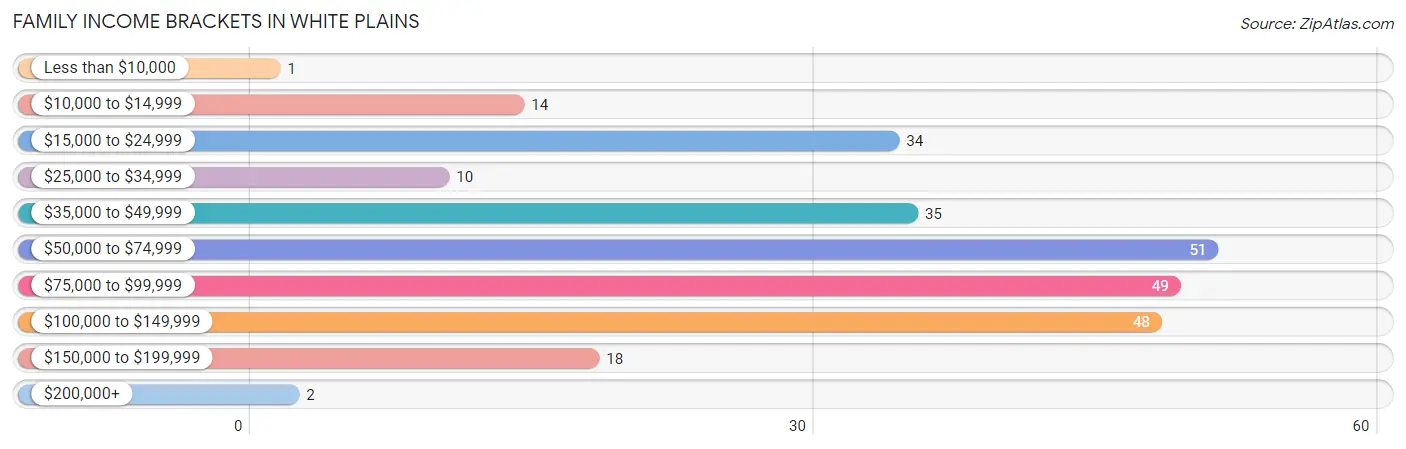
Family Income Brackets in White Plains
According to the White Plains family income data, there are 51 families falling into the $50,000 to $74,999 income range, which is the most common income bracket and makes up 19.5% of all families. Conversely, the less than $10,000 income bracket is the least frequent group with only 1 families (0.4%) belonging to this category.
| Income Bracket | # Families | % Families |
| Less than $10,000 | 1 | 0.4% |
| $10,000 to $14,999 | 14 | 5.3% |
| $15,000 to $24,999 | 34 | 13.0% |
| $25,000 to $34,999 | 10 | 3.8% |
| $35,000 to $49,999 | 35 | 13.4% |
| $50,000 to $74,999 | 51 | 19.5% |
| $75,000 to $99,999 | 49 | 18.7% |
| $100,000 to $149,999 | 48 | 18.3% |
| $150,000 to $199,999 | 18 | 6.9% |
| $200,000+ | 2 | 0.8% |
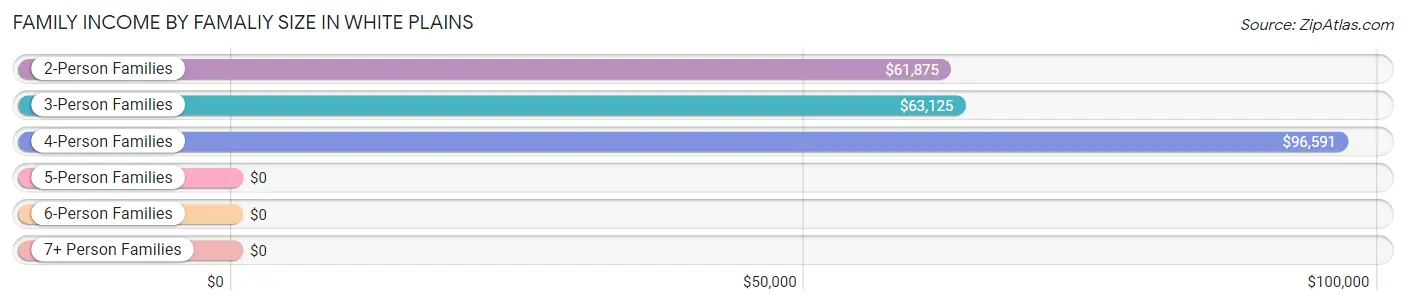
Family Income by Famaliy Size in White Plains
4-person families (68 | 26.0%) account for the highest median family income in White Plains with $96,591 per family, while 2-person families (153 | 58.4%) have the highest median income of $30,938 per family member.
| Income Bracket | # Families | Median Income |
| 2-Person Families | 153 (58.4%) | $61,875 |
| 3-Person Families | 20 (7.6%) | $63,125 |
| 4-Person Families | 68 (26.0%) | $96,591 |
| 5-Person Families | 19 (7.2%) | $0 |
| 6-Person Families | 0 (0.0%) | $0 |
| 7+ Person Families | 2 (0.8%) | $0 |
| Total | 262 (100.0%) | $70,000 |
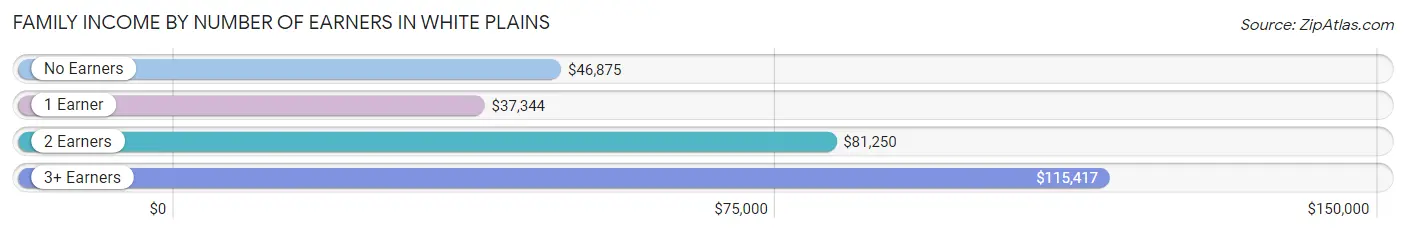
Family Income by Number of Earners in White Plains
The median family income in White Plains is $70,000, with families comprising 3+ earners (13) having the highest median family income of $115,417, while families with 1 earner (92) have the lowest median family income of $37,344, accounting for 5.0% and 35.1% of families, respectively.
| Number of Earners | # Families | Median Income |
| No Earners | 65 (24.8%) | $46,875 |
| 1 Earner | 92 (35.1%) | $37,344 |
| 2 Earners | 92 (35.1%) | $81,250 |
| 3+ Earners | 13 (5.0%) | $115,417 |
| Total | 262 (100.0%) | $70,000 |
Household Income in White Plains
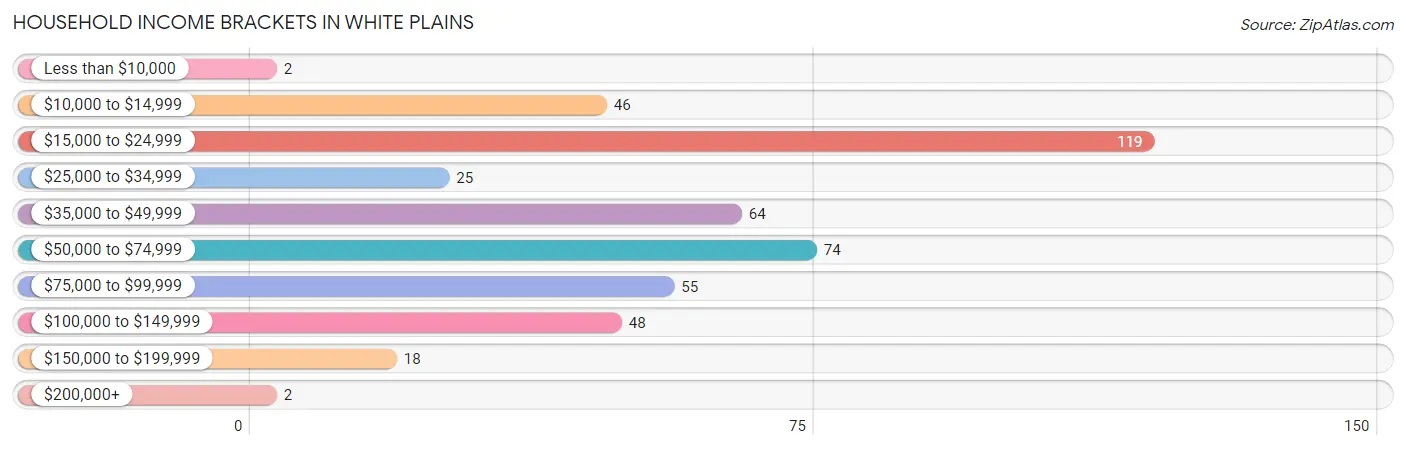
Household Income Brackets in White Plains
With 119 households falling in the category, the $15,000 to $24,999 income range is the most frequent in White Plains, accounting for 26.3% of all households. In contrast, only 2 households (0.4%) fall into the less than $10,000 income bracket, making it the least populous group.
| Income Bracket | # Households | % Households |
| Less than $10,000 | 2 | 0.4% |
| $10,000 to $14,999 | 46 | 10.2% |
| $15,000 to $24,999 | 119 | 26.3% |
| $25,000 to $34,999 | 25 | 5.5% |
| $35,000 to $49,999 | 64 | 14.1% |
| $50,000 to $74,999 | 74 | 16.3% |
| $75,000 to $99,999 | 55 | 12.1% |
| $100,000 to $149,999 | 48 | 10.6% |
| $150,000 to $199,999 | 18 | 4.0% |
| $200,000+ | 2 | 0.4% |
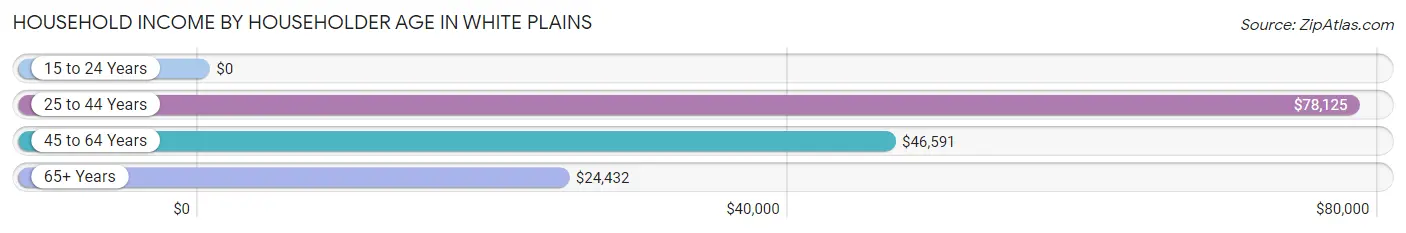
Household Income by Householder Age in White Plains
The median household income in White Plains is $41,125, with the highest median household income of $78,125 found in the 25 to 44 years age bracket for the primary householder. A total of 128 households (28.3%) fall into this category.
| Income Bracket | # Households | Median Income |
| 15 to 24 Years | 0 (0.0%) | $0 |
| 25 to 44 Years | 128 (28.3%) | $78,125 |
| 45 to 64 Years | 120 (26.5%) | $46,591 |
| 65+ Years | 205 (45.3%) | $24,432 |
| Total | 453 (100.0%) | $41,125 |
Poverty in White Plains
Income Below Poverty by Sex and Age in White Plains
With 18.2% poverty level for males and 22.7% for females among the residents of White Plains, under 5 year old males and 18 to 24 year old females are the most vulnerable to poverty, with 7 males (77.8%) and 8 females (47.1%) in their respective age groups living below the poverty level.
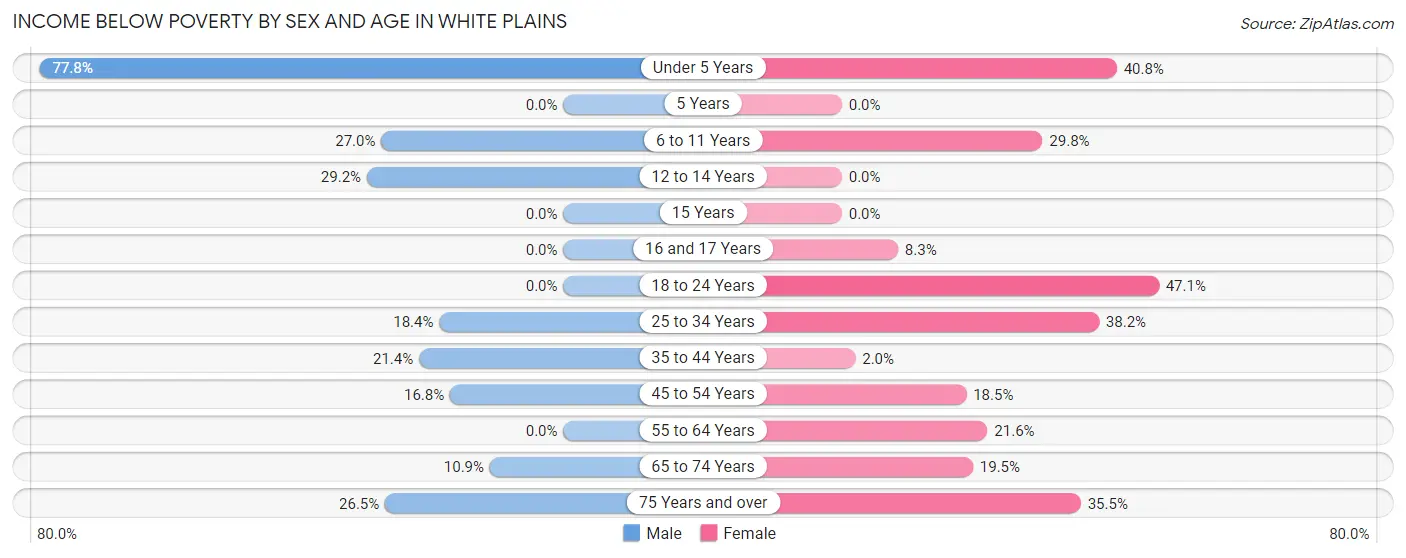
| Age Bracket | Male | Female |
| Under 5 Years | 7 (77.8%) | 20 (40.8%) |
| 5 Years | 0 (0.0%) | 0 (0.0%) |
| 6 to 11 Years | 10 (27.0%) | 14 (29.8%) |
| 12 to 14 Years | 7 (29.2%) | 0 (0.0%) |
| 15 Years | 0 (0.0%) | 0 (0.0%) |
| 16 and 17 Years | 0 (0.0%) | 2 (8.3%) |
| 18 to 24 Years | 0 (0.0%) | 8 (47.1%) |
| 25 to 34 Years | 7 (18.4%) | 21 (38.2%) |
| 35 to 44 Years | 15 (21.4%) | 1 (2.0%) |
| 45 to 54 Years | 17 (16.8%) | 17 (18.5%) |
| 55 to 64 Years | 0 (0.0%) | 8 (21.6%) |
| 65 to 74 Years | 6 (10.9%) | 29 (19.5%) |
| 75 Years and over | 9 (26.5%) | 11 (35.5%) |
| Total | 78 (18.2%) | 131 (22.7%) |
Income Above Poverty by Sex and Age in White Plains
According to the poverty statistics in White Plains, males aged 5 years and females aged 12 to 14 years are the age groups that are most secure financially, with 100.0% of males and 100.0% of females in these age groups living above the poverty line.
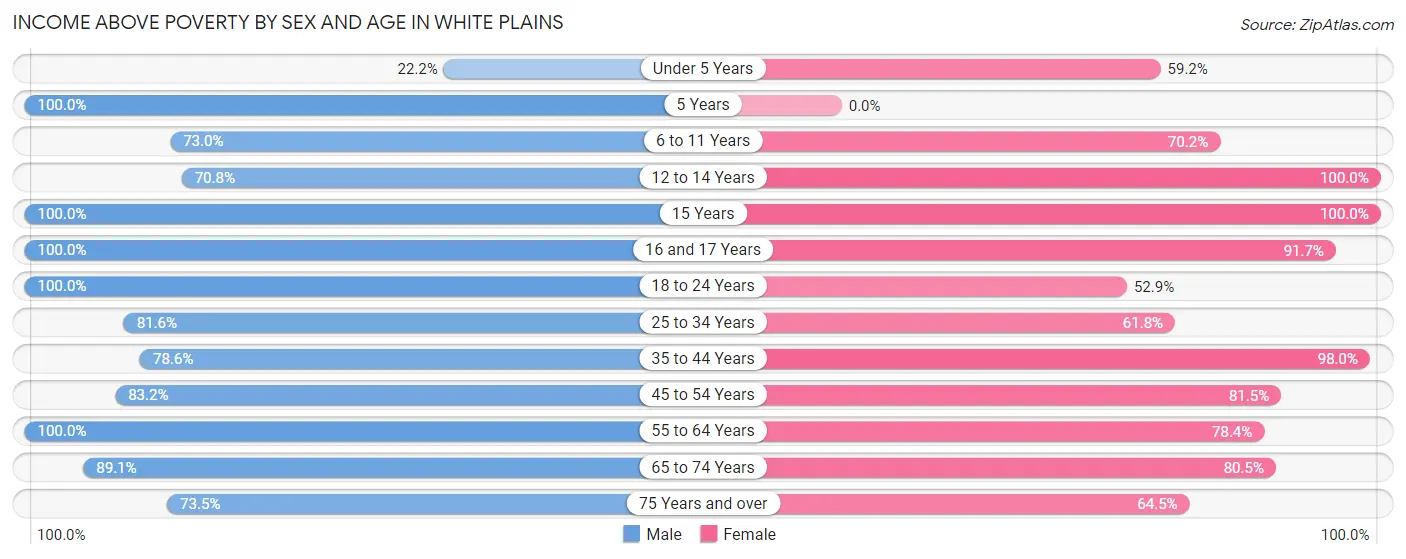
| Age Bracket | Male | Female |
| Under 5 Years | 2 (22.2%) | 29 (59.2%) |
| 5 Years | 6 (100.0%) | 0 (0.0%) |
| 6 to 11 Years | 27 (73.0%) | 33 (70.2%) |
| 12 to 14 Years | 17 (70.8%) | 14 (100.0%) |
| 15 Years | 3 (100.0%) | 11 (100.0%) |
| 16 and 17 Years | 2 (100.0%) | 22 (91.7%) |
| 18 to 24 Years | 20 (100.0%) | 9 (52.9%) |
| 25 to 34 Years | 31 (81.6%) | 34 (61.8%) |
| 35 to 44 Years | 55 (78.6%) | 49 (98.0%) |
| 45 to 54 Years | 84 (83.2%) | 75 (81.5%) |
| 55 to 64 Years | 29 (100.0%) | 29 (78.4%) |
| 65 to 74 Years | 49 (89.1%) | 120 (80.5%) |
| 75 Years and over | 25 (73.5%) | 20 (64.5%) |
| Total | 350 (81.8%) | 445 (77.3%) |
Income Below Poverty Among Married-Couple Families in White Plains
The poverty statistics for married-couple families in White Plains show that 11.2% or 25 of the total 223 families live below the poverty line. Families with 3 or 4 children have the highest poverty rate of 53.8%, comprising of 7 families. On the other hand, families with 1 or 2 children have the lowest poverty rate of 0.0%, which includes 0 families.
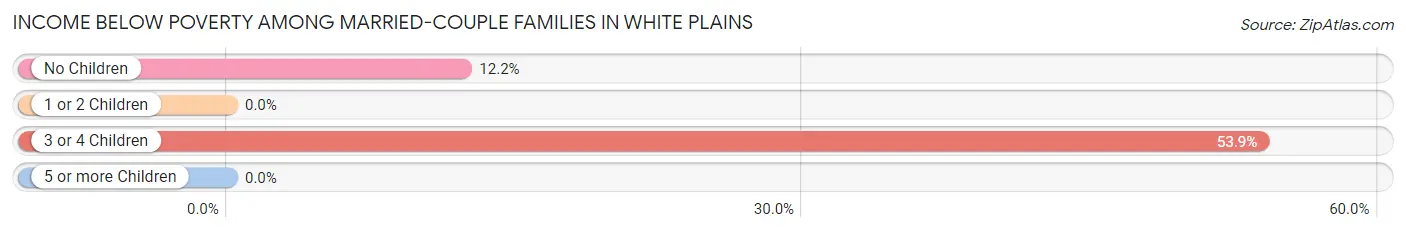
| Children | Above Poverty | Below Poverty |
| No Children | 129 (87.8%) | 18 (12.2%) |
| 1 or 2 Children | 61 (100.0%) | 0 (0.0%) |
| 3 or 4 Children | 6 (46.2%) | 7 (53.8%) |
| 5 or more Children | 2 (100.0%) | 0 (0.0%) |
| Total | 198 (88.8%) | 25 (11.2%) |
Income Below Poverty Among Single-Parent Households in White Plains
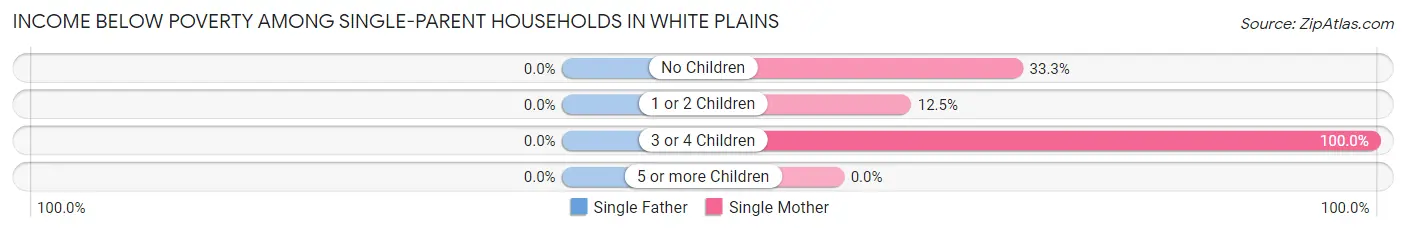
| Children | Single Father | Single Mother |
| No Children | 0 (0.0%) | 3 (33.3%) |
| 1 or 2 Children | 0 (0.0%) | 1 (12.5%) |
| 3 or 4 Children | 0 (0.0%) | 14 (100.0%) |
| 5 or more Children | 0 (0.0%) | 0 (0.0%) |
| Total | 0 (0.0%) | 18 (58.1%) |
Income Below Poverty Among Married-Couple vs Single-Parent Households in White Plains
The poverty data for White Plains shows that 25 of the married-couple family households (11.2%) and 18 of the single-parent households (46.2%) are living below the poverty level. Within the married-couple family households, those with 3 or 4 children have the highest poverty rate, with 7 households (53.8%) falling below the poverty line. Among the single-parent households, those with 3 or 4 children have the highest poverty rate, with 14 household (100.0%) living below poverty.
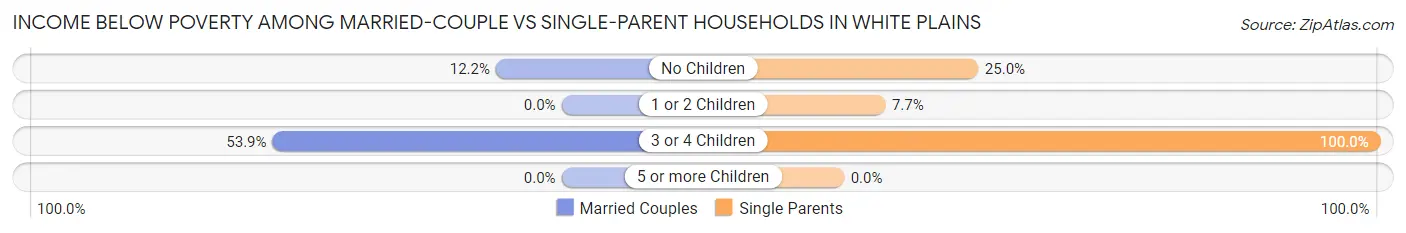
| Children | Married-Couple Families | Single-Parent Households |
| No Children | 18 (12.2%) | 3 (25.0%) |
| 1 or 2 Children | 0 (0.0%) | 1 (7.7%) |
| 3 or 4 Children | 7 (53.8%) | 14 (100.0%) |
| 5 or more Children | 0 (0.0%) | 0 (0.0%) |
| Total | 25 (11.2%) | 18 (46.2%) |
Race in White Plains
The most populous races in White Plains are White / Caucasian (979 | 97.0%), Two or more Races (20 | 2.0%), and Hispanic or Latino (8 | 0.8%).
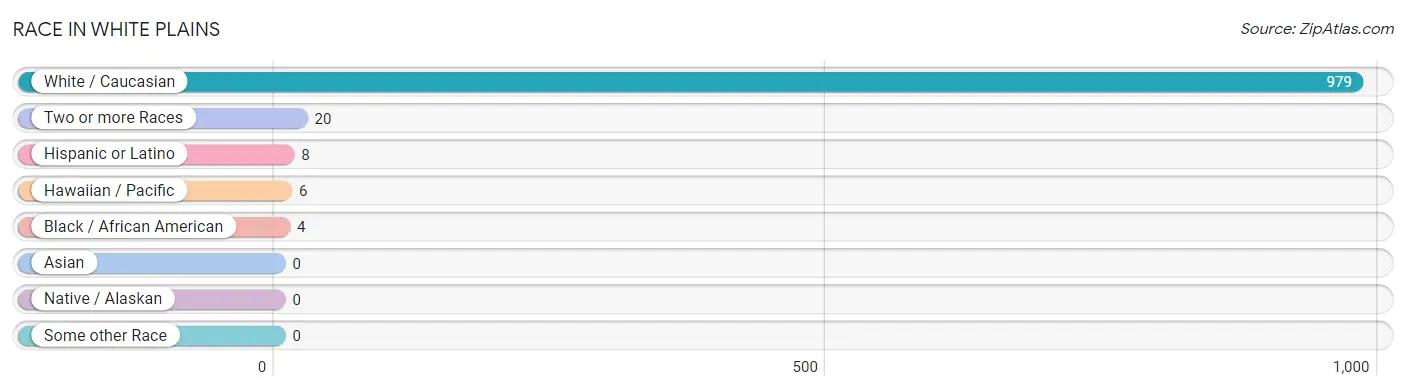
| Race | # Population | % Population |
| Asian | 0 | 0.0% |
| Black / African American | 4 | 0.4% |
| Hawaiian / Pacific | 6 | 0.6% |
| Hispanic or Latino | 8 | 0.8% |
| Native / Alaskan | 0 | 0.0% |
| White / Caucasian | 979 | 97.0% |
| Two or more Races | 20 | 2.0% |
| Some other Race | 0 | 0.0% |
| Total | 1,009 | 100.0% |
Ancestry in White Plains
The most populous ancestries reported in White Plains are American (195 | 19.3%), English (89 | 8.8%), Irish (67 | 6.6%), German (54 | 5.3%), and Scottish (22 | 2.2%), together accounting for 42.3% of all White Plains residents.
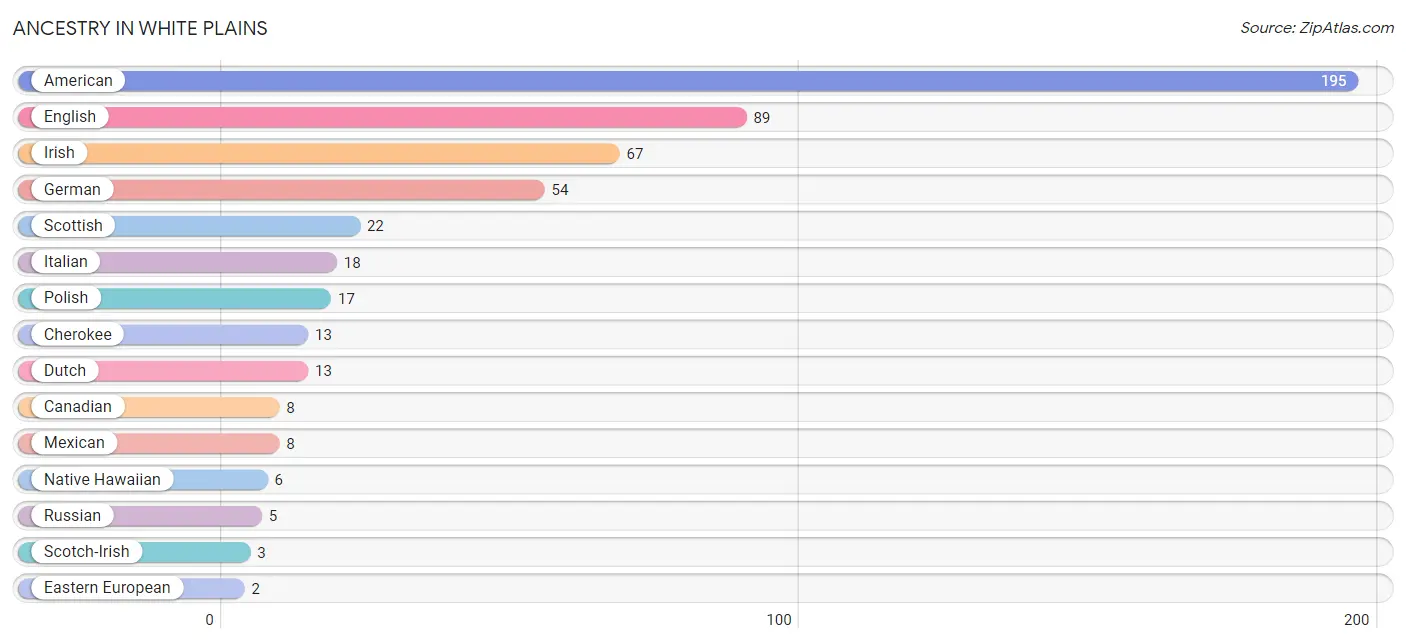
| Ancestry | # Population | % Population |
| American | 195 | 19.3% |
| Canadian | 8 | 0.8% |
| Cherokee | 13 | 1.3% |
| Dutch | 13 | 1.3% |
| Eastern European | 2 | 0.2% |
| English | 89 | 8.8% |
| German | 54 | 5.3% |
| Irish | 67 | 6.6% |
| Italian | 18 | 1.8% |
| Mexican | 8 | 0.8% |
| Native Hawaiian | 6 | 0.6% |
| Polish | 17 | 1.7% |
| Russian | 5 | 0.5% |
| Scotch-Irish | 3 | 0.3% |
| Scottish | 22 | 2.2% |
| Swedish | 2 | 0.2% | View All 16 Rows |
Immigrants in White Plains
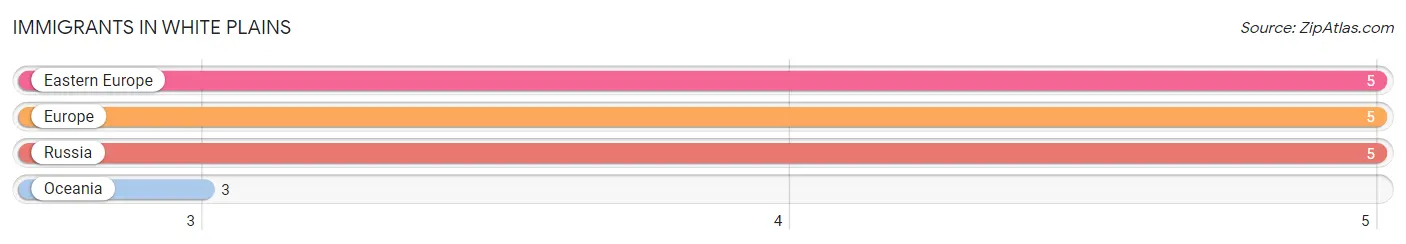
The most numerous immigrant groups reported in White Plains came from Eastern Europe (5 | 0.5%), Europe (5 | 0.5%), Russia (5 | 0.5%), and Oceania (3 | 0.3%), together accounting for 1.8% of all White Plains residents.
| Immigration Origin | # Population | % Population |
| Eastern Europe | 5 | 0.5% |
| Europe | 5 | 0.5% |
| Oceania | 3 | 0.3% |
| Russia | 5 | 0.5% | View All 4 Rows |
Sex and Age in White Plains
Sex and Age in White Plains
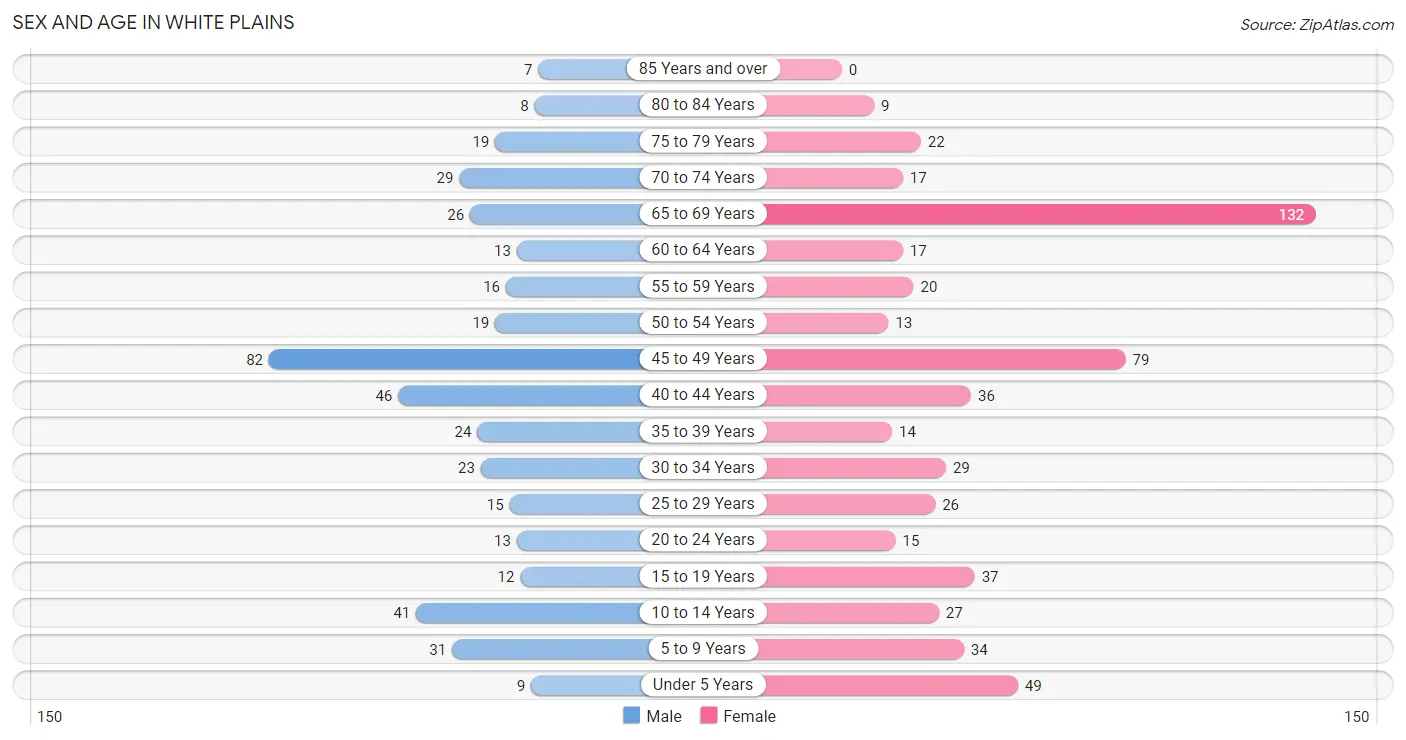
The most populous age groups in White Plains are 45 to 49 Years (82 | 18.9%) for men and 65 to 69 Years (132 | 22.9%) for women.
| Age Bracket | Male | Female |
| Under 5 Years | 9 (2.1%) | 49 (8.5%) |
| 5 to 9 Years | 31 (7.2%) | 34 (5.9%) |
| 10 to 14 Years | 41 (9.5%) | 27 (4.7%) |
| 15 to 19 Years | 12 (2.8%) | 37 (6.4%) |
| 20 to 24 Years | 13 (3.0%) | 15 (2.6%) |
| 25 to 29 Years | 15 (3.5%) | 26 (4.5%) |
| 30 to 34 Years | 23 (5.3%) | 29 (5.0%) |
| 35 to 39 Years | 24 (5.5%) | 14 (2.4%) |
| 40 to 44 Years | 46 (10.6%) | 36 (6.2%) |
| 45 to 49 Years | 82 (18.9%) | 79 (13.7%) |
| 50 to 54 Years | 19 (4.4%) | 13 (2.3%) |
| 55 to 59 Years | 16 (3.7%) | 20 (3.5%) |
| 60 to 64 Years | 13 (3.0%) | 17 (2.9%) |
| 65 to 69 Years | 26 (6.0%) | 132 (22.9%) |
| 70 to 74 Years | 29 (6.7%) | 17 (2.9%) |
| 75 to 79 Years | 19 (4.4%) | 22 (3.8%) |
| 80 to 84 Years | 8 (1.8%) | 9 (1.6%) |
| 85 Years and over | 7 (1.6%) | 0 (0.0%) |
| Total | 433 (100.0%) | 576 (100.0%) |
Families and Households in White Plains
Median Family Size in White Plains
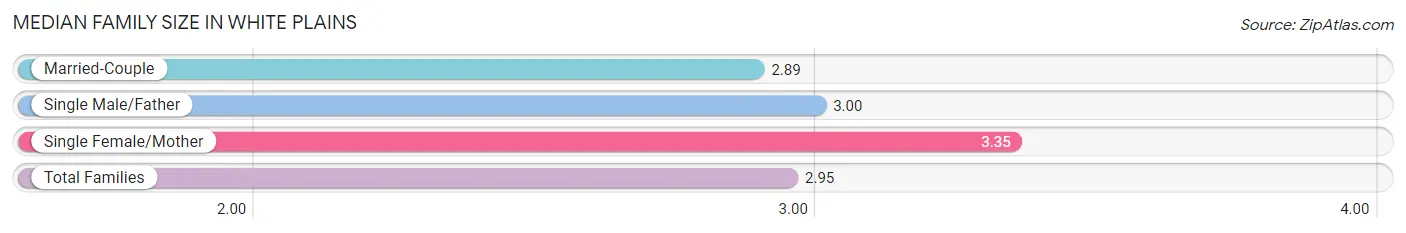
The median family size in White Plains is 2.95 persons per family, with single female/mother families (31 | 11.8%) accounting for the largest median family size of 3.35 persons per family. On the other hand, married-couple families (223 | 85.1%) represent the smallest median family size with 2.89 persons per family.
| Family Type | # Families | Family Size |
| Married-Couple | 223 (85.1%) | 2.89 |
| Single Male/Father | 8 (3.0%) | 3.00 |
| Single Female/Mother | 31 (11.8%) | 3.35 |
| Total Families | 262 (100.0%) | 2.95 |
Median Household Size in White Plains
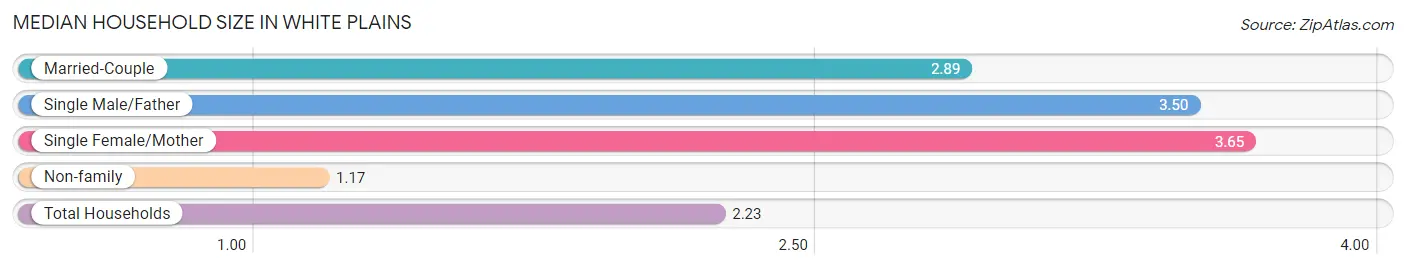
The median household size in White Plains is 2.23 persons per household, with single female/mother households (31 | 6.8%) accounting for the largest median household size of 3.65 persons per household. non-family households (191 | 42.2%) represent the smallest median household size with 1.17 persons per household.
| Household Type | # Households | Household Size |
| Married-Couple | 223 (49.2%) | 2.89 |
| Single Male/Father | 8 (1.8%) | 3.50 |
| Single Female/Mother | 31 (6.8%) | 3.65 |
| Non-family | 191 (42.2%) | 1.17 |
| Total Households | 453 (100.0%) | 2.23 |
Household Size by Marriage Status in White Plains
Out of a total of 453 households in White Plains, 262 (57.8%) are family households, while 191 (42.2%) are nonfamily households. The most numerous type of family households are 2-person households, comprising 150, and the most common type of nonfamily households are 1-person households, comprising 175.
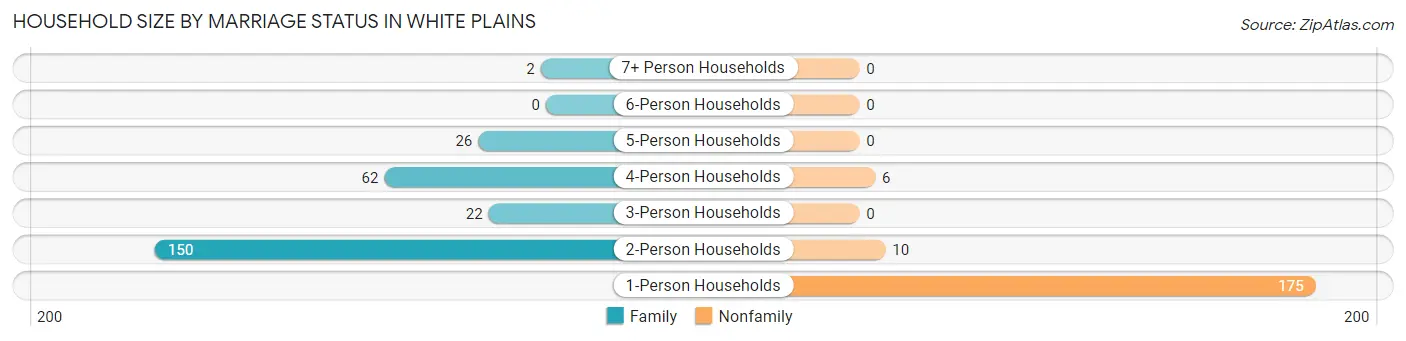
| Household Size | Family Households | Nonfamily Households |
| 1-Person Households | - | 175 (38.6%) |
| 2-Person Households | 150 (33.1%) | 10 (2.2%) |
| 3-Person Households | 22 (4.9%) | 0 (0.0%) |
| 4-Person Households | 62 (13.7%) | 6 (1.3%) |
| 5-Person Households | 26 (5.7%) | 0 (0.0%) |
| 6-Person Households | 0 (0.0%) | 0 (0.0%) |
| 7+ Person Households | 2 (0.4%) | 0 (0.0%) |
| Total | 262 (57.8%) | 191 (42.2%) |
Female Fertility in White Plains
Fertility by Age in White Plains
Average fertility rate in White Plains is 96.0 births per 1,000 women. Women in the age bracket of 20 to 34 years have the highest fertility rate with 271.0 births per 1,000 women. Women in the age bracket of 20 to 34 years acount for 82.6% of all women with births.
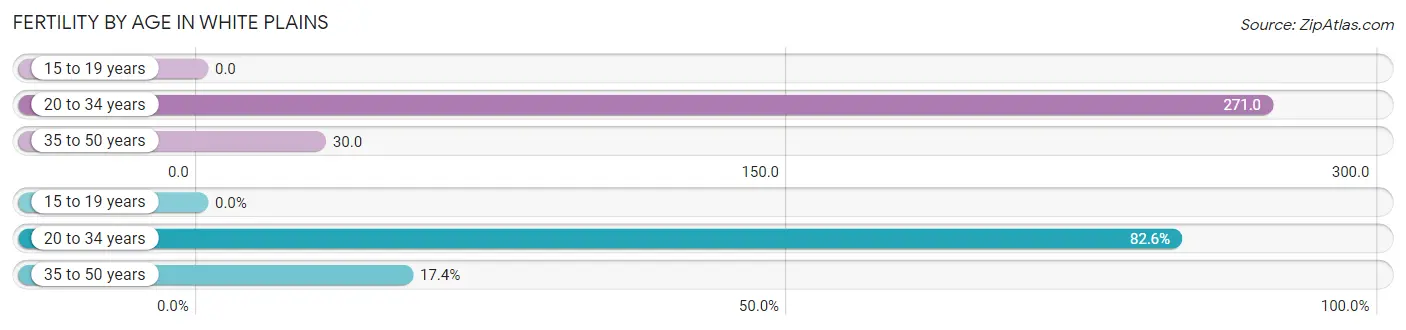
| Age Bracket | Women with Births | Births / 1,000 Women |
| 15 to 19 years | 0 (0.0%) | 0.0 |
| 20 to 34 years | 19 (82.6%) | 271.0 |
| 35 to 50 years | 4 (17.4%) | 30.0 |
| Total | 23 (100.0%) | 96.0 |
Fertility by Age by Marriage Status in White Plains
91.3% of women with births (23) in White Plains are married. The highest percentage of unmarried women with births falls into 20 to 34 years age bracket with 10.5% of them unmarried at the time of birth, while the lowest percentage of unmarried women with births belong to 35 to 50 years age bracket with 0.0% of them unmarried.
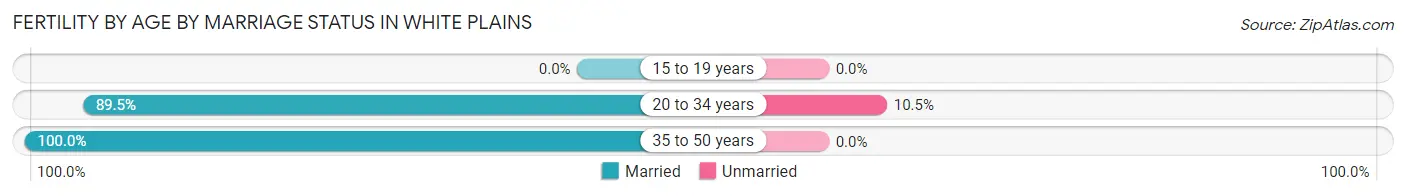
| Age Bracket | Married | Unmarried |
| 15 to 19 years | 0 (0.0%) | 0 (0.0%) |
| 20 to 34 years | 17 (89.5%) | 2 (10.5%) |
| 35 to 50 years | 4 (100.0%) | 0 (0.0%) |
| Total | 21 (91.3%) | 2 (8.7%) |
Fertility by Education in White Plains
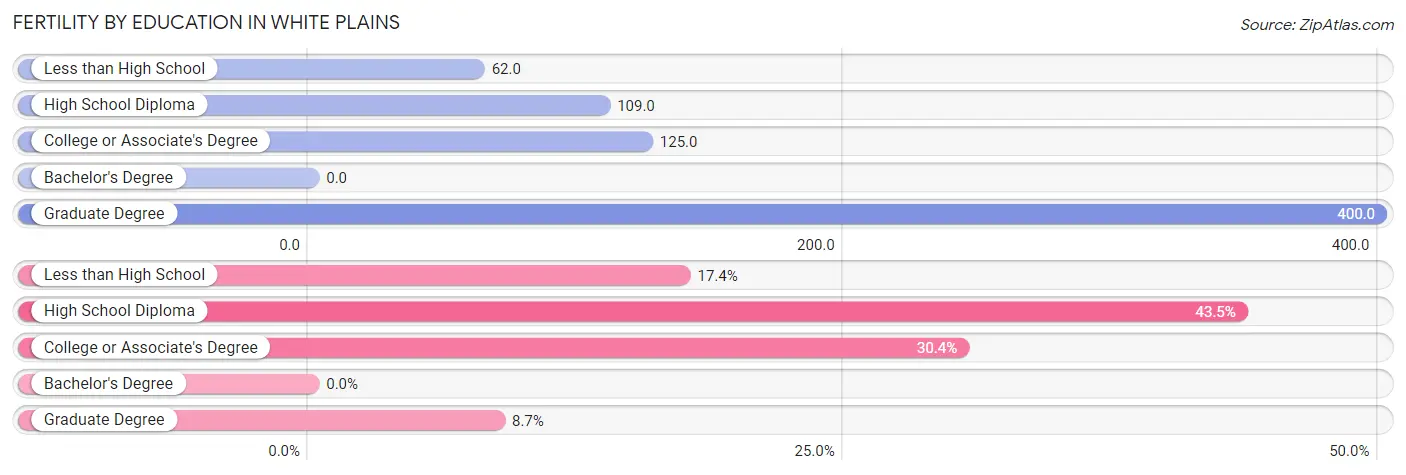
| Educational Attainment | Women with Births | Births / 1,000 Women |
| Less than High School | 4 (17.4%) | 62.0 |
| High School Diploma | 10 (43.5%) | 109.0 |
| College or Associate's Degree | 7 (30.4%) | 125.0 |
| Bachelor's Degree | 0 (0.0%) | 0.0 |
| Graduate Degree | 2 (8.7%) | 400.0 |
| Total | 23 (100.0%) | 96.0 |
Fertility by Education by Marriage Status in White Plains
8.7% of women with births in White Plains are unmarried. Women with the educational attainment of less than high school are most likely to be married with 100.0% of them married at childbirth, while women with the educational attainment of college or associate's degree are least likely to be married with 28.6% of them unmarried at childbirth.
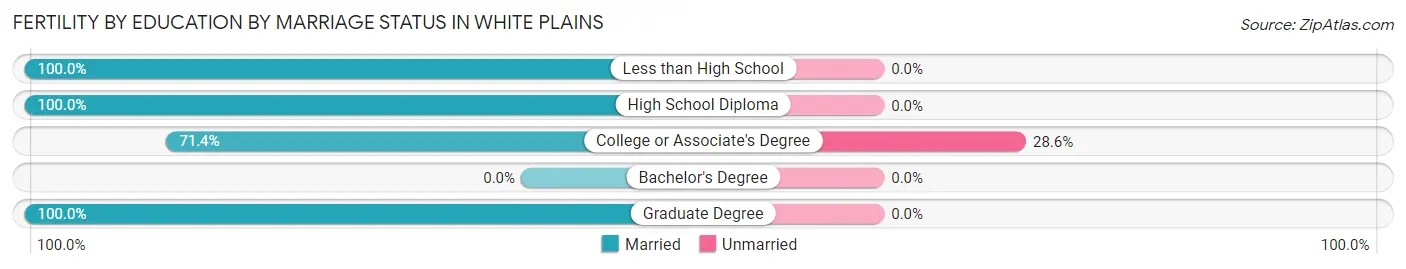
| Educational Attainment | Married | Unmarried |
| Less than High School | 4 (100.0%) | 0 (0.0%) |
| High School Diploma | 10 (100.0%) | 0 (0.0%) |
| College or Associate's Degree | 5 (71.4%) | 2 (28.6%) |
| Bachelor's Degree | 0 (0.0%) | 0 (0.0%) |
| Graduate Degree | 2 (100.0%) | 0 (0.0%) |
| Total | 21 (91.3%) | 2 (8.7%) |
Employment Characteristics in White Plains
Employment by Class of Employer in White Plains
Among the 351 employed individuals in White Plains, private company employees (196 | 55.8%), not-for-profit organizations (52 | 14.8%), and local government employees (50 | 14.2%) make up the most common classes of employment.
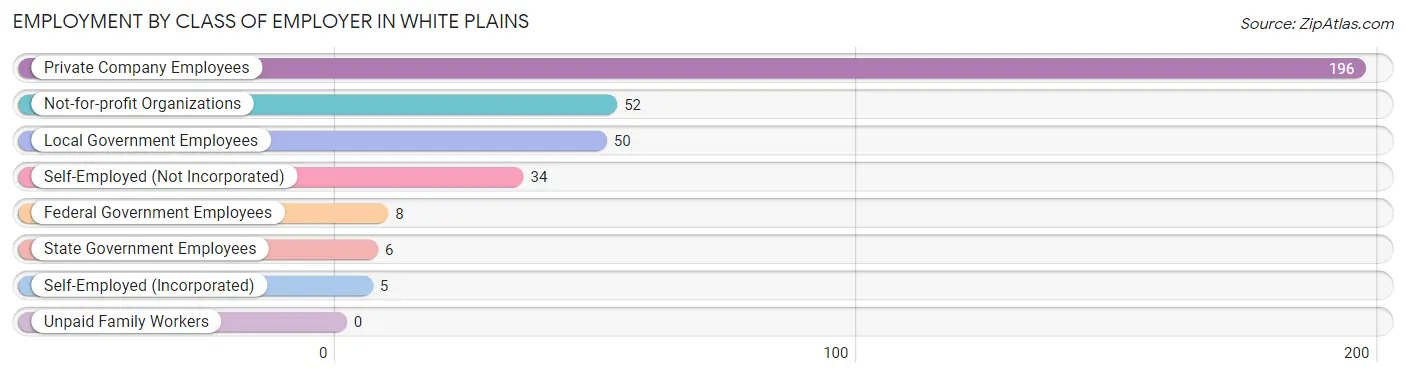
| Employer Class | # Employees | % Employees |
| Private Company Employees | 196 | 55.8% |
| Self-Employed (Incorporated) | 5 | 1.4% |
| Self-Employed (Not Incorporated) | 34 | 9.7% |
| Not-for-profit Organizations | 52 | 14.8% |
| Local Government Employees | 50 | 14.2% |
| State Government Employees | 6 | 1.7% |
| Federal Government Employees | 8 | 2.3% |
| Unpaid Family Workers | 0 | 0.0% |
| Total | 351 | 100.0% |
Employment Status by Age in White Plains
According to the labor force statistics for White Plains, out of the total population over 16 years of age (804), 46.6% or 375 individuals are in the labor force, with 3.2% or 12 of them unemployed. The age group with the highest labor force participation rate is 30 to 34 years, with 98.1% or 51 individuals in the labor force. Within the labor force, the 16 to 19 years age range has the highest percentage of unemployed individuals, with 12.5% or 2 of them being unemployed.
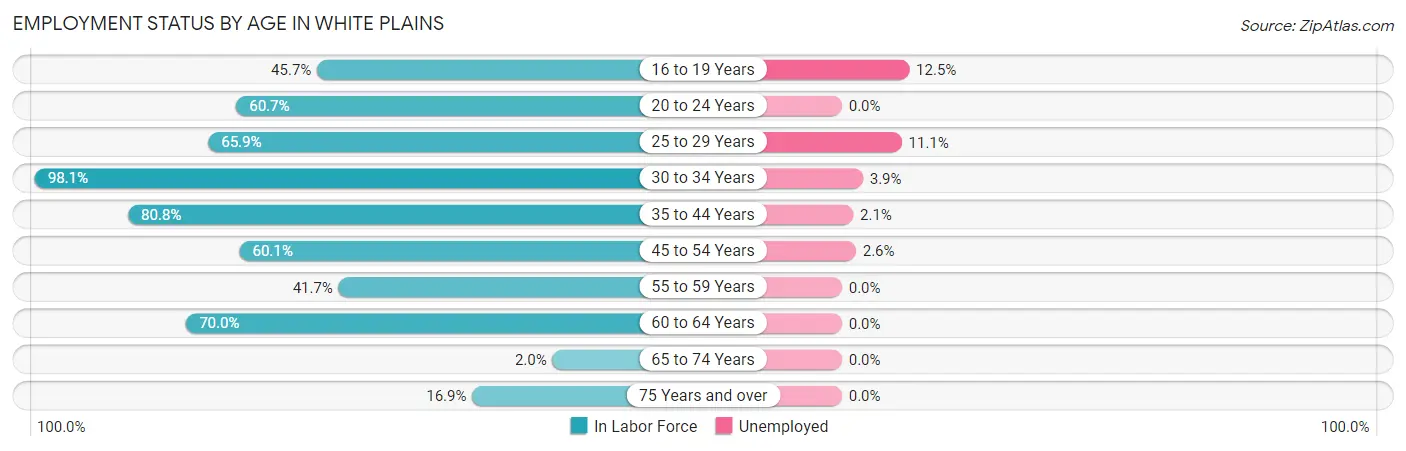
| Age Bracket | In Labor Force | Unemployed |
| 16 to 19 Years | 16 (45.7%) | 2 (12.5%) |
| 20 to 24 Years | 17 (60.7%) | 0 (0.0%) |
| 25 to 29 Years | 27 (65.9%) | 3 (11.1%) |
| 30 to 34 Years | 51 (98.1%) | 2 (3.9%) |
| 35 to 44 Years | 97 (80.8%) | 2 (2.1%) |
| 45 to 54 Years | 116 (60.1%) | 3 (2.6%) |
| 55 to 59 Years | 15 (41.7%) | 0 (0.0%) |
| 60 to 64 Years | 21 (70.0%) | 0 (0.0%) |
| 65 to 74 Years | 4 (2.0%) | 0 (0.0%) |
| 75 Years and over | 11 (16.9%) | 0 (0.0%) |
| Total | 375 (46.6%) | 12 (3.2%) |
Employment Status by Educational Attainment in White Plains
According to labor force statistics for White Plains, 69.3% of individuals (327) out of the total population between 25 and 64 years of age (472) are in the labor force, with 3.1% or 10 of them being unemployed. The group with the highest labor force participation rate are those with the educational attainment of college / associate degree, with 89.9% or 143 individuals in the labor force. Within the labor force, individuals with less than high school education have the highest percentage of unemployment, with 8.6% or 3 of them being unemployed.
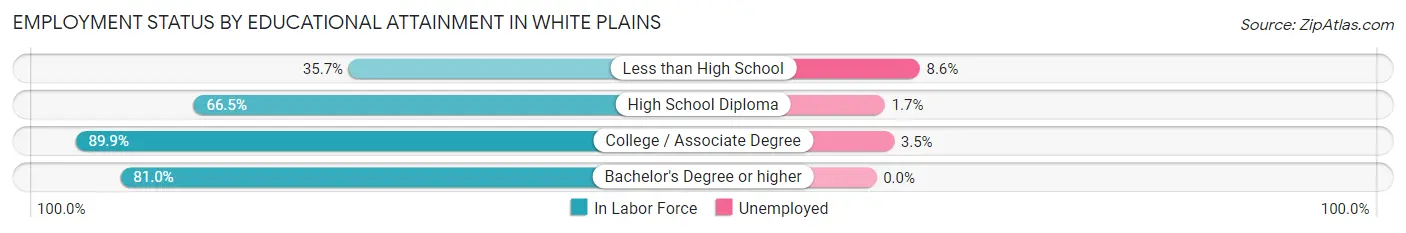
| Educational Attainment | In Labor Force | Unemployed |
| Less than High School | 35 (35.7%) | 8 (8.6%) |
| High School Diploma | 115 (66.5%) | 3 (1.7%) |
| College / Associate Degree | 143 (89.9%) | 6 (3.5%) |
| Bachelor's Degree or higher | 34 (81.0%) | 0 (0.0%) |
| Total | 327 (69.3%) | 15 (3.1%) |
Employment Occupations by Sex in White Plains
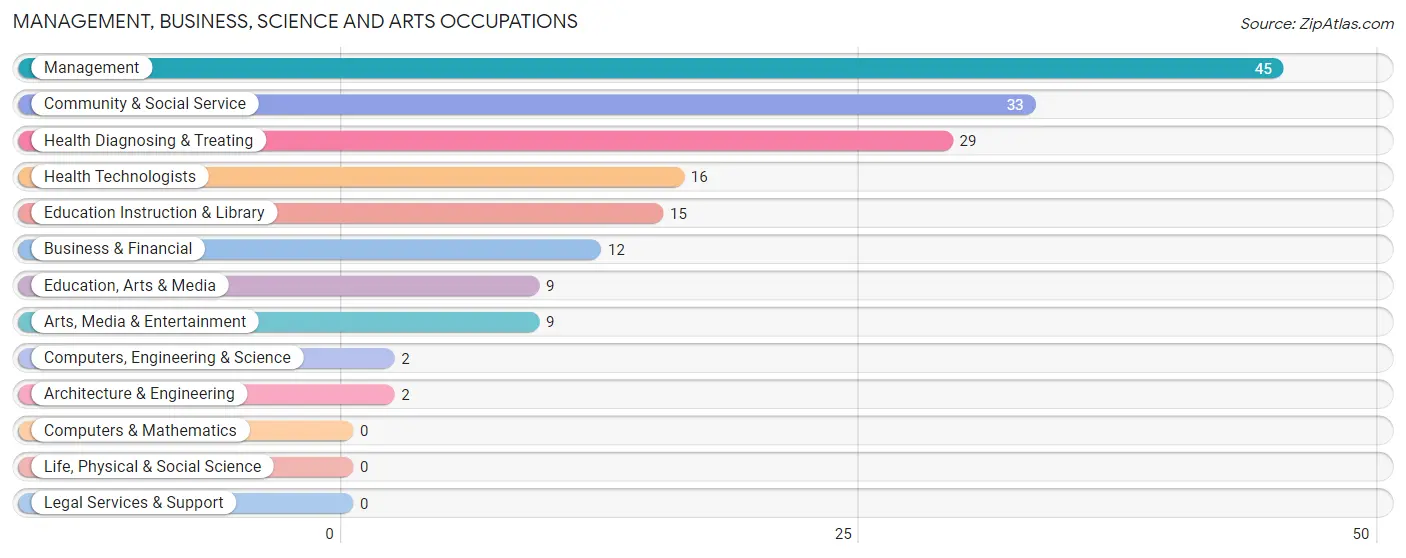
Management, Business, Science and Arts Occupations
The most common Management, Business, Science and Arts occupations in White Plains are Management (45 | 12.4%), Community & Social Service (33 | 9.1%), Health Diagnosing & Treating (29 | 8.0%), Health Technologists (16 | 4.4%), and Education Instruction & Library (15 | 4.1%).
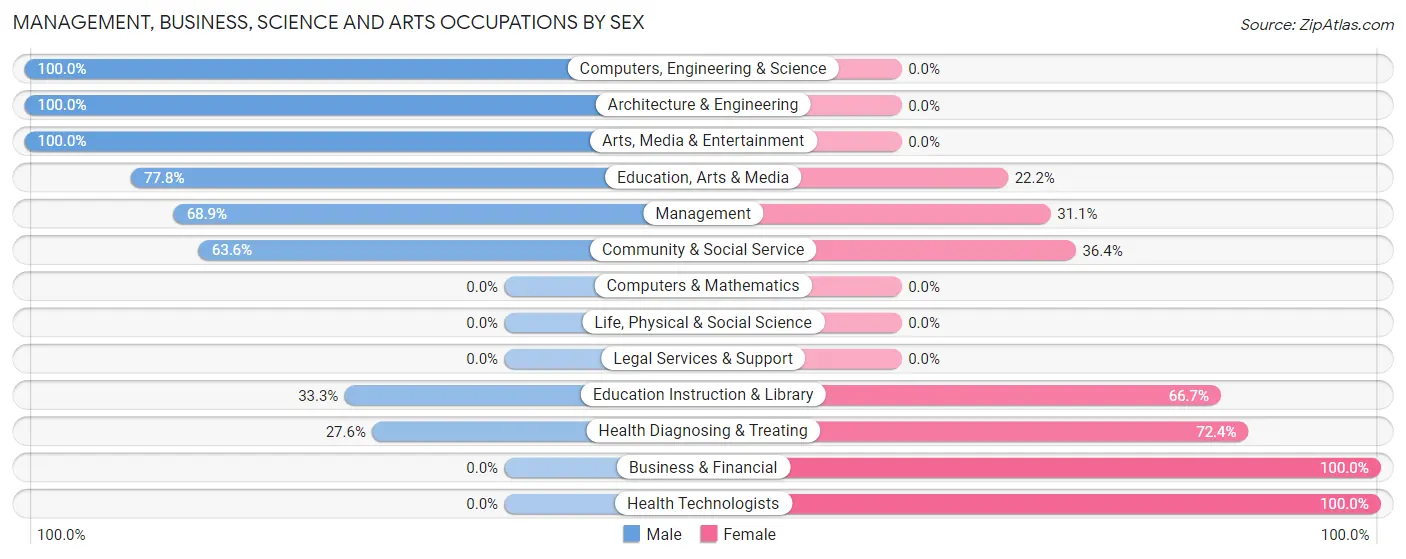
Management, Business, Science and Arts Occupations by Sex
Within the Management, Business, Science and Arts occupations in White Plains, the most male-oriented occupations are Computers, Engineering & Science (100.0%), Architecture & Engineering (100.0%), and Arts, Media & Entertainment (100.0%), while the most female-oriented occupations are Business & Financial (100.0%), Health Technologists (100.0%), and Health Diagnosing & Treating (72.4%).
| Occupation | Male | Female |
| Management | 31 (68.9%) | 14 (31.1%) |
| Business & Financial | 0 (0.0%) | 12 (100.0%) |
| Computers, Engineering & Science | 2 (100.0%) | 0 (0.0%) |
| Computers & Mathematics | 0 (0.0%) | 0 (0.0%) |
| Architecture & Engineering | 2 (100.0%) | 0 (0.0%) |
| Life, Physical & Social Science | 0 (0.0%) | 0 (0.0%) |
| Community & Social Service | 21 (63.6%) | 12 (36.4%) |
| Education, Arts & Media | 7 (77.8%) | 2 (22.2%) |
| Legal Services & Support | 0 (0.0%) | 0 (0.0%) |
| Education Instruction & Library | 5 (33.3%) | 10 (66.7%) |
| Arts, Media & Entertainment | 9 (100.0%) | 0 (0.0%) |
| Health Diagnosing & Treating | 8 (27.6%) | 21 (72.4%) |
| Health Technologists | 0 (0.0%) | 16 (100.0%) |
| Total (Category) | 62 (51.2%) | 59 (48.8%) |
| Total (Overall) | 202 (55.6%) | 161 (44.4%) |
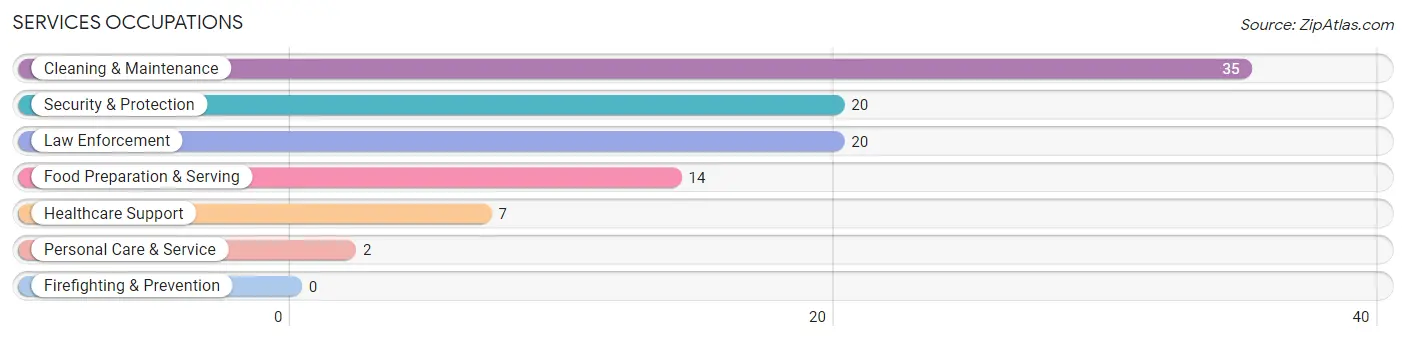
Services Occupations
The most common Services occupations in White Plains are Cleaning & Maintenance (35 | 9.6%), Security & Protection (20 | 5.5%), Law Enforcement (20 | 5.5%), Food Preparation & Serving (14 | 3.9%), and Healthcare Support (7 | 1.9%).
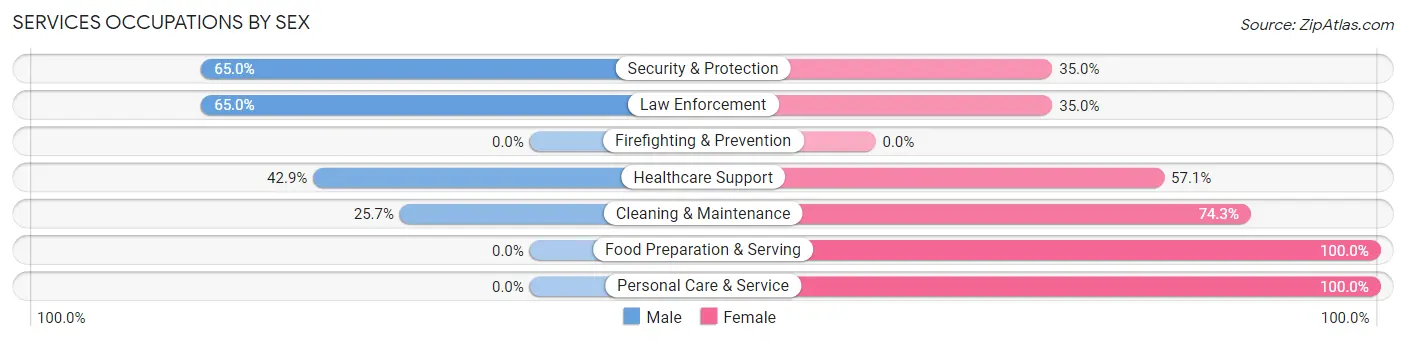
Services Occupations by Sex
Within the Services occupations in White Plains, the most male-oriented occupations are Security & Protection (65.0%), Law Enforcement (65.0%), and Healthcare Support (42.9%), while the most female-oriented occupations are Food Preparation & Serving (100.0%), Personal Care & Service (100.0%), and Cleaning & Maintenance (74.3%).
| Occupation | Male | Female |
| Healthcare Support | 3 (42.9%) | 4 (57.1%) |
| Security & Protection | 13 (65.0%) | 7 (35.0%) |
| Firefighting & Prevention | 0 (0.0%) | 0 (0.0%) |
| Law Enforcement | 13 (65.0%) | 7 (35.0%) |
| Food Preparation & Serving | 0 (0.0%) | 14 (100.0%) |
| Cleaning & Maintenance | 9 (25.7%) | 26 (74.3%) |
| Personal Care & Service | 0 (0.0%) | 2 (100.0%) |
| Total (Category) | 25 (32.1%) | 53 (67.9%) |
| Total (Overall) | 202 (55.6%) | 161 (44.4%) |
Sales and Office Occupations
The most common Sales and Office occupations in White Plains are Office & Administration (26 | 7.2%), and Sales & Related (14 | 3.9%).
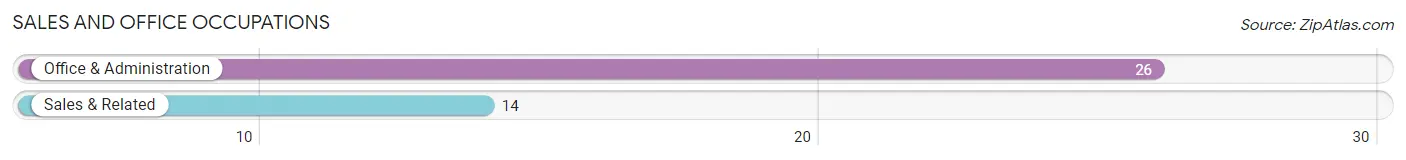
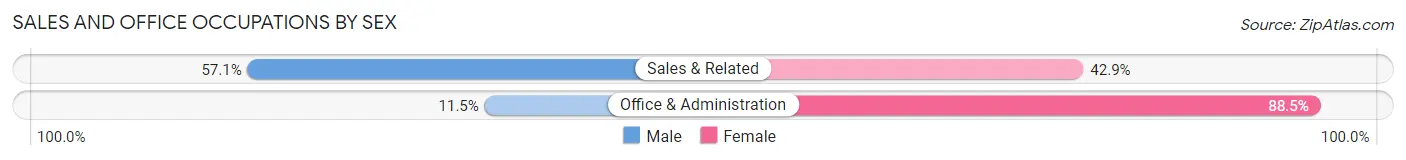
Sales and Office Occupations by Sex
| Occupation | Male | Female |
| Sales & Related | 8 (57.1%) | 6 (42.9%) |
| Office & Administration | 3 (11.5%) | 23 (88.5%) |
| Total (Category) | 11 (27.5%) | 29 (72.5%) |
| Total (Overall) | 202 (55.6%) | 161 (44.4%) |
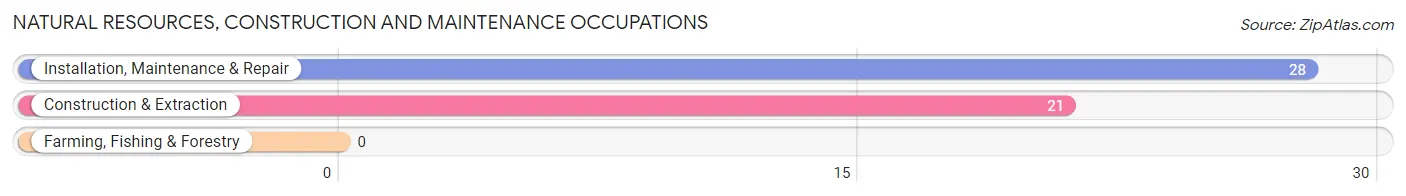
Natural Resources, Construction and Maintenance Occupations
The most common Natural Resources, Construction and Maintenance occupations in White Plains are Installation, Maintenance & Repair (28 | 7.7%), and Construction & Extraction (21 | 5.8%).
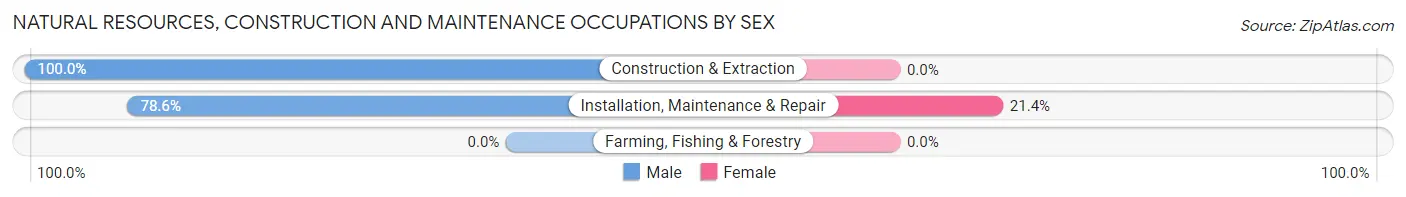
Natural Resources, Construction and Maintenance Occupations by Sex
| Occupation | Male | Female |
| Farming, Fishing & Forestry | 0 (0.0%) | 0 (0.0%) |
| Construction & Extraction | 21 (100.0%) | 0 (0.0%) |
| Installation, Maintenance & Repair | 22 (78.6%) | 6 (21.4%) |
| Total (Category) | 43 (87.8%) | 6 (12.2%) |
| Total (Overall) | 202 (55.6%) | 161 (44.4%) |
Production, Transportation and Moving Occupations
The most common Production, Transportation and Moving occupations in White Plains are Material Moving (30 | 8.3%), Transportation (25 | 6.9%), and Production (20 | 5.5%).
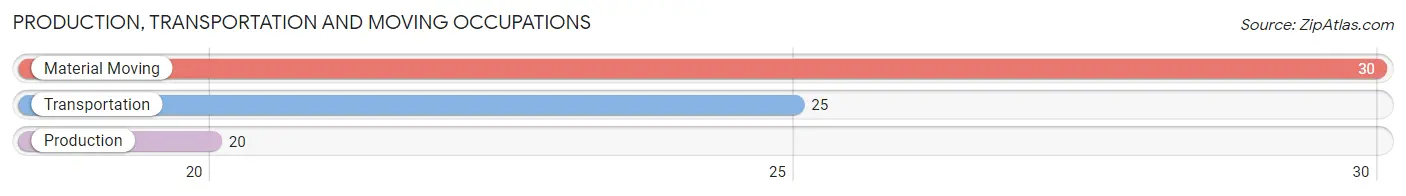
Production, Transportation and Moving Occupations by Sex
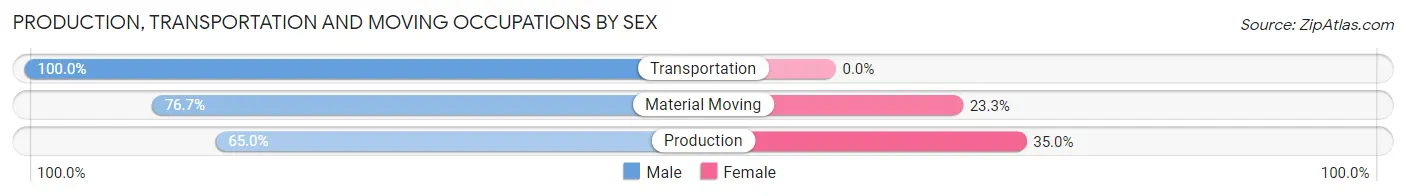
| Occupation | Male | Female |
| Production | 13 (65.0%) | 7 (35.0%) |
| Transportation | 25 (100.0%) | 0 (0.0%) |
| Material Moving | 23 (76.7%) | 7 (23.3%) |
| Total (Category) | 61 (81.3%) | 14 (18.7%) |
| Total (Overall) | 202 (55.6%) | 161 (44.4%) |
Employment Industries by Sex in White Plains
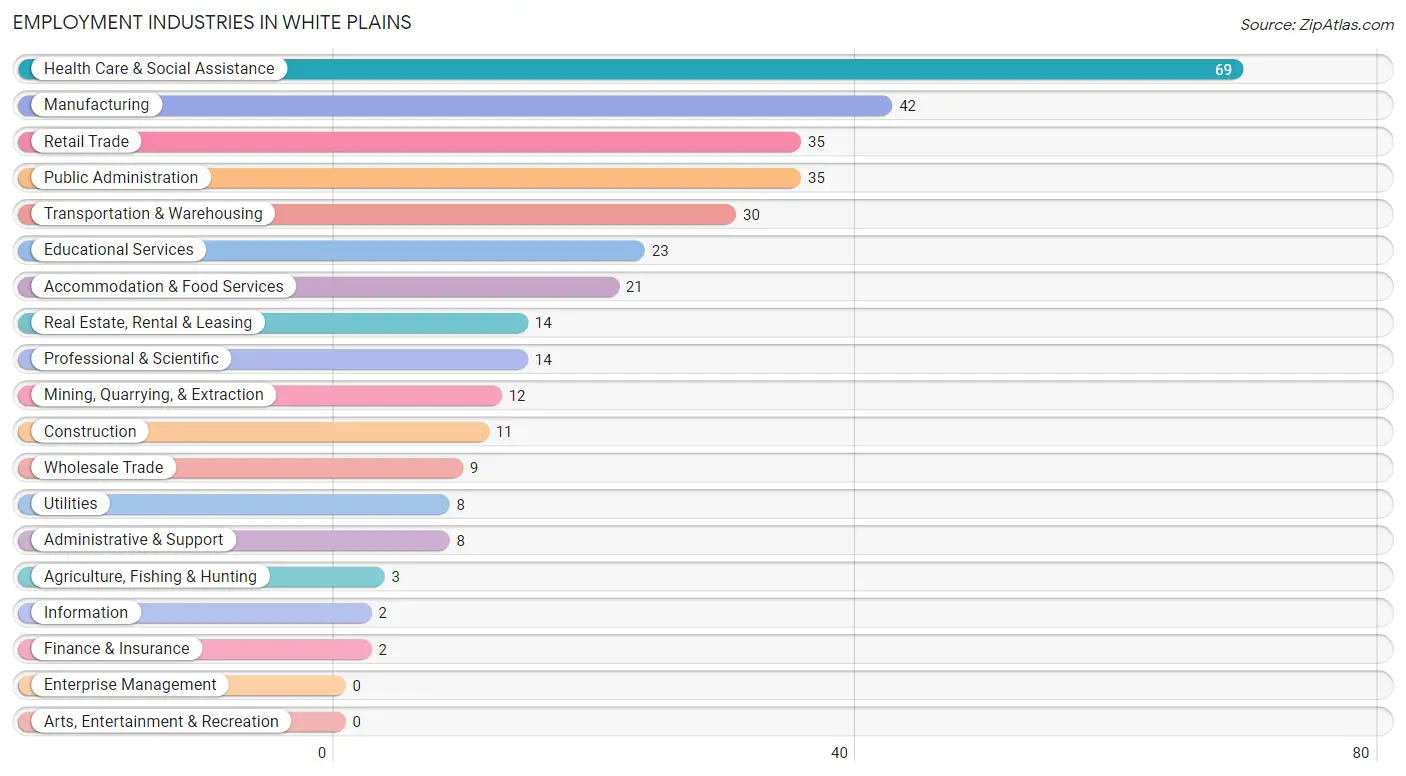
Employment Industries in White Plains
The major employment industries in White Plains include Health Care & Social Assistance (69 | 19.0%), Manufacturing (42 | 11.6%), Retail Trade (35 | 9.6%), Public Administration (35 | 9.6%), and Transportation & Warehousing (30 | 8.3%).
Employment Industries by Sex in White Plains
The White Plains industries that see more men than women are Agriculture, Fishing & Hunting (100.0%), Mining, Quarrying, & Extraction (100.0%), and Construction (100.0%), whereas the industries that tend to have a higher number of women are Finance & Insurance (100.0%), Administrative & Support (100.0%), and Accommodation & Food Services (100.0%).
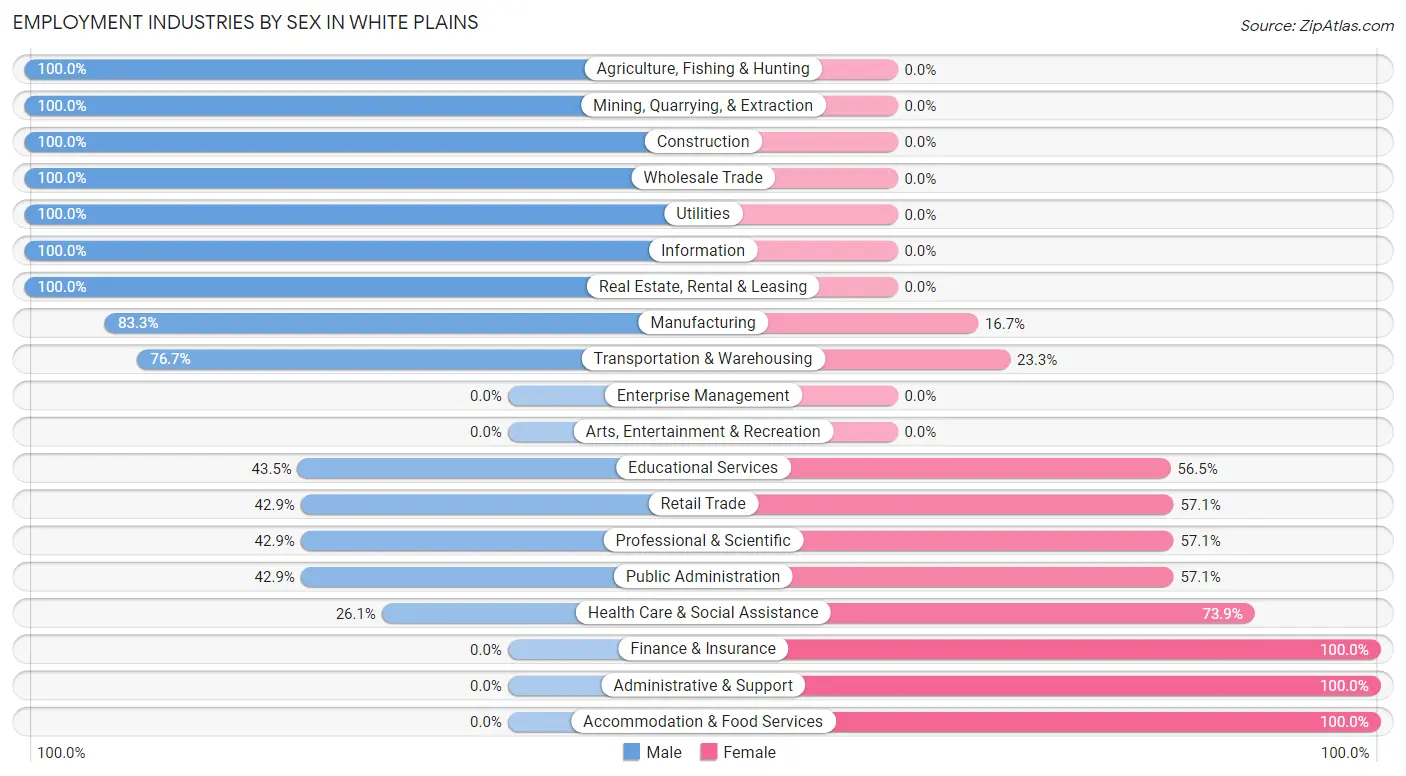
| Industry | Male | Female |
| Agriculture, Fishing & Hunting | 3 (100.0%) | 0 (0.0%) |
| Mining, Quarrying, & Extraction | 12 (100.0%) | 0 (0.0%) |
| Construction | 11 (100.0%) | 0 (0.0%) |
| Manufacturing | 35 (83.3%) | 7 (16.7%) |
| Wholesale Trade | 9 (100.0%) | 0 (0.0%) |
| Retail Trade | 15 (42.9%) | 20 (57.1%) |
| Transportation & Warehousing | 23 (76.7%) | 7 (23.3%) |
| Utilities | 8 (100.0%) | 0 (0.0%) |
| Information | 2 (100.0%) | 0 (0.0%) |
| Finance & Insurance | 0 (0.0%) | 2 (100.0%) |
| Real Estate, Rental & Leasing | 14 (100.0%) | 0 (0.0%) |
| Professional & Scientific | 6 (42.9%) | 8 (57.1%) |
| Enterprise Management | 0 (0.0%) | 0 (0.0%) |
| Administrative & Support | 0 (0.0%) | 8 (100.0%) |
| Educational Services | 10 (43.5%) | 13 (56.5%) |
| Health Care & Social Assistance | 18 (26.1%) | 51 (73.9%) |
| Arts, Entertainment & Recreation | 0 (0.0%) | 0 (0.0%) |
| Accommodation & Food Services | 0 (0.0%) | 21 (100.0%) |
| Public Administration | 15 (42.9%) | 20 (57.1%) |
| Total | 202 (55.6%) | 161 (44.4%) |
Education in White Plains
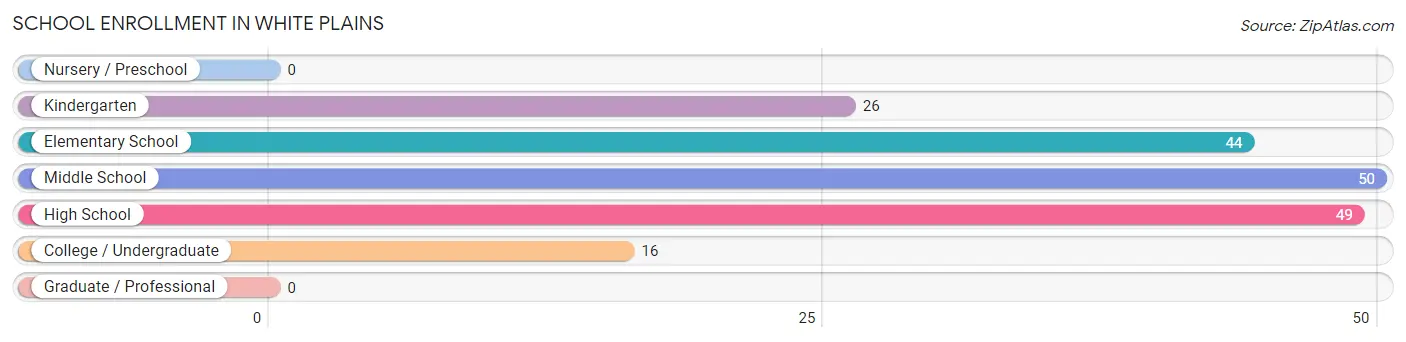
School Enrollment in White Plains
The most common levels of schooling among the 185 students in White Plains are middle school (50 | 27.0%), high school (49 | 26.5%), and elementary school (44 | 23.8%).
| School Level | # Students | % Students |
| Nursery / Preschool | 0 | 0.0% |
| Kindergarten | 26 | 14.1% |
| Elementary School | 44 | 23.8% |
| Middle School | 50 | 27.0% |
| High School | 49 | 26.5% |
| College / Undergraduate | 16 | 8.6% |
| Graduate / Professional | 0 | 0.0% |
| Total | 185 | 100.0% |
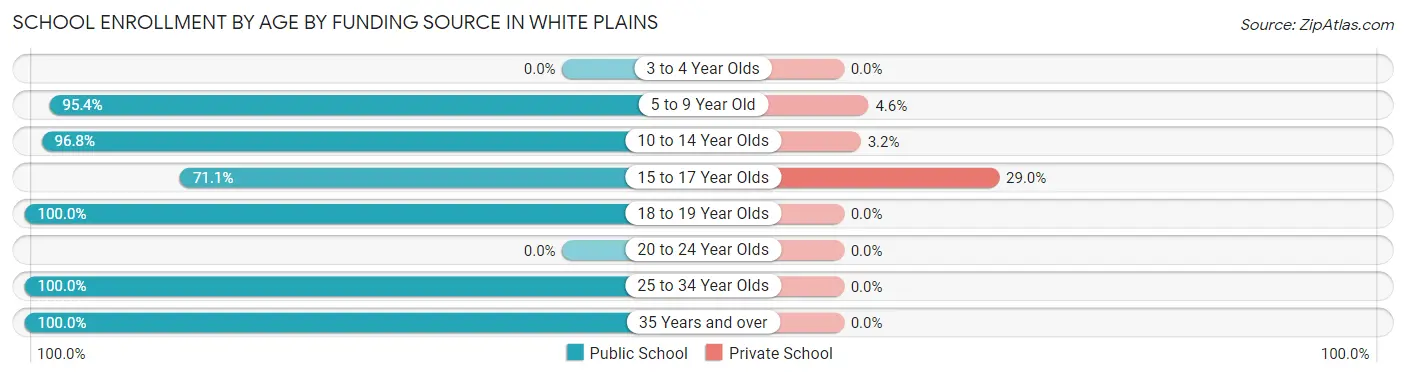
School Enrollment by Age by Funding Source in White Plains
Out of a total of 185 students who are enrolled in schools in White Plains, 16 (8.6%) attend a private institution, while the remaining 169 (91.4%) are enrolled in public schools. The age group of 15 to 17 year olds has the highest likelihood of being enrolled in private schools, with 11 (28.9% in the age bracket) enrolled. Conversely, the age group of 18 to 19 year olds has the lowest likelihood of being enrolled in a private school, with 5 (100.0% in the age bracket) attending a public institution.
| Age Bracket | Public School | Private School |
| 3 to 4 Year Olds | 0 (0.0%) | 0 (0.0%) |
| 5 to 9 Year Old | 62 (95.4%) | 3 (4.6%) |
| 10 to 14 Year Olds | 61 (96.8%) | 2 (3.2%) |
| 15 to 17 Year Olds | 27 (71.1%) | 11 (28.9%) |
| 18 to 19 Year Olds | 5 (100.0%) | 0 (0.0%) |
| 20 to 24 Year Olds | 0 (0.0%) | 0 (0.0%) |
| 25 to 34 Year Olds | 10 (100.0%) | 0 (0.0%) |
| 35 Years and over | 4 (100.0%) | 0 (0.0%) |
| Total | 169 (91.4%) | 16 (8.6%) |
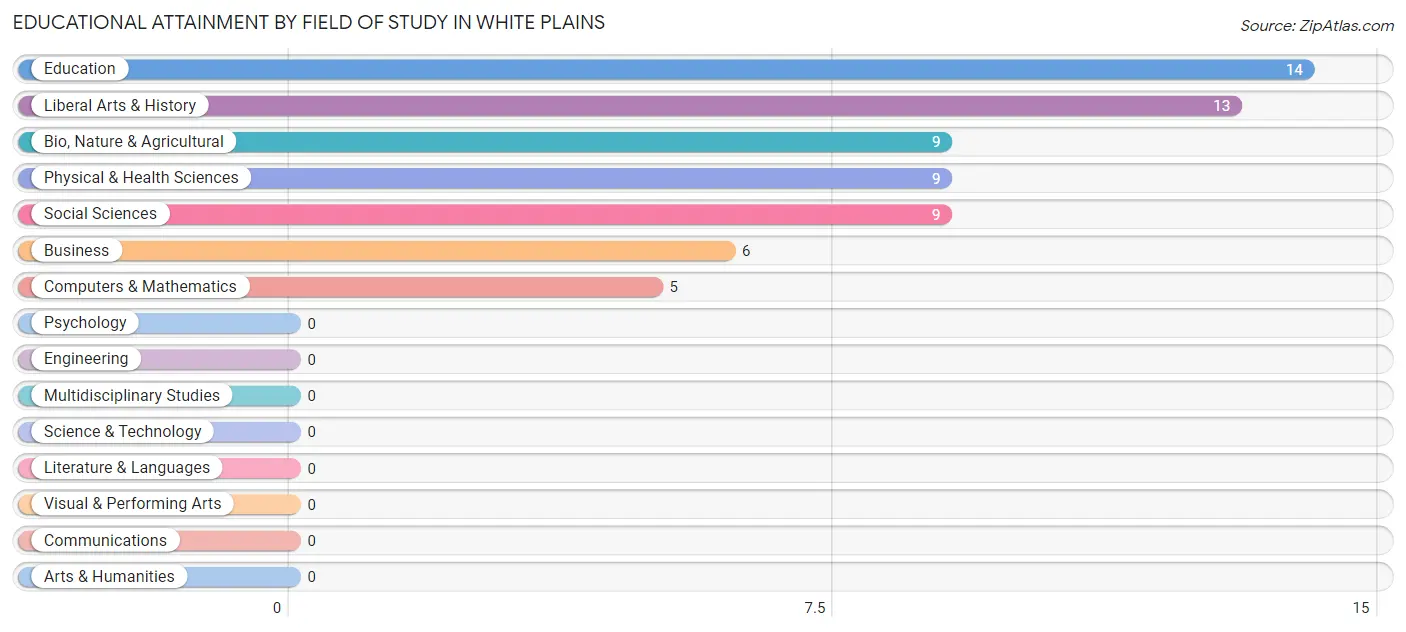
Educational Attainment by Field of Study in White Plains
Education (14 | 21.5%), liberal arts & history (13 | 20.0%), bio, nature & agricultural (9 | 13.9%), physical & health sciences (9 | 13.9%), and social sciences (9 | 13.9%) are the most common fields of study among 65 individuals in White Plains who have obtained a bachelor's degree or higher.
| Field of Study | # Graduates | % Graduates |
| Computers & Mathematics | 5 | 7.7% |
| Bio, Nature & Agricultural | 9 | 13.9% |
| Physical & Health Sciences | 9 | 13.9% |
| Psychology | 0 | 0.0% |
| Social Sciences | 9 | 13.9% |
| Engineering | 0 | 0.0% |
| Multidisciplinary Studies | 0 | 0.0% |
| Science & Technology | 0 | 0.0% |
| Business | 6 | 9.2% |
| Education | 14 | 21.5% |
| Literature & Languages | 0 | 0.0% |
| Liberal Arts & History | 13 | 20.0% |
| Visual & Performing Arts | 0 | 0.0% |
| Communications | 0 | 0.0% |
| Arts & Humanities | 0 | 0.0% |
| Total | 65 | 100.0% |
Transportation & Commute in White Plains
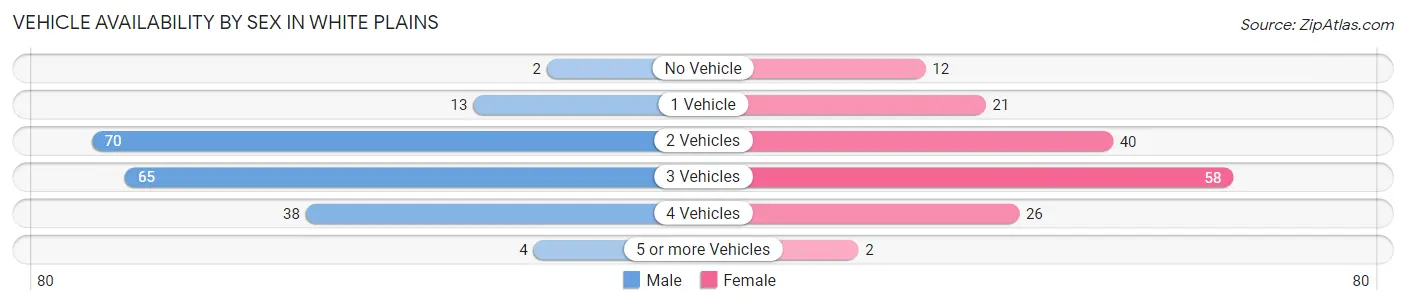
Vehicle Availability by Sex in White Plains
The most prevalent vehicle ownership categories in White Plains are males with 2 vehicles (70, accounting for 36.5%) and females with 2 vehicles (40, making up 44.0%).
| Vehicles Available | Male | Female |
| No Vehicle | 2 (1.0%) | 12 (7.5%) |
| 1 Vehicle | 13 (6.8%) | 21 (13.2%) |
| 2 Vehicles | 70 (36.5%) | 40 (25.2%) |
| 3 Vehicles | 65 (33.9%) | 58 (36.5%) |
| 4 Vehicles | 38 (19.8%) | 26 (16.4%) |
| 5 or more Vehicles | 4 (2.1%) | 2 (1.3%) |
| Total | 192 (100.0%) | 159 (100.0%) |
Commute Time in White Plains
The most frequently occuring commute durations in White Plains are 20 to 24 minutes (84 commuters, 24.1%), 15 to 19 minutes (59 commuters, 17.0%), and 25 to 29 minutes (51 commuters, 14.7%).
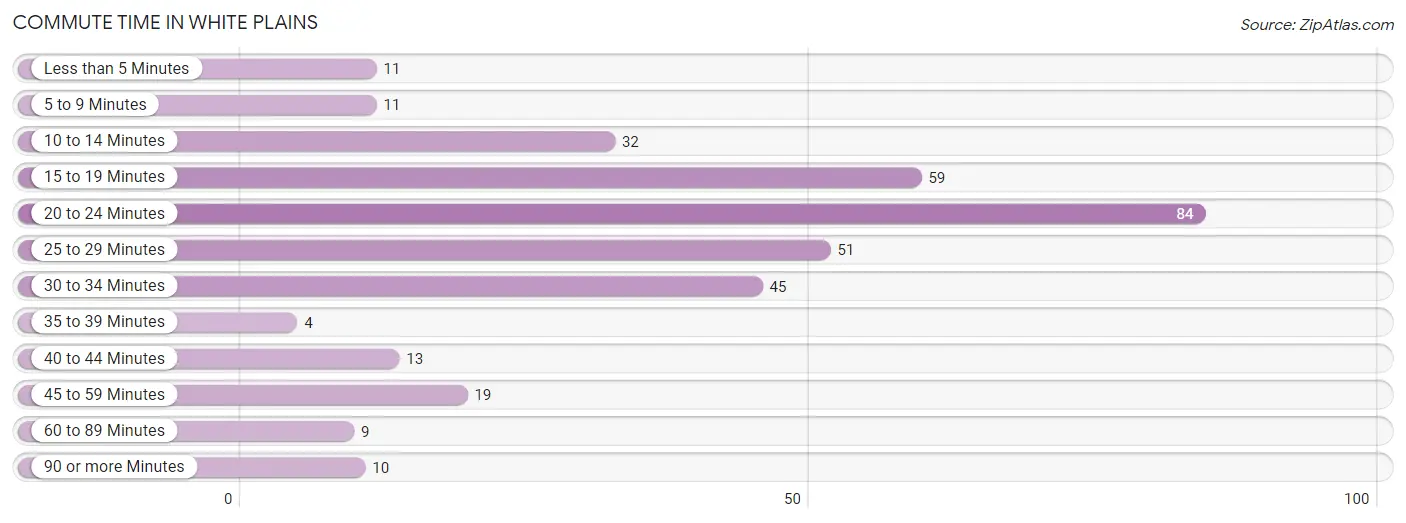
| Commute Time | # Commuters | % Commuters |
| Less than 5 Minutes | 11 | 3.2% |
| 5 to 9 Minutes | 11 | 3.2% |
| 10 to 14 Minutes | 32 | 9.2% |
| 15 to 19 Minutes | 59 | 17.0% |
| 20 to 24 Minutes | 84 | 24.1% |
| 25 to 29 Minutes | 51 | 14.7% |
| 30 to 34 Minutes | 45 | 12.9% |
| 35 to 39 Minutes | 4 | 1.1% |
| 40 to 44 Minutes | 13 | 3.7% |
| 45 to 59 Minutes | 19 | 5.5% |
| 60 to 89 Minutes | 9 | 2.6% |
| 90 or more Minutes | 10 | 2.9% |
Commute Time by Sex in White Plains
The most common commute times in White Plains are 20 to 24 minutes (42 commuters, 22.1%) for males and 20 to 24 minutes (42 commuters, 26.6%) for females.
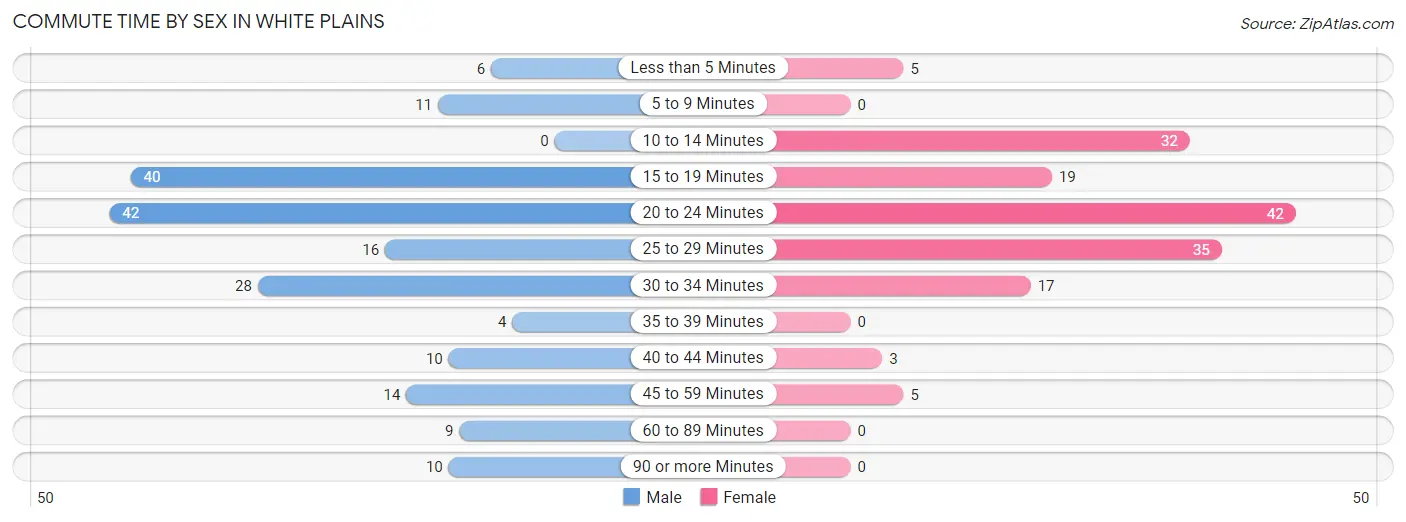
| Commute Time | Male | Female |
| Less than 5 Minutes | 6 (3.2%) | 5 (3.2%) |
| 5 to 9 Minutes | 11 (5.8%) | 0 (0.0%) |
| 10 to 14 Minutes | 0 (0.0%) | 32 (20.3%) |
| 15 to 19 Minutes | 40 (21.0%) | 19 (12.0%) |
| 20 to 24 Minutes | 42 (22.1%) | 42 (26.6%) |
| 25 to 29 Minutes | 16 (8.4%) | 35 (22.2%) |
| 30 to 34 Minutes | 28 (14.7%) | 17 (10.8%) |
| 35 to 39 Minutes | 4 (2.1%) | 0 (0.0%) |
| 40 to 44 Minutes | 10 (5.3%) | 3 (1.9%) |
| 45 to 59 Minutes | 14 (7.4%) | 5 (3.2%) |
| 60 to 89 Minutes | 9 (4.7%) | 0 (0.0%) |
| 90 or more Minutes | 10 (5.3%) | 0 (0.0%) |
Time of Departure to Work by Sex in White Plains
The most frequent times of departure to work in White Plains are 12:00 AM to 4:59 AM (43, 22.6%) for males and 6:00 AM to 6:29 AM (32, 20.3%) for females.
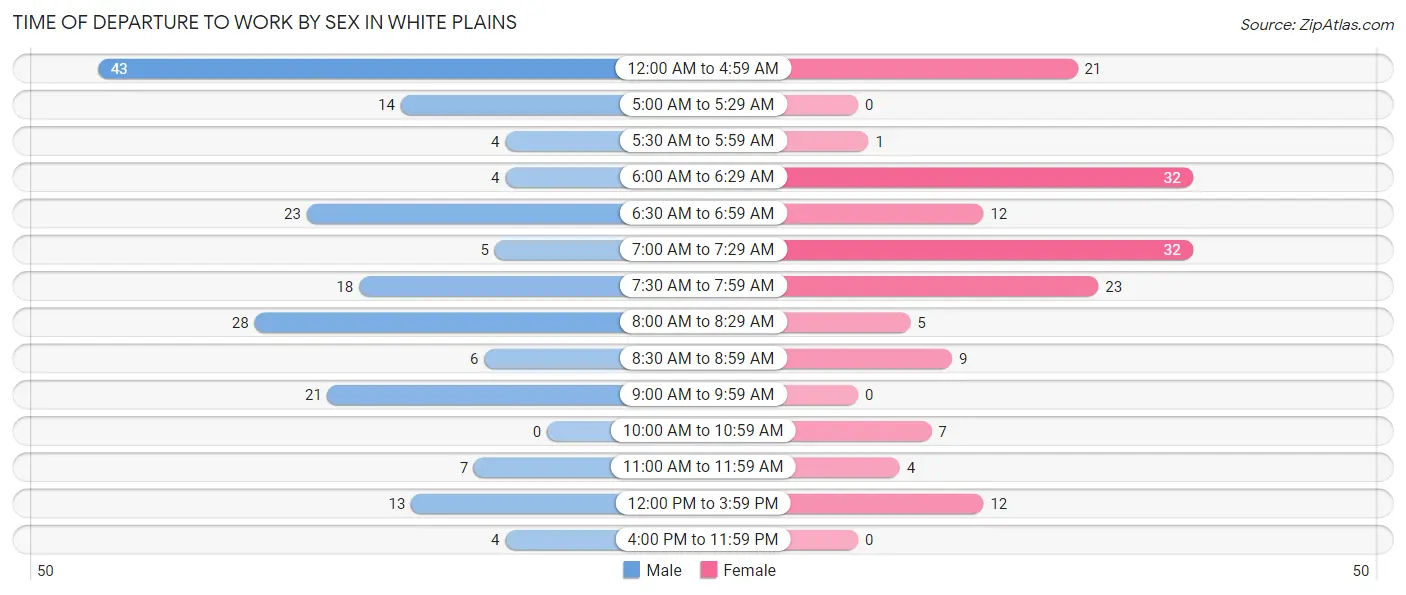
| Time of Departure | Male | Female |
| 12:00 AM to 4:59 AM | 43 (22.6%) | 21 (13.3%) |
| 5:00 AM to 5:29 AM | 14 (7.4%) | 0 (0.0%) |
| 5:30 AM to 5:59 AM | 4 (2.1%) | 1 (0.6%) |
| 6:00 AM to 6:29 AM | 4 (2.1%) | 32 (20.3%) |
| 6:30 AM to 6:59 AM | 23 (12.1%) | 12 (7.6%) |
| 7:00 AM to 7:29 AM | 5 (2.6%) | 32 (20.3%) |
| 7:30 AM to 7:59 AM | 18 (9.5%) | 23 (14.6%) |
| 8:00 AM to 8:29 AM | 28 (14.7%) | 5 (3.2%) |
| 8:30 AM to 8:59 AM | 6 (3.2%) | 9 (5.7%) |
| 9:00 AM to 9:59 AM | 21 (11.1%) | 0 (0.0%) |
| 10:00 AM to 10:59 AM | 0 (0.0%) | 7 (4.4%) |
| 11:00 AM to 11:59 AM | 7 (3.7%) | 4 (2.5%) |
| 12:00 PM to 3:59 PM | 13 (6.8%) | 12 (7.6%) |
| 4:00 PM to 11:59 PM | 4 (2.1%) | 0 (0.0%) |
| Total | 190 (100.0%) | 158 (100.0%) |
Housing Occupancy in White Plains
Occupancy by Ownership in White Plains
Of the total 453 dwellings in White Plains, owner-occupied units account for 400 (88.3%), while renter-occupied units make up 53 (11.7%).
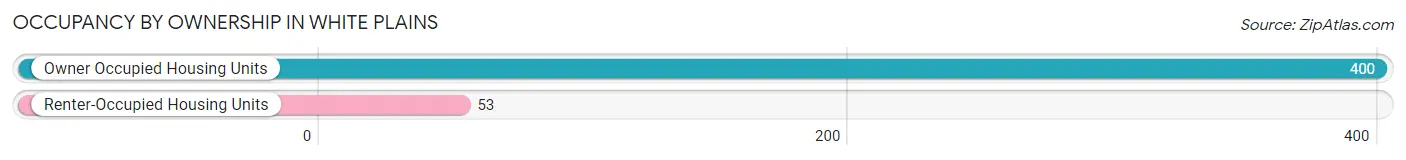
| Occupancy | # Housing Units | % Housing Units |
| Owner Occupied Housing Units | 400 | 88.3% |
| Renter-Occupied Housing Units | 53 | 11.7% |
| Total Occupied Housing Units | 453 | 100.0% |
Occupancy by Household Size in White Plains
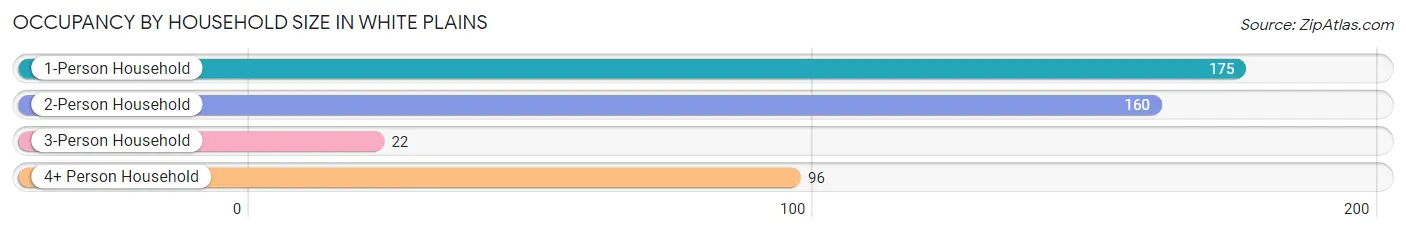
| Household Size | # Housing Units | % Housing Units |
| 1-Person Household | 175 | 38.6% |
| 2-Person Household | 160 | 35.3% |
| 3-Person Household | 22 | 4.9% |
| 4+ Person Household | 96 | 21.2% |
| Total Housing Units | 453 | 100.0% |
Occupancy by Ownership by Household Size in White Plains
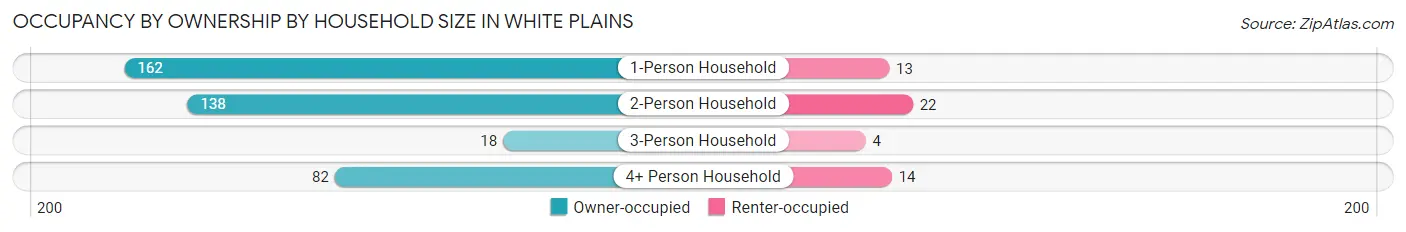
| Household Size | Owner-occupied | Renter-occupied |
| 1-Person Household | 162 (92.6%) | 13 (7.4%) |
| 2-Person Household | 138 (86.3%) | 22 (13.8%) |
| 3-Person Household | 18 (81.8%) | 4 (18.2%) |
| 4+ Person Household | 82 (85.4%) | 14 (14.6%) |
| Total Housing Units | 400 (88.3%) | 53 (11.7%) |
Occupancy by Educational Attainment in White Plains
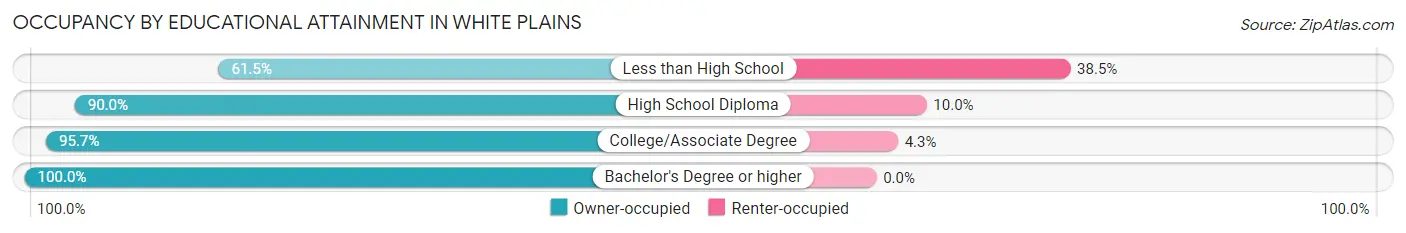
| Household Size | Owner-occupied | Renter-occupied |
| Less than High School | 40 (61.5%) | 25 (38.5%) |
| High School Diploma | 208 (90.0%) | 23 (10.0%) |
| College/Associate Degree | 112 (95.7%) | 5 (4.3%) |
| Bachelor's Degree or higher | 40 (100.0%) | 0 (0.0%) |
Occupancy by Age of Householder in White Plains
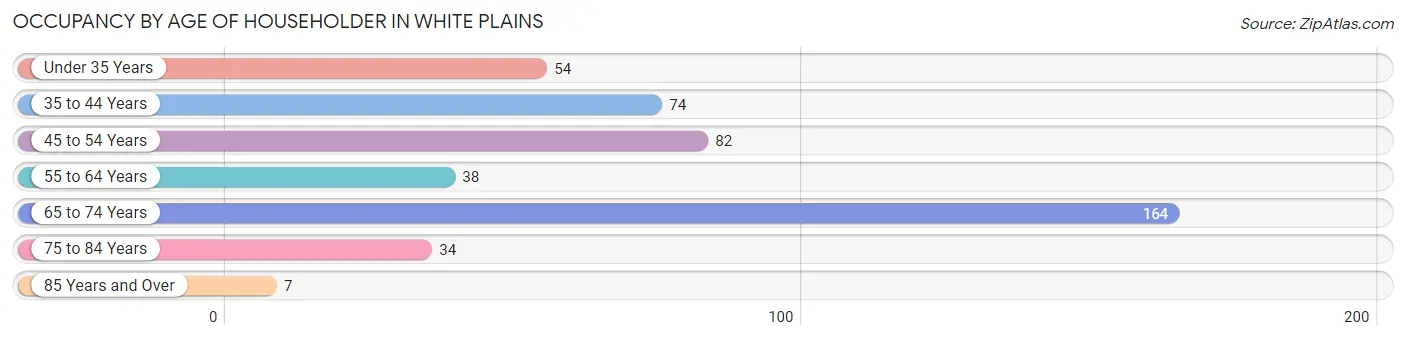
| Age Bracket | # Households | % Households |
| Under 35 Years | 54 | 11.9% |
| 35 to 44 Years | 74 | 16.3% |
| 45 to 54 Years | 82 | 18.1% |
| 55 to 64 Years | 38 | 8.4% |
| 65 to 74 Years | 164 | 36.2% |
| 75 to 84 Years | 34 | 7.5% |
| 85 Years and Over | 7 | 1.5% |
| Total | 453 | 100.0% |
Housing Finances in White Plains
Median Income by Occupancy in White Plains
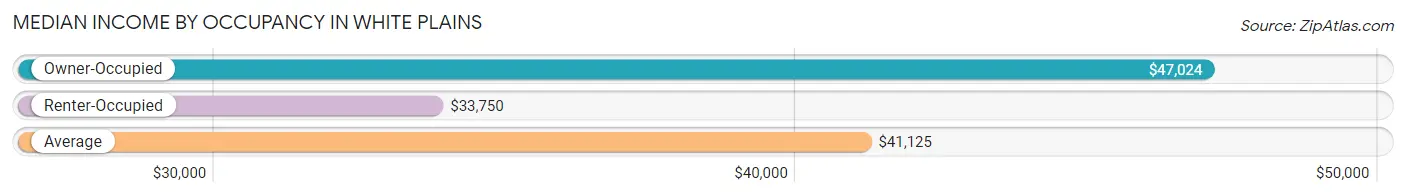
| Occupancy Type | # Households | Median Income |
| Owner-Occupied | 400 (88.3%) | $47,024 |
| Renter-Occupied | 53 (11.7%) | $33,750 |
| Average | 453 (100.0%) | $41,125 |
Occupancy by Householder Income Bracket in White Plains
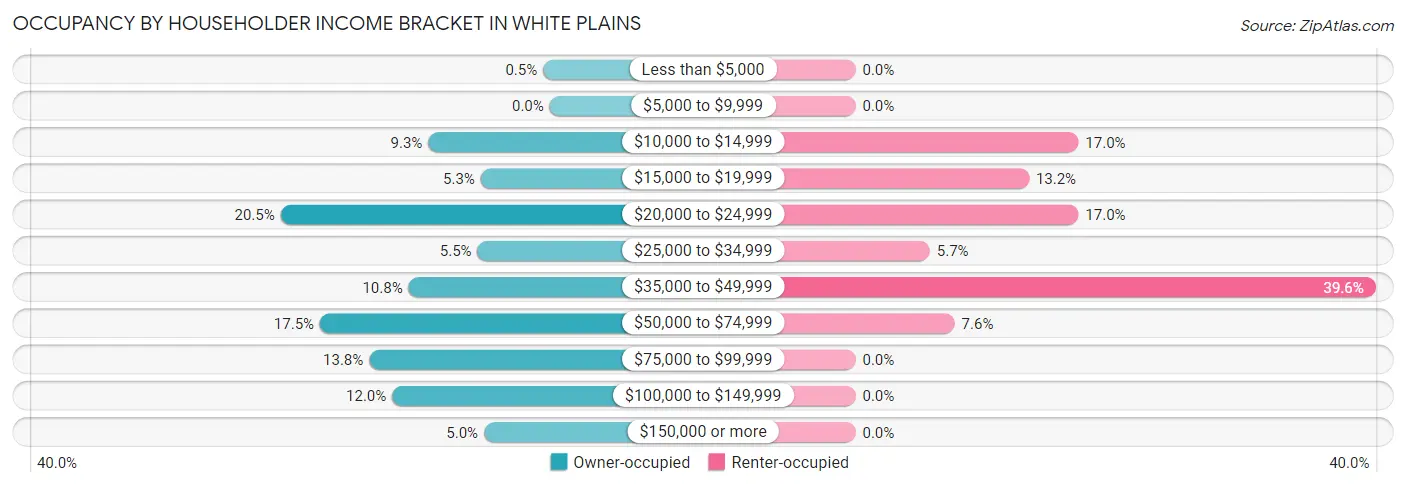
| Income Bracket | Owner-occupied | Renter-occupied |
| Less than $5,000 | 2 (0.5%) | 0 (0.0%) |
| $5,000 to $9,999 | 0 (0.0%) | 0 (0.0%) |
| $10,000 to $14,999 | 37 (9.2%) | 9 (17.0%) |
| $15,000 to $19,999 | 21 (5.2%) | 7 (13.2%) |
| $20,000 to $24,999 | 82 (20.5%) | 9 (17.0%) |
| $25,000 to $34,999 | 22 (5.5%) | 3 (5.7%) |
| $35,000 to $49,999 | 43 (10.7%) | 21 (39.6%) |
| $50,000 to $74,999 | 70 (17.5%) | 4 (7.5%) |
| $75,000 to $99,999 | 55 (13.8%) | 0 (0.0%) |
| $100,000 to $149,999 | 48 (12.0%) | 0 (0.0%) |
| $150,000 or more | 20 (5.0%) | 0 (0.0%) |
| Total | 400 (100.0%) | 53 (100.0%) |
Monthly Housing Cost Tiers in White Plains
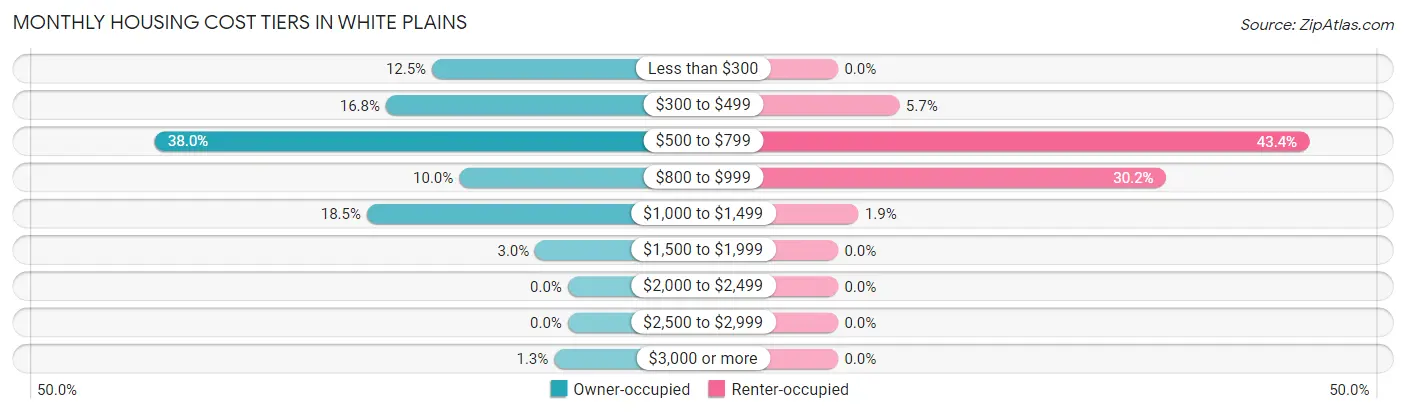
| Monthly Cost | Owner-occupied | Renter-occupied |
| Less than $300 | 50 (12.5%) | 0 (0.0%) |
| $300 to $499 | 67 (16.8%) | 3 (5.7%) |
| $500 to $799 | 152 (38.0%) | 23 (43.4%) |
| $800 to $999 | 40 (10.0%) | 16 (30.2%) |
| $1,000 to $1,499 | 74 (18.5%) | 1 (1.9%) |
| $1,500 to $1,999 | 12 (3.0%) | 0 (0.0%) |
| $2,000 to $2,499 | 0 (0.0%) | 0 (0.0%) |
| $2,500 to $2,999 | 0 (0.0%) | 0 (0.0%) |
| $3,000 or more | 5 (1.3%) | 0 (0.0%) |
| Total | 400 (100.0%) | 53 (100.0%) |
Physical Housing Characteristics in White Plains
Housing Structures in White Plains
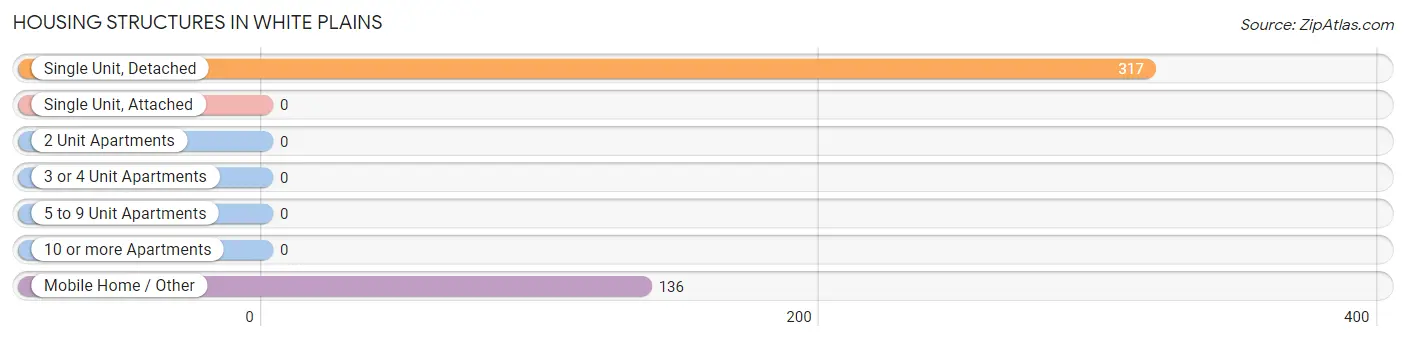
| Structure Type | # Housing Units | % Housing Units |
| Single Unit, Detached | 317 | 70.0% |
| Single Unit, Attached | 0 | 0.0% |
| 2 Unit Apartments | 0 | 0.0% |
| 3 or 4 Unit Apartments | 0 | 0.0% |
| 5 to 9 Unit Apartments | 0 | 0.0% |
| 10 or more Apartments | 0 | 0.0% |
| Mobile Home / Other | 136 | 30.0% |
| Total | 453 | 100.0% |
Housing Structures by Occupancy in White Plains
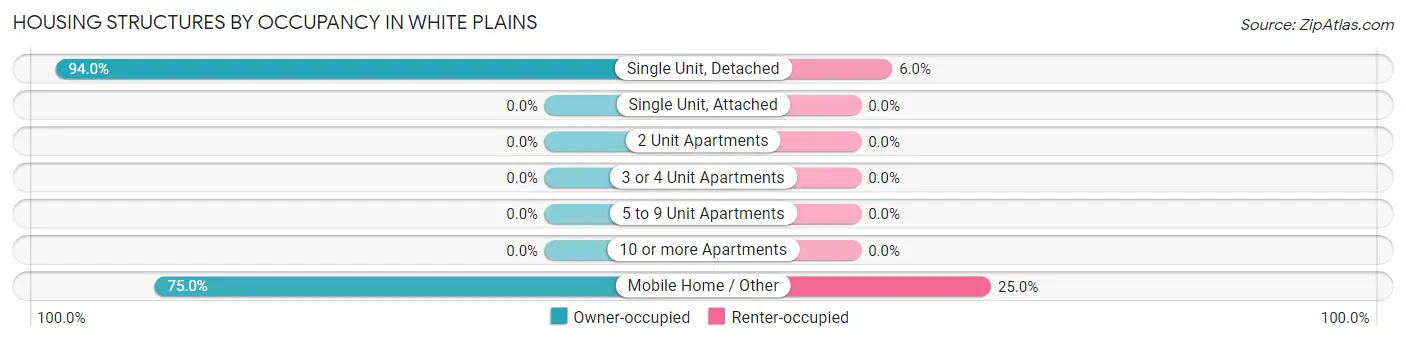
| Structure Type | Owner-occupied | Renter-occupied |
| Single Unit, Detached | 298 (94.0%) | 19 (6.0%) |
| Single Unit, Attached | 0 (0.0%) | 0 (0.0%) |
| 2 Unit Apartments | 0 (0.0%) | 0 (0.0%) |
| 3 or 4 Unit Apartments | 0 (0.0%) | 0 (0.0%) |
| 5 to 9 Unit Apartments | 0 (0.0%) | 0 (0.0%) |
| 10 or more Apartments | 0 (0.0%) | 0 (0.0%) |
| Mobile Home / Other | 102 (75.0%) | 34 (25.0%) |
| Total | 400 (88.3%) | 53 (11.7%) |
Housing Structures by Number of Rooms in White Plains
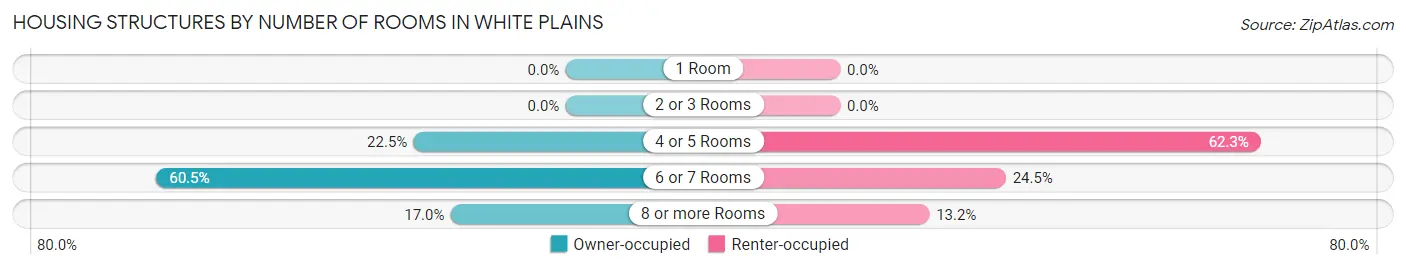
| Number of Rooms | Owner-occupied | Renter-occupied |
| 1 Room | 0 (0.0%) | 0 (0.0%) |
| 2 or 3 Rooms | 0 (0.0%) | 0 (0.0%) |
| 4 or 5 Rooms | 90 (22.5%) | 33 (62.3%) |
| 6 or 7 Rooms | 242 (60.5%) | 13 (24.5%) |
| 8 or more Rooms | 68 (17.0%) | 7 (13.2%) |
| Total | 400 (100.0%) | 53 (100.0%) |
Housing Structure by Heating Type in White Plains
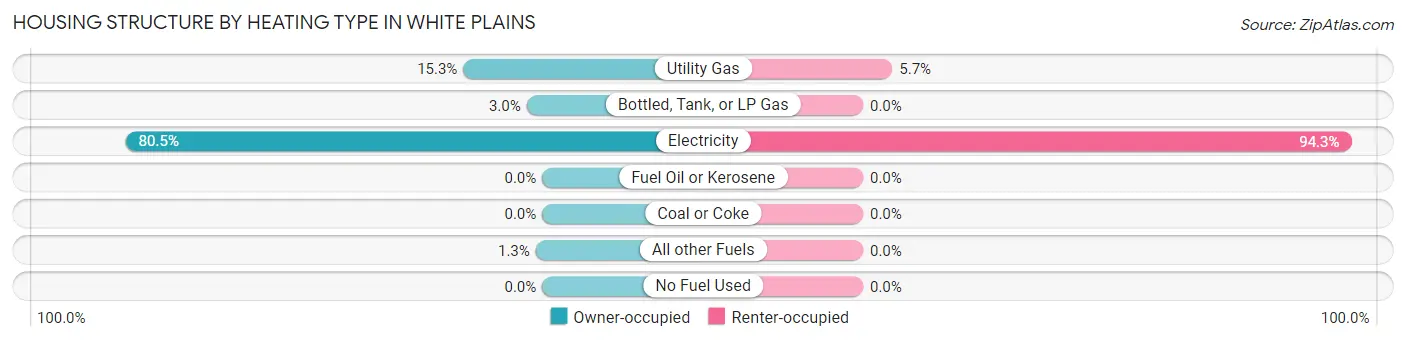
| Heating Type | Owner-occupied | Renter-occupied |
| Utility Gas | 61 (15.2%) | 3 (5.7%) |
| Bottled, Tank, or LP Gas | 12 (3.0%) | 0 (0.0%) |
| Electricity | 322 (80.5%) | 50 (94.3%) |
| Fuel Oil or Kerosene | 0 (0.0%) | 0 (0.0%) |
| Coal or Coke | 0 (0.0%) | 0 (0.0%) |
| All other Fuels | 5 (1.3%) | 0 (0.0%) |
| No Fuel Used | 0 (0.0%) | 0 (0.0%) |
| Total | 400 (100.0%) | 53 (100.0%) |
Household Vehicle Usage in White Plains
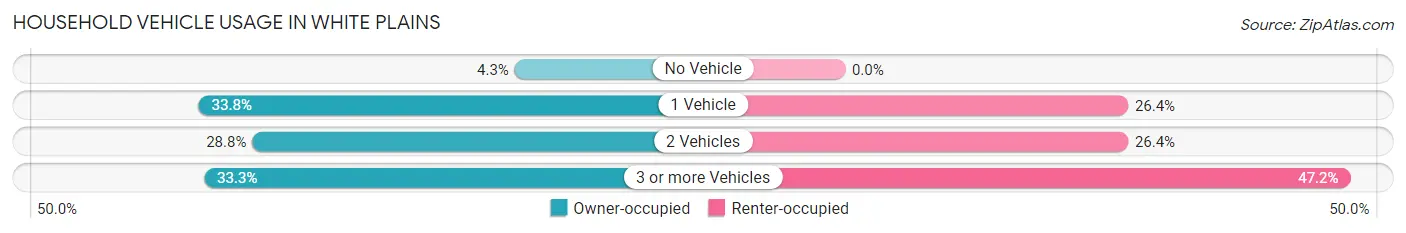
| Vehicles per Household | Owner-occupied | Renter-occupied |
| No Vehicle | 17 (4.3%) | 0 (0.0%) |
| 1 Vehicle | 135 (33.8%) | 14 (26.4%) |
| 2 Vehicles | 115 (28.7%) | 14 (26.4%) |
| 3 or more Vehicles | 133 (33.3%) | 25 (47.2%) |
| Total | 400 (100.0%) | 53 (100.0%) |
Real Estate & Mortgages in White Plains
Real Estate and Mortgage Overview in White Plains
| Characteristic | Without Mortgage | With Mortgage |
| Housing Units | 182 | 218 |
| Median Property Value | $50,600 | $80,000 |
| Median Household Income | $40,833 | $18 |
| Monthly Housing Costs | $419 | $5 |
| Real Estate Taxes | $650 | $10 |
Property Value by Mortgage Status in White Plains
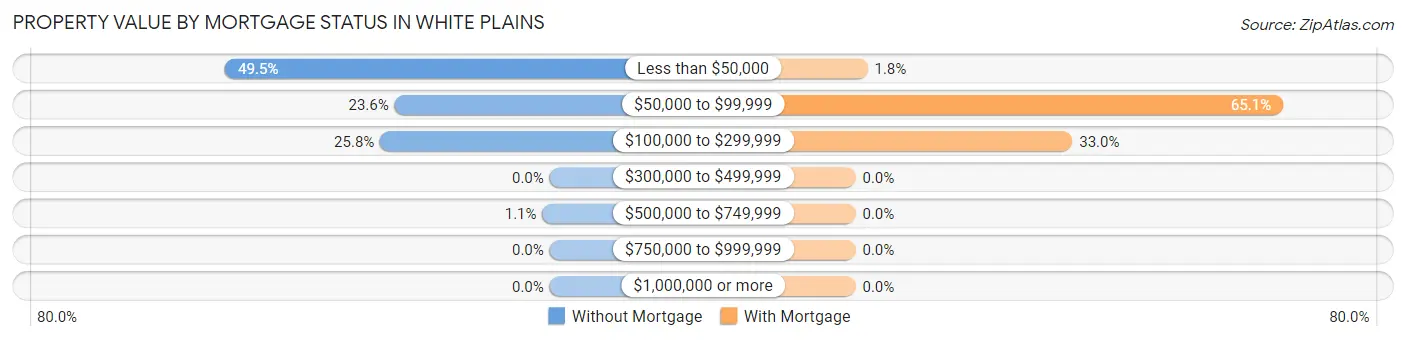
| Property Value | Without Mortgage | With Mortgage |
| Less than $50,000 | 90 (49.4%) | 4 (1.8%) |
| $50,000 to $99,999 | 43 (23.6%) | 142 (65.1%) |
| $100,000 to $299,999 | 47 (25.8%) | 72 (33.0%) |
| $300,000 to $499,999 | 0 (0.0%) | 0 (0.0%) |
| $500,000 to $749,999 | 2 (1.1%) | 0 (0.0%) |
| $750,000 to $999,999 | 0 (0.0%) | 0 (0.0%) |
| $1,000,000 or more | 0 (0.0%) | 0 (0.0%) |
| Total | 182 (100.0%) | 218 (100.0%) |
Household Income by Mortgage Status in White Plains
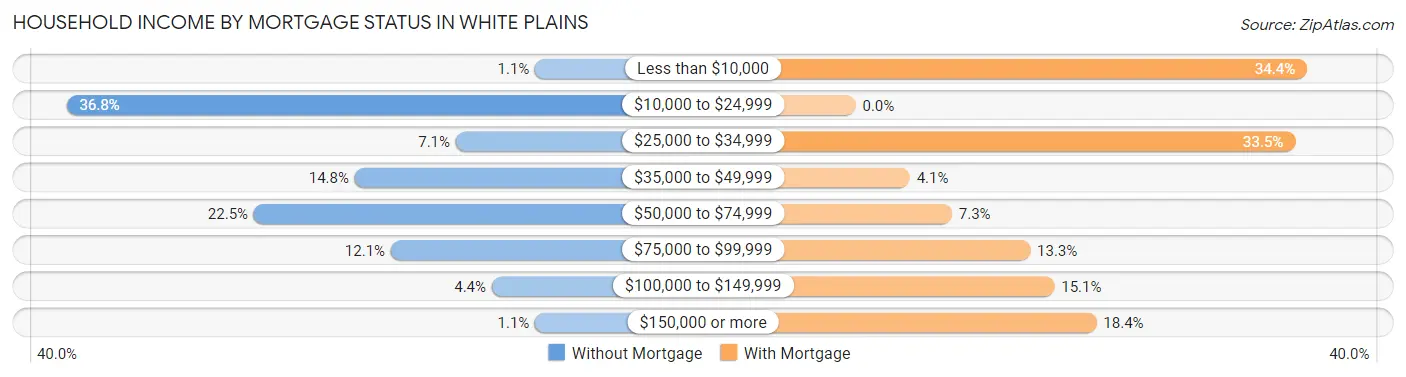
| Household Income | Without Mortgage | With Mortgage |
| Less than $10,000 | 2 (1.1%) | 75 (34.4%) |
| $10,000 to $24,999 | 67 (36.8%) | 0 (0.0%) |
| $25,000 to $34,999 | 13 (7.1%) | 73 (33.5%) |
| $35,000 to $49,999 | 27 (14.8%) | 9 (4.1%) |
| $50,000 to $74,999 | 41 (22.5%) | 16 (7.3%) |
| $75,000 to $99,999 | 22 (12.1%) | 29 (13.3%) |
| $100,000 to $149,999 | 8 (4.4%) | 33 (15.1%) |
| $150,000 or more | 2 (1.1%) | 40 (18.3%) |
| Total | 182 (100.0%) | 218 (100.0%) |
Property Value to Household Income Ratio in White Plains
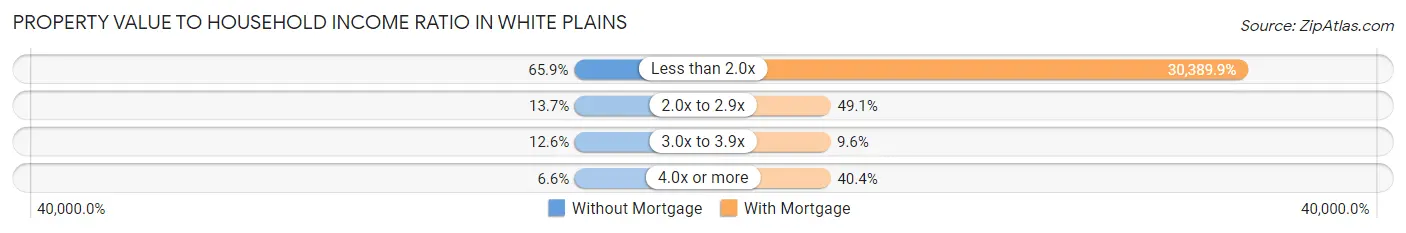
| Value-to-Income Ratio | Without Mortgage | With Mortgage |
| Less than 2.0x | 120 (65.9%) | 66,250 (30,389.9%) |
| 2.0x to 2.9x | 25 (13.7%) | 107 (49.1%) |
| 3.0x to 3.9x | 23 (12.6%) | 21 (9.6%) |
| 4.0x or more | 12 (6.6%) | 88 (40.4%) |
| Total | 182 (100.0%) | 218 (100.0%) |
Real Estate Taxes by Mortgage Status in White Plains
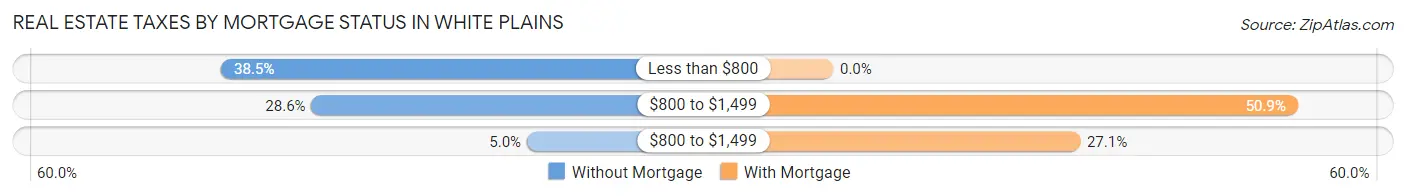
| Property Taxes | Without Mortgage | With Mortgage |
| Less than $800 | 70 (38.5%) | 0 (0.0%) |
| $800 to $1,499 | 52 (28.6%) | 111 (50.9%) |
| $800 to $1,499 | 9 (5.0%) | 59 (27.1%) |
| Total | 182 (100.0%) | 218 (100.0%) |
Health & Disability in White Plains
Health Insurance Coverage by Age in White Plains
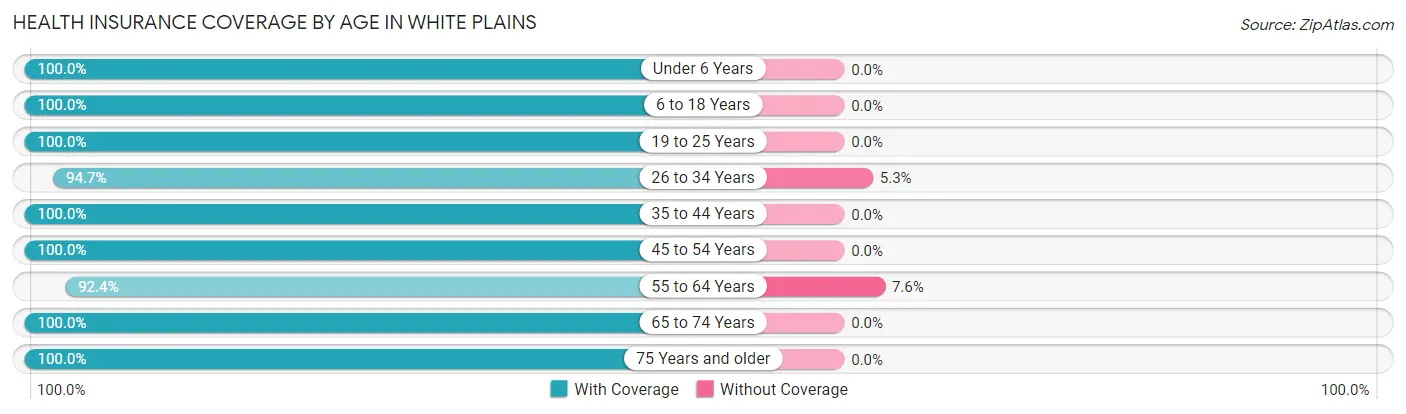
| Age Bracket | With Coverage | Without Coverage |
| Under 6 Years | 64 (100.0%) | 0 (0.0%) |
| 6 to 18 Years | 170 (100.0%) | 0 (0.0%) |
| 19 to 25 Years | 52 (100.0%) | 0 (0.0%) |
| 26 to 34 Years | 71 (94.7%) | 4 (5.3%) |
| 35 to 44 Years | 120 (100.0%) | 0 (0.0%) |
| 45 to 54 Years | 193 (100.0%) | 0 (0.0%) |
| 55 to 64 Years | 61 (92.4%) | 5 (7.6%) |
| 65 to 74 Years | 204 (100.0%) | 0 (0.0%) |
| 75 Years and older | 65 (100.0%) | 0 (0.0%) |
| Total | 1,000 (99.1%) | 9 (0.9%) |
Health Insurance Coverage by Citizenship Status in White Plains
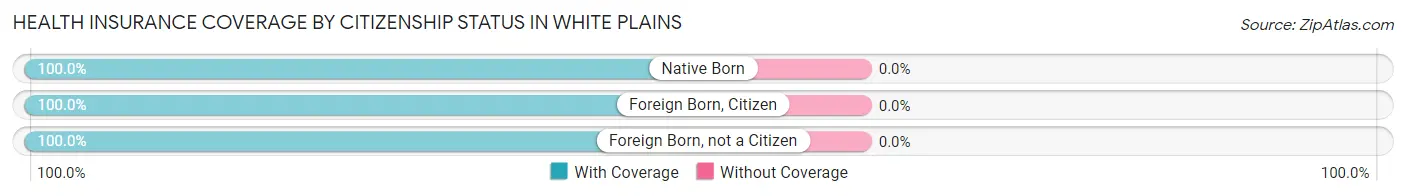
| Citizenship Status | With Coverage | Without Coverage |
| Native Born | 64 (100.0%) | 0 (0.0%) |
| Foreign Born, Citizen | 170 (100.0%) | 0 (0.0%) |
| Foreign Born, not a Citizen | 52 (100.0%) | 0 (0.0%) |
Health Insurance Coverage by Household Income in White Plains
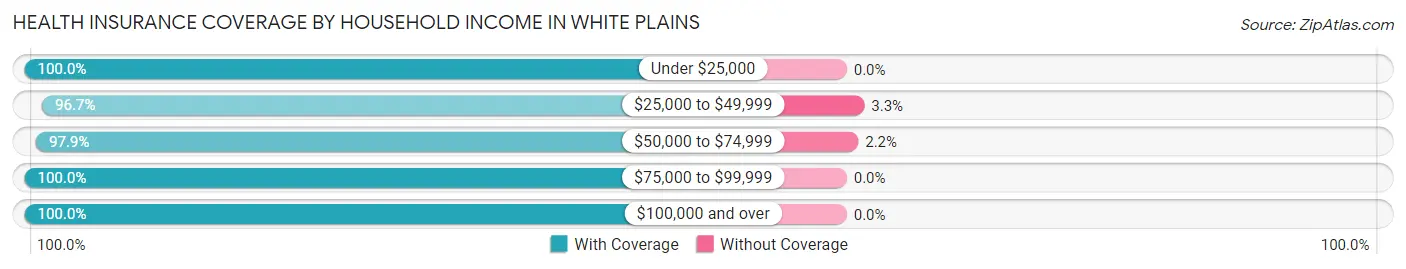
| Household Income | With Coverage | Without Coverage |
| Under $25,000 | 273 (100.0%) | 0 (0.0%) |
| $25,000 to $49,999 | 147 (96.7%) | 5 (3.3%) |
| $50,000 to $74,999 | 182 (97.9%) | 4 (2.1%) |
| $75,000 to $99,999 | 176 (100.0%) | 0 (0.0%) |
| $100,000 and over | 222 (100.0%) | 0 (0.0%) |
Public vs Private Health Insurance Coverage by Age in White Plains
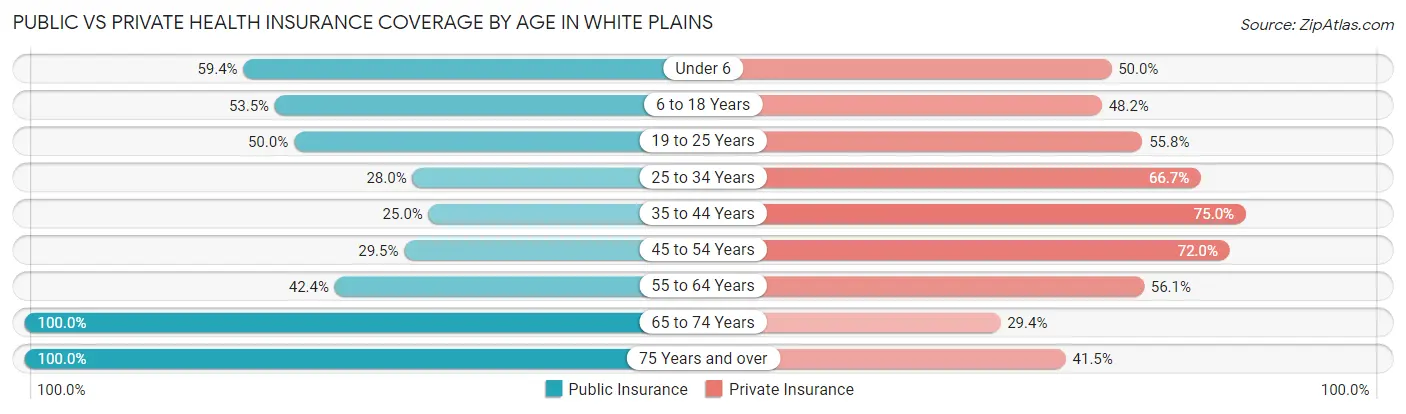
| Age Bracket | Public Insurance | Private Insurance |
| Under 6 | 38 (59.4%) | 32 (50.0%) |
| 6 to 18 Years | 91 (53.5%) | 82 (48.2%) |
| 19 to 25 Years | 26 (50.0%) | 29 (55.8%) |
| 25 to 34 Years | 21 (28.0%) | 50 (66.7%) |
| 35 to 44 Years | 30 (25.0%) | 90 (75.0%) |
| 45 to 54 Years | 57 (29.5%) | 139 (72.0%) |
| 55 to 64 Years | 28 (42.4%) | 37 (56.1%) |
| 65 to 74 Years | 204 (100.0%) | 60 (29.4%) |
| 75 Years and over | 65 (100.0%) | 27 (41.5%) |
| Total | 560 (55.5%) | 546 (54.1%) |
Disability Status by Sex by Age in White Plains
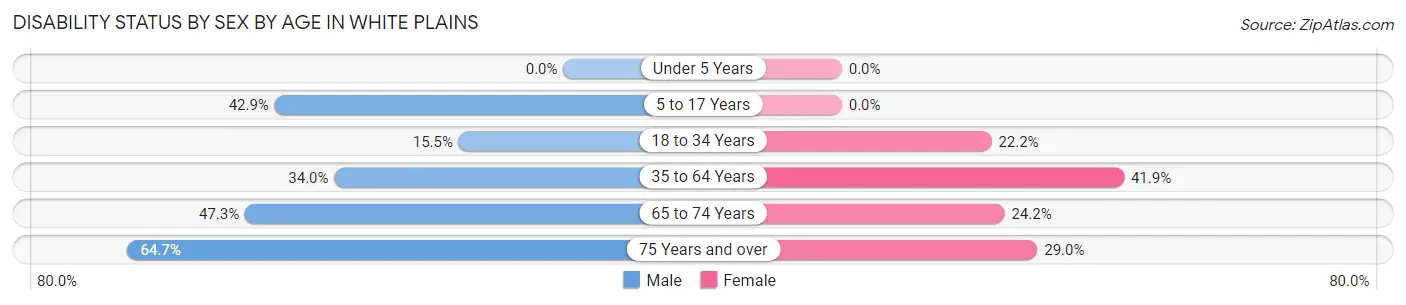
| Age Bracket | Male | Female |
| Under 5 Years | 0 (0.0%) | 0 (0.0%) |
| 5 to 17 Years | 33 (42.9%) | 0 (0.0%) |
| 18 to 34 Years | 9 (15.5%) | 16 (22.2%) |
| 35 to 64 Years | 68 (34.0%) | 75 (41.9%) |
| 65 to 74 Years | 26 (47.3%) | 36 (24.2%) |
| 75 Years and over | 22 (64.7%) | 9 (29.0%) |
Disability Class by Sex by Age in White Plains
Disability Class: Hearing Difficulty
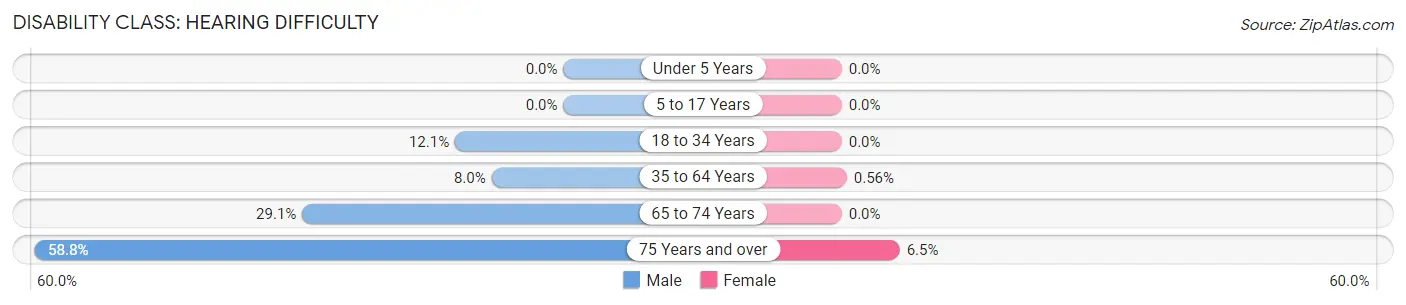
| Age Bracket | Male | Female |
| Under 5 Years | 0 (0.0%) | 0 (0.0%) |
| 5 to 17 Years | 0 (0.0%) | 0 (0.0%) |
| 18 to 34 Years | 7 (12.1%) | 0 (0.0%) |
| 35 to 64 Years | 16 (8.0%) | 1 (0.6%) |
| 65 to 74 Years | 16 (29.1%) | 0 (0.0%) |
| 75 Years and over | 20 (58.8%) | 2 (6.5%) |
Disability Class: Vision Difficulty
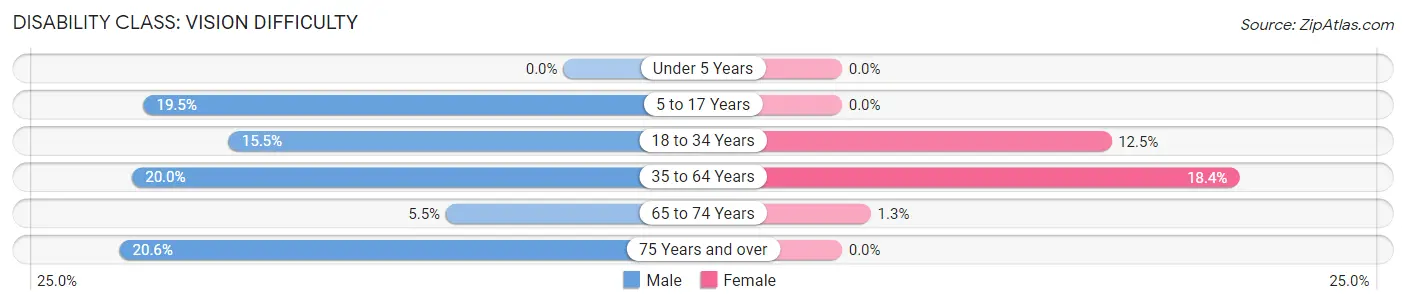
| Age Bracket | Male | Female |
| Under 5 Years | 0 (0.0%) | 0 (0.0%) |
| 5 to 17 Years | 15 (19.5%) | 0 (0.0%) |
| 18 to 34 Years | 9 (15.5%) | 9 (12.5%) |
| 35 to 64 Years | 40 (20.0%) | 33 (18.4%) |
| 65 to 74 Years | 3 (5.4%) | 2 (1.3%) |
| 75 Years and over | 7 (20.6%) | 0 (0.0%) |
Disability Class: Cognitive Difficulty
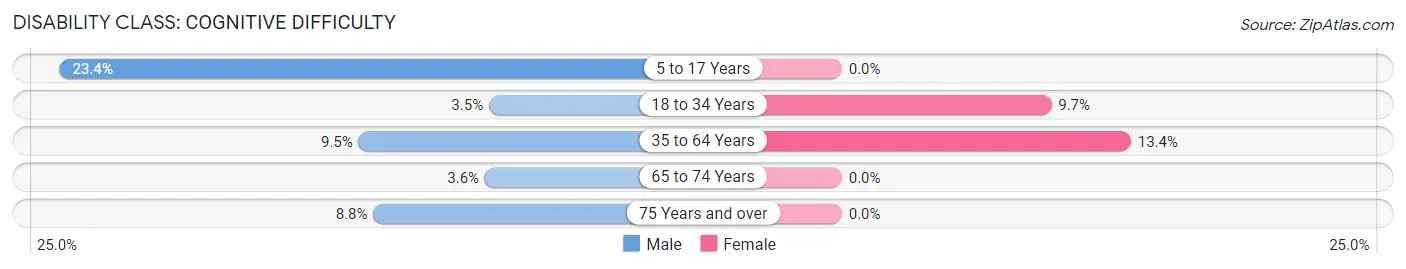
| Age Bracket | Male | Female |
| 5 to 17 Years | 18 (23.4%) | 0 (0.0%) |
| 18 to 34 Years | 2 (3.5%) | 7 (9.7%) |
| 35 to 64 Years | 19 (9.5%) | 24 (13.4%) |
| 65 to 74 Years | 2 (3.6%) | 0 (0.0%) |
| 75 Years and over | 3 (8.8%) | 0 (0.0%) |
Disability Class: Ambulatory Difficulty
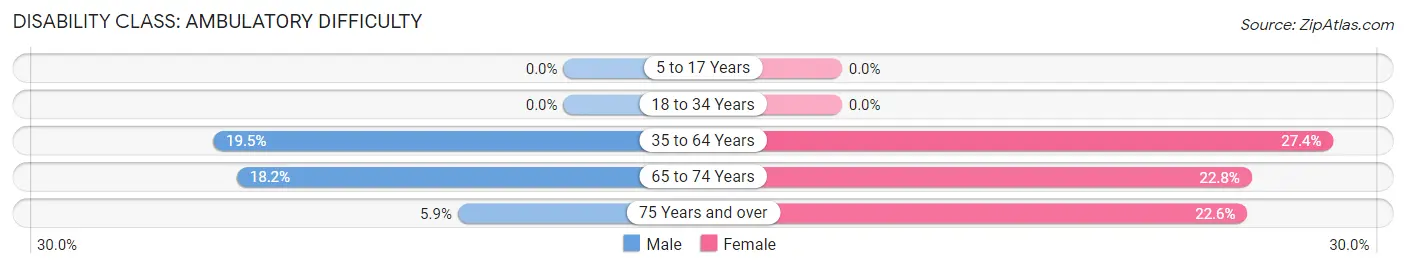
| Age Bracket | Male | Female |
| 5 to 17 Years | 0 (0.0%) | 0 (0.0%) |
| 18 to 34 Years | 0 (0.0%) | 0 (0.0%) |
| 35 to 64 Years | 39 (19.5%) | 49 (27.4%) |
| 65 to 74 Years | 10 (18.2%) | 34 (22.8%) |
| 75 Years and over | 2 (5.9%) | 7 (22.6%) |
Disability Class: Self-Care Difficulty
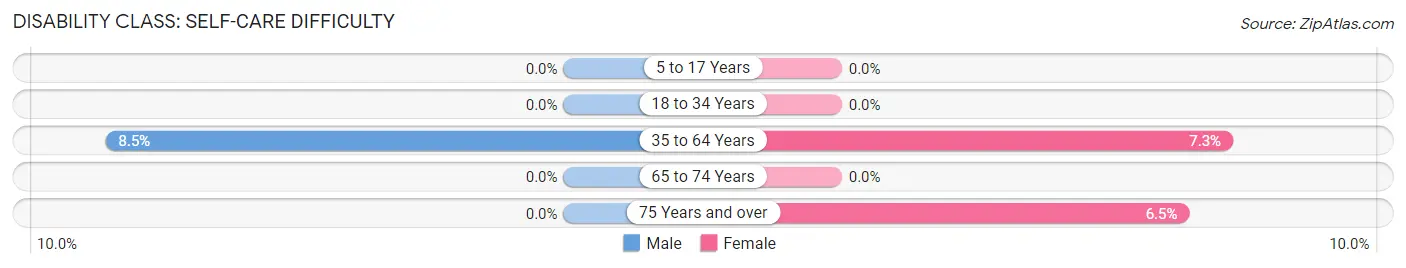
| Age Bracket | Male | Female |
| 5 to 17 Years | 0 (0.0%) | 0 (0.0%) |
| 18 to 34 Years | 0 (0.0%) | 0 (0.0%) |
| 35 to 64 Years | 17 (8.5%) | 13 (7.3%) |
| 65 to 74 Years | 0 (0.0%) | 0 (0.0%) |
| 75 Years and over | 0 (0.0%) | 2 (6.5%) |
Technology Access in White Plains
Computing Device Access in White Plains
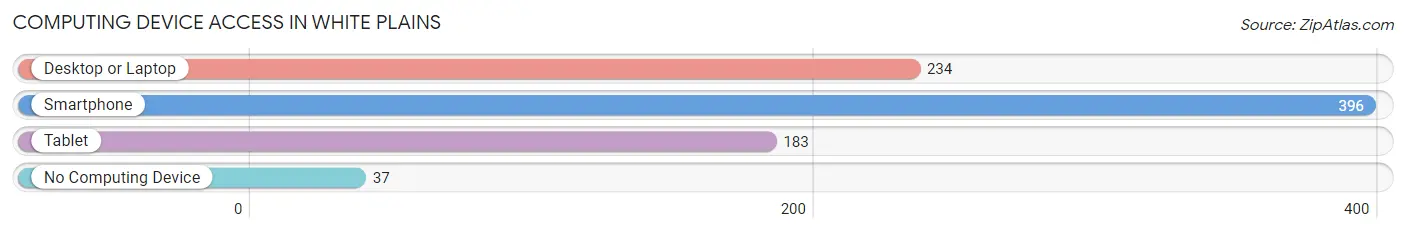
| Device Type | # Households | % Households |
| Desktop or Laptop | 234 | 51.7% |
| Smartphone | 396 | 87.4% |
| Tablet | 183 | 40.4% |
| No Computing Device | 37 | 8.2% |
| Total | 453 | 100.0% |
Internet Access in White Plains
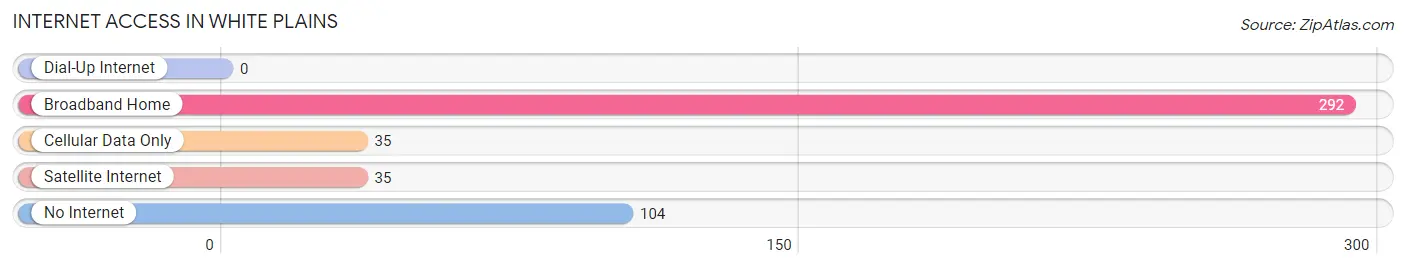
| Internet Type | # Households | % Households |
| Dial-Up Internet | 0 | 0.0% |
| Broadband Home | 292 | 64.5% |
| Cellular Data Only | 35 | 7.7% |
| Satellite Internet | 35 | 7.7% |
| No Internet | 104 | 23.0% |
| Total | 453 | 100.0% |
White Plains Summary
White Plains is a small unincorporated community located in the western part of Kentucky, in the United States. It is situated in the county of Barren, and is part of the Glasgow Micropolitan Statistical Area. The population of White Plains was estimated to be around 1,000 in the year 2000.
History
White Plains was first settled in the early 1800s by a group of settlers from Virginia. The town was originally known as “White’s Plains”, after the first settler, William White. The town was officially incorporated in 1820, and the name was changed to White Plains.
The town was a major stop on the Louisville and Nashville Railroad, which ran through the area in the late 1800s. This allowed the town to become a major hub for the surrounding area, and it quickly grew in size and importance.
In the early 1900s, White Plains was a major center for the tobacco industry. The town was home to several tobacco warehouses, and it was also the site of the first tobacco auction in the state of Kentucky.
Geography
White Plains is located in the western part of Kentucky, in the county of Barren. It is situated in the Glasgow Micropolitan Statistical Area, and is located about 25 miles south of Bowling Green.
The town is situated on the banks of the Barren River, and is surrounded by rolling hills and farmland. The climate in White Plains is generally mild, with hot summers and cold winters.
Economy
The economy of White Plains is largely based on agriculture. The town is home to several farms, and the surrounding area is known for its production of tobacco, corn, and soybeans.
White Plains is also home to several small businesses, including a few restaurants, a grocery store, and a few retail stores. The town is also home to a few manufacturing companies, including a furniture factory and a plastics factory.
Demographics
As of the year 2000, the population of White Plains was estimated to be around 1,000. The racial makeup of the town was 97.2% White, 0.7% African American, 0.3% Native American, 0.3% Asian, and 1.5% from other races.
The median household income in White Plains was estimated to be around $30,000 in the year 2000. The median home value was estimated to be around $60,000. The town has a low unemployment rate, and the poverty rate is below the national average.
White Plains is a small, rural community with a strong sense of community and a rich history. The town is home to a diverse population, and it is a great place to live and work.
Common Questions
What is Per Capita Income in White Plains?
Per Capita income in White Plains is $27,794.
What is the Median Family Income in White Plains?
Median Family Income in White Plains is $70,000.
What is the Median Household income in White Plains?
Median Household Income in White Plains is $41,125.
What is Income or Wage Gap in White Plains?
Income or Wage Gap in White Plains is 50.5%.
Women in White Plains earn 49.5 cents for every dollar earned by a man.
What is Family Income Deficit in White Plains?
Family Income Deficit in White Plains is $9,400.
Families that are below poverty line in White Plains earn $9,400 less on average than the poverty threshold level.
What is Inequality or Gini Index in White Plains?
Inequality or Gini Index in White Plains is 0.44.
What is the Total Population of White Plains?
Total Population of White Plains is 1,009.
What is the Total Male Population of White Plains?
Total Male Population of White Plains is 433.
What is the Total Female Population of White Plains?
Total Female Population of White Plains is 576.
What is the Ratio of Males per 100 Females in White Plains?
There are 75.17 Males per 100 Females in White Plains.
What is the Ratio of Females per 100 Males in White Plains?
There are 133.03 Females per 100 Males in White Plains.
What is the Median Population Age in White Plains?
Median Population Age in White Plains is 45.5 Years.
What is the Average Family Size in White Plains
Average Family Size in White Plains is 3.0 People.
What is the Average Household Size in White Plains
Average Household Size in White Plains is 2.2 People.
How Large is the Labor Force in White Plains?
There are 375 People in the Labor Forcein in White Plains.
What is the Percentage of People in the Labor Force in White Plains?
46.6% of People are in the Labor Force in White Plains.
What is the Unemployment Rate in White Plains?
Unemployment Rate in White Plains is 3.2%.