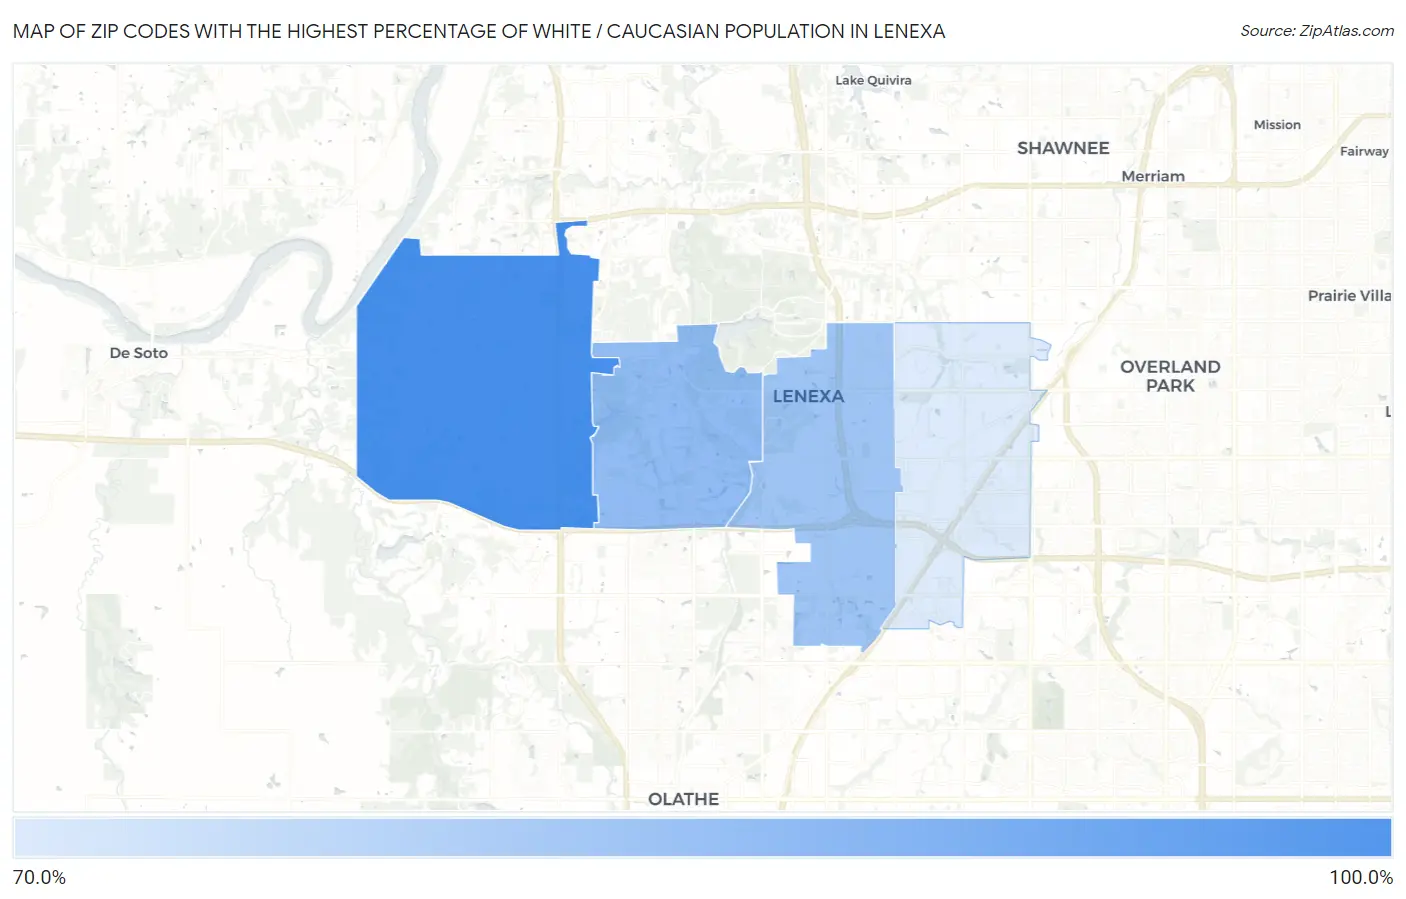
Zip Codes with the Highest Percentage of White / Caucasian Population in Lenexa, KS
RELATED REPORTS & OPTIONS
White / Caucasian
Lenexa
Compare Zip Codes
Map of Zip Codes with the Highest Percentage of White / Caucasian Population in Lenexa
78.6%
87.8%
Zip Codes with the Highest Percentage of White / Caucasian Population in Lenexa, KS
| Zip Code | White / Caucasian | vs State | vs National | |
| 1. | 66227 | 87.8% | 79.8%(+8.03)#483 | 65.9%(+21.9)#16,608 |
| 2. | 66220 | 83.1% | 79.8%(+3.38)#567 | 65.9%(+17.3)#19,424 |
| 3. | 66219 | 82.3% | 79.8%(+2.53)#578 | 65.9%(+16.4)#19,871 |
| 4. | 66215 | 78.6% | 79.8%(-1.18)#609 | 65.9%(+12.7)#21,609 |
1
Common Questions
What are the Top 3 Zip Codes with the Highest Percentage of White / Caucasian Population in Lenexa, KS?
Top 3 Zip Codes with the Highest Percentage of White / Caucasian Population in Lenexa, KS are:
What zip code has the Highest Percentage of White / Caucasian Population in Lenexa, KS?
66227 has the Highest Percentage of White / Caucasian Population in Lenexa, KS with 87.8%.
What is the Percentage of White / Caucasian Population in Lenexa, KS?
Percentage of White / Caucasian Population in Lenexa is 79.4%.
What is the Percentage of White / Caucasian Population in Kansas?
Percentage of White / Caucasian Population in Kansas is 79.8%.
What is the Percentage of White / Caucasian Population in the United States?
Percentage of White / Caucasian Population in the United States is 65.9%.