Houma vs Norwegian Median Family Income
COMPARE
Houma
Norwegian
Median Family Income
Median Family Income Comparison
Houma
Norwegians
$76,188
MEDIAN FAMILY INCOME
0.0/ 100
METRIC RATING
343rd/ 347
METRIC RANK
$106,144
MEDIAN FAMILY INCOME
85.5/ 100
METRIC RATING
140th/ 347
METRIC RANK
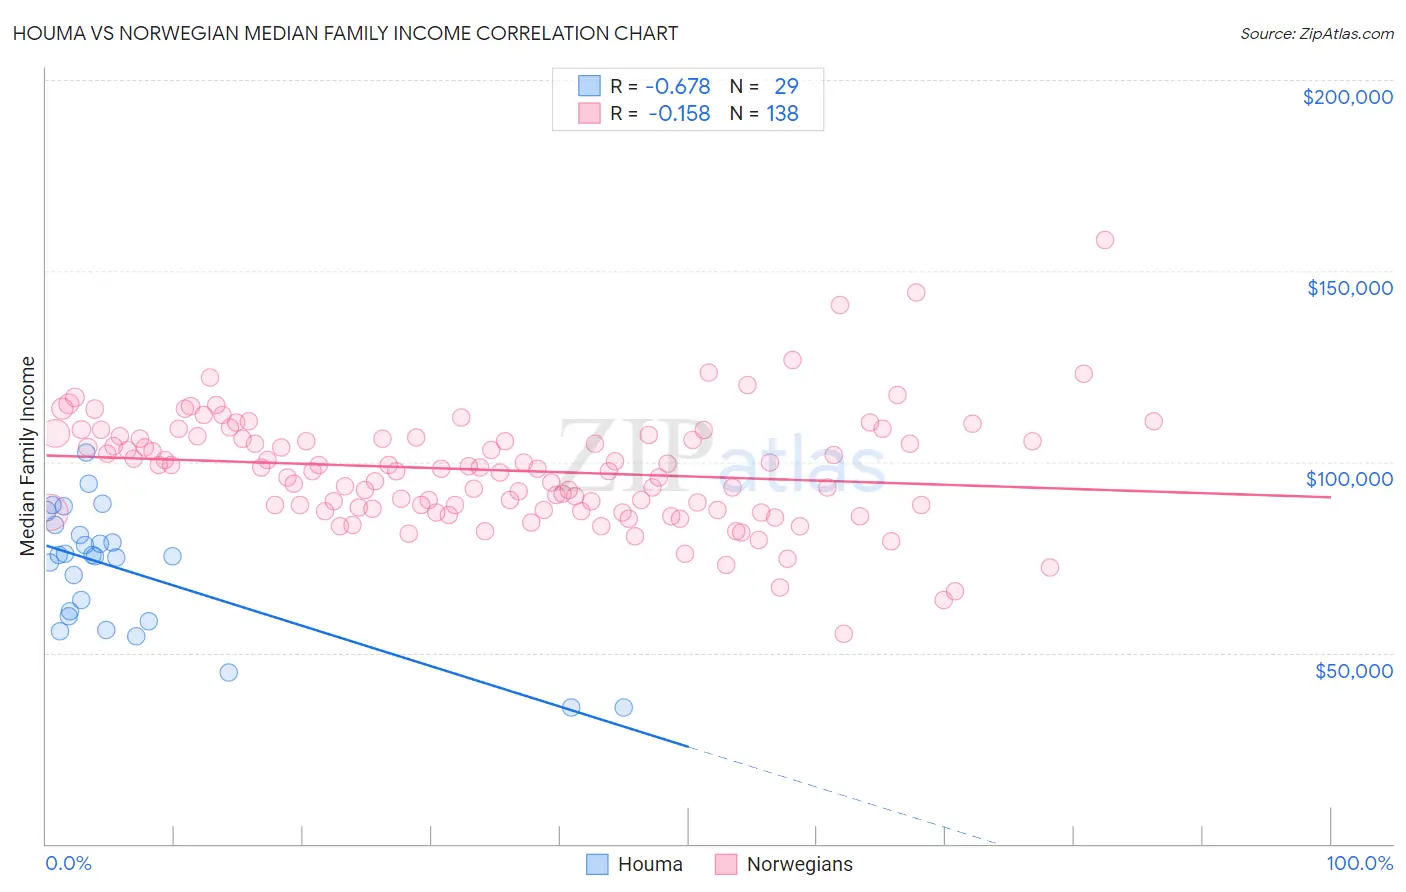
Houma vs Norwegian Median Family Income Correlation Chart
The statistical analysis conducted on geographies consisting of 36,790,797 people shows a significant negative correlation between the proportion of Houma and median family income in the United States with a correlation coefficient (R) of -0.678 and weighted average of $76,188. Similarly, the statistical analysis conducted on geographies consisting of 532,482,890 people shows a poor negative correlation between the proportion of Norwegians and median family income in the United States with a correlation coefficient (R) of -0.158 and weighted average of $106,144, a difference of 39.3%.
Median Family Income Correlation Summary
| Measurement | Houma | Norwegian |
| Minimum | $35,539 | $55,000 |
| Maximum | $102,344 | $158,125 |
| Range | $66,805 | $103,125 |
| Mean | $71,438 | $97,803 |
| Median | $75,379 | $98,173 |
| Interquartile 25% (IQ1) | $58,820 | $87,829 |
| Interquartile 75% (IQ3) | $82,023 | $106,302 |
| Interquartile Range (IQR) | $23,203 | $18,473 |
| Standard Deviation (Sample) | $16,513 | $14,847 |
| Standard Deviation (Population) | $16,226 | $14,793 |
Similar Demographics by Median Family Income
Demographics Similar to Houma by Median Family Income
In terms of median family income, the demographic groups most similar to Houma are Crow ($76,605, a difference of 0.55%), Pueblo ($76,880, a difference of 0.91%), Hopi ($77,188, a difference of 1.3%), Pima ($77,431, a difference of 1.6%), and Immigrants from Yemen ($77,457, a difference of 1.7%).
| Demographics | Rating | Rank | Median Family Income |
| Kiowa | 0.0 /100 | #333 | Tragic $80,885 |
| Menominee | 0.0 /100 | #334 | Tragic $79,563 |
| Yup'ik | 0.0 /100 | #335 | Tragic $79,290 |
| Immigrants | Cuba | 0.0 /100 | #336 | Tragic $78,249 |
| Yuman | 0.0 /100 | #337 | Tragic $78,055 |
| Immigrants | Yemen | 0.0 /100 | #338 | Tragic $77,457 |
| Pima | 0.0 /100 | #339 | Tragic $77,431 |
| Hopi | 0.0 /100 | #340 | Tragic $77,188 |
| Pueblo | 0.0 /100 | #341 | Tragic $76,880 |
| Crow | 0.0 /100 | #342 | Tragic $76,605 |
| Houma | 0.0 /100 | #343 | Tragic $76,188 |
| Tohono O'odham | 0.0 /100 | #344 | Tragic $72,193 |
| Navajo | 0.0 /100 | #345 | Tragic $70,989 |
| Puerto Ricans | 0.0 /100 | #346 | Tragic $70,423 |
| Lumbee | 0.0 /100 | #347 | Tragic $68,679 |
Demographics Similar to Norwegians by Median Family Income
In terms of median family income, the demographic groups most similar to Norwegians are Immigrants from Syria ($106,118, a difference of 0.020%), Immigrants from Uganda ($106,188, a difference of 0.040%), Immigrants from Vietnam ($106,186, a difference of 0.040%), Luxembourger ($106,183, a difference of 0.040%), and Immigrants from South Eastern Asia ($106,252, a difference of 0.10%).
| Demographics | Rating | Rank | Median Family Income |
| Ugandans | 87.8 /100 | #133 | Excellent $106,541 |
| Immigrants | Oceania | 87.3 /100 | #134 | Excellent $106,453 |
| Portuguese | 86.3 /100 | #135 | Excellent $106,286 |
| Immigrants | South Eastern Asia | 86.1 /100 | #136 | Excellent $106,252 |
| Immigrants | Uganda | 85.7 /100 | #137 | Excellent $106,188 |
| Immigrants | Vietnam | 85.7 /100 | #138 | Excellent $106,186 |
| Luxembourgers | 85.7 /100 | #139 | Excellent $106,183 |
| Norwegians | 85.5 /100 | #140 | Excellent $106,144 |
| Immigrants | Syria | 85.3 /100 | #141 | Excellent $106,118 |
| Slovenes | 84.7 /100 | #142 | Excellent $106,020 |
| Tongans | 84.3 /100 | #143 | Excellent $105,967 |
| Immigrants | Morocco | 84.3 /100 | #144 | Excellent $105,964 |
| Danes | 83.8 /100 | #145 | Excellent $105,900 |
| Czechs | 83.4 /100 | #146 | Excellent $105,839 |
| Immigrants | Chile | 82.1 /100 | #147 | Excellent $105,655 |