Houma vs Immigrants from Australia Median Family Income
COMPARE
Houma
Immigrants from Australia
Median Family Income
Median Family Income Comparison
Houma
Immigrants from Australia
$76,188
MEDIAN FAMILY INCOME
0.0/ 100
METRIC RATING
343rd/ 347
METRIC RANK
$126,620
MEDIAN FAMILY INCOME
100.0/ 100
METRIC RATING
13th/ 347
METRIC RANK
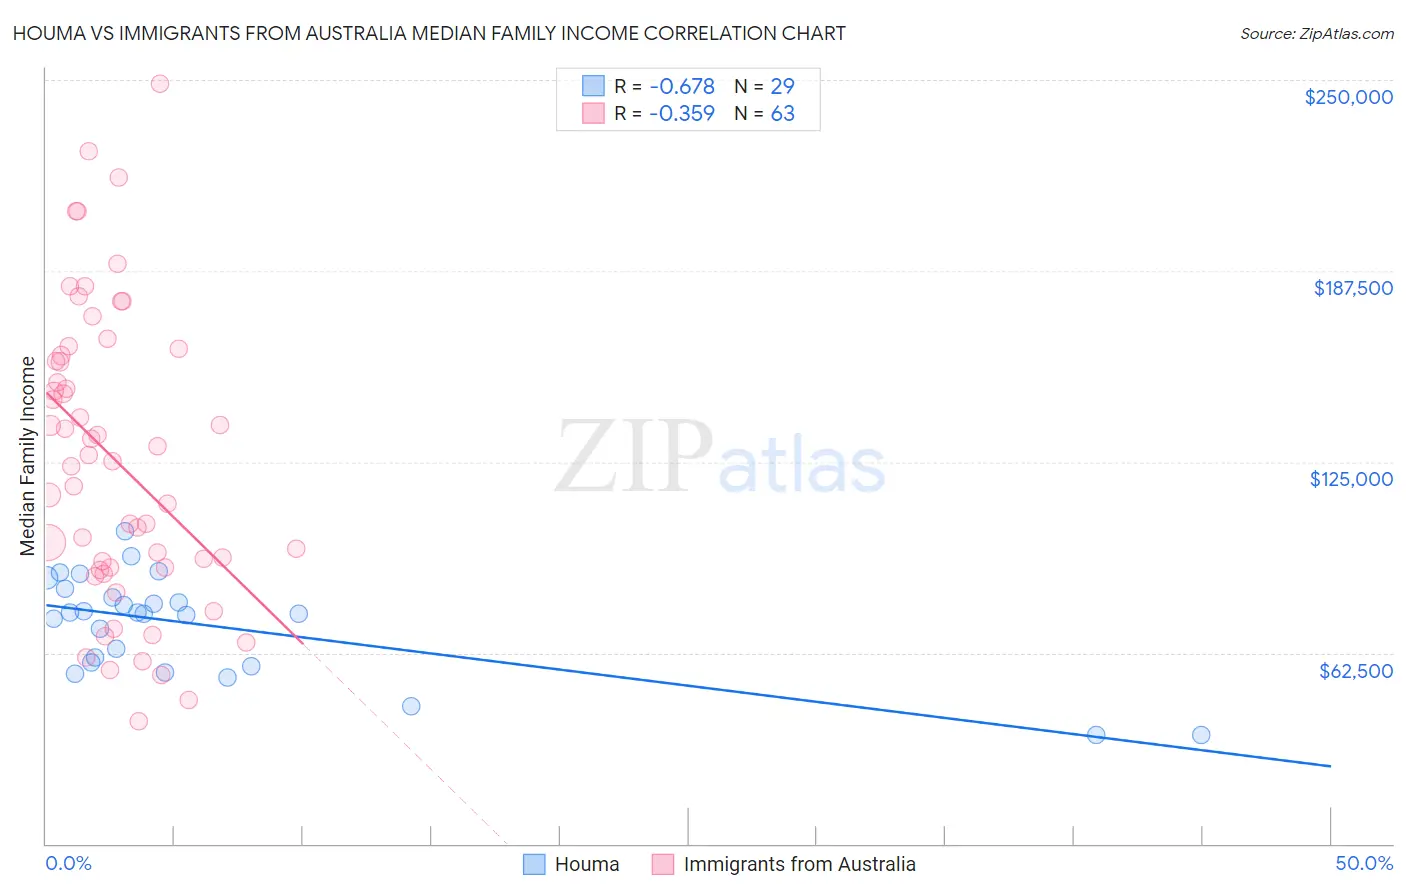
Houma vs Immigrants from Australia Median Family Income Correlation Chart
The statistical analysis conducted on geographies consisting of 36,790,797 people shows a significant negative correlation between the proportion of Houma and median family income in the United States with a correlation coefficient (R) of -0.678 and weighted average of $76,188. Similarly, the statistical analysis conducted on geographies consisting of 227,105,113 people shows a mild negative correlation between the proportion of Immigrants from Australia and median family income in the United States with a correlation coefficient (R) of -0.359 and weighted average of $126,620, a difference of 66.2%.
Median Family Income Correlation Summary
| Measurement | Houma | Immigrants from Australia |
| Minimum | $35,539 | $40,038 |
| Maximum | $102,344 | $248,750 |
| Range | $66,805 | $208,712 |
| Mean | $71,438 | $125,759 |
| Median | $75,379 | $125,053 |
| Interquartile 25% (IQ1) | $58,820 | $90,291 |
| Interquartile 75% (IQ3) | $82,023 | $159,793 |
| Interquartile Range (IQR) | $23,203 | $69,502 |
| Standard Deviation (Sample) | $16,513 | $48,023 |
| Standard Deviation (Population) | $16,226 | $47,640 |
Similar Demographics by Median Family Income
Demographics Similar to Houma by Median Family Income
In terms of median family income, the demographic groups most similar to Houma are Crow ($76,605, a difference of 0.55%), Pueblo ($76,880, a difference of 0.91%), Hopi ($77,188, a difference of 1.3%), Pima ($77,431, a difference of 1.6%), and Immigrants from Yemen ($77,457, a difference of 1.7%).
| Demographics | Rating | Rank | Median Family Income |
| Kiowa | 0.0 /100 | #333 | Tragic $80,885 |
| Menominee | 0.0 /100 | #334 | Tragic $79,563 |
| Yup'ik | 0.0 /100 | #335 | Tragic $79,290 |
| Immigrants | Cuba | 0.0 /100 | #336 | Tragic $78,249 |
| Yuman | 0.0 /100 | #337 | Tragic $78,055 |
| Immigrants | Yemen | 0.0 /100 | #338 | Tragic $77,457 |
| Pima | 0.0 /100 | #339 | Tragic $77,431 |
| Hopi | 0.0 /100 | #340 | Tragic $77,188 |
| Pueblo | 0.0 /100 | #341 | Tragic $76,880 |
| Crow | 0.0 /100 | #342 | Tragic $76,605 |
| Houma | 0.0 /100 | #343 | Tragic $76,188 |
| Tohono O'odham | 0.0 /100 | #344 | Tragic $72,193 |
| Navajo | 0.0 /100 | #345 | Tragic $70,989 |
| Puerto Ricans | 0.0 /100 | #346 | Tragic $70,423 |
| Lumbee | 0.0 /100 | #347 | Tragic $68,679 |
Demographics Similar to Immigrants from Australia by Median Family Income
In terms of median family income, the demographic groups most similar to Immigrants from Australia are Cypriot ($127,064, a difference of 0.35%), Immigrants from South Central Asia ($125,956, a difference of 0.53%), Immigrants from Israel ($127,430, a difference of 0.64%), Immigrants from Ireland ($127,584, a difference of 0.76%), and Eastern European ($125,546, a difference of 0.86%).
| Demographics | Rating | Rank | Median Family Income |
| Thais | 100.0 /100 | #6 | Exceptional $131,281 |
| Immigrants | Hong Kong | 100.0 /100 | #7 | Exceptional $131,067 |
| Immigrants | Iran | 100.0 /100 | #8 | Exceptional $130,894 |
| Okinawans | 100.0 /100 | #9 | Exceptional $129,979 |
| Immigrants | Ireland | 100.0 /100 | #10 | Exceptional $127,584 |
| Immigrants | Israel | 100.0 /100 | #11 | Exceptional $127,430 |
| Cypriots | 100.0 /100 | #12 | Exceptional $127,064 |
| Immigrants | Australia | 100.0 /100 | #13 | Exceptional $126,620 |
| Immigrants | South Central Asia | 100.0 /100 | #14 | Exceptional $125,956 |
| Eastern Europeans | 100.0 /100 | #15 | Exceptional $125,546 |
| Immigrants | China | 100.0 /100 | #16 | Exceptional $125,540 |
| Indians (Asian) | 100.0 /100 | #17 | Exceptional $125,312 |
| Immigrants | Eastern Asia | 100.0 /100 | #18 | Exceptional $125,150 |
| Immigrants | Belgium | 100.0 /100 | #19 | Exceptional $123,831 |
| Burmese | 100.0 /100 | #20 | Exceptional $123,369 |