Houma vs Immigrants from Sierra Leone Median Family Income
COMPARE
Houma
Immigrants from Sierra Leone
Median Family Income
Median Family Income Comparison
Houma
Immigrants from Sierra Leone
$76,188
MEDIAN FAMILY INCOME
0.0/ 100
METRIC RATING
343rd/ 347
METRIC RANK
$103,990
MEDIAN FAMILY INCOME
66.2/ 100
METRIC RATING
162nd/ 347
METRIC RANK
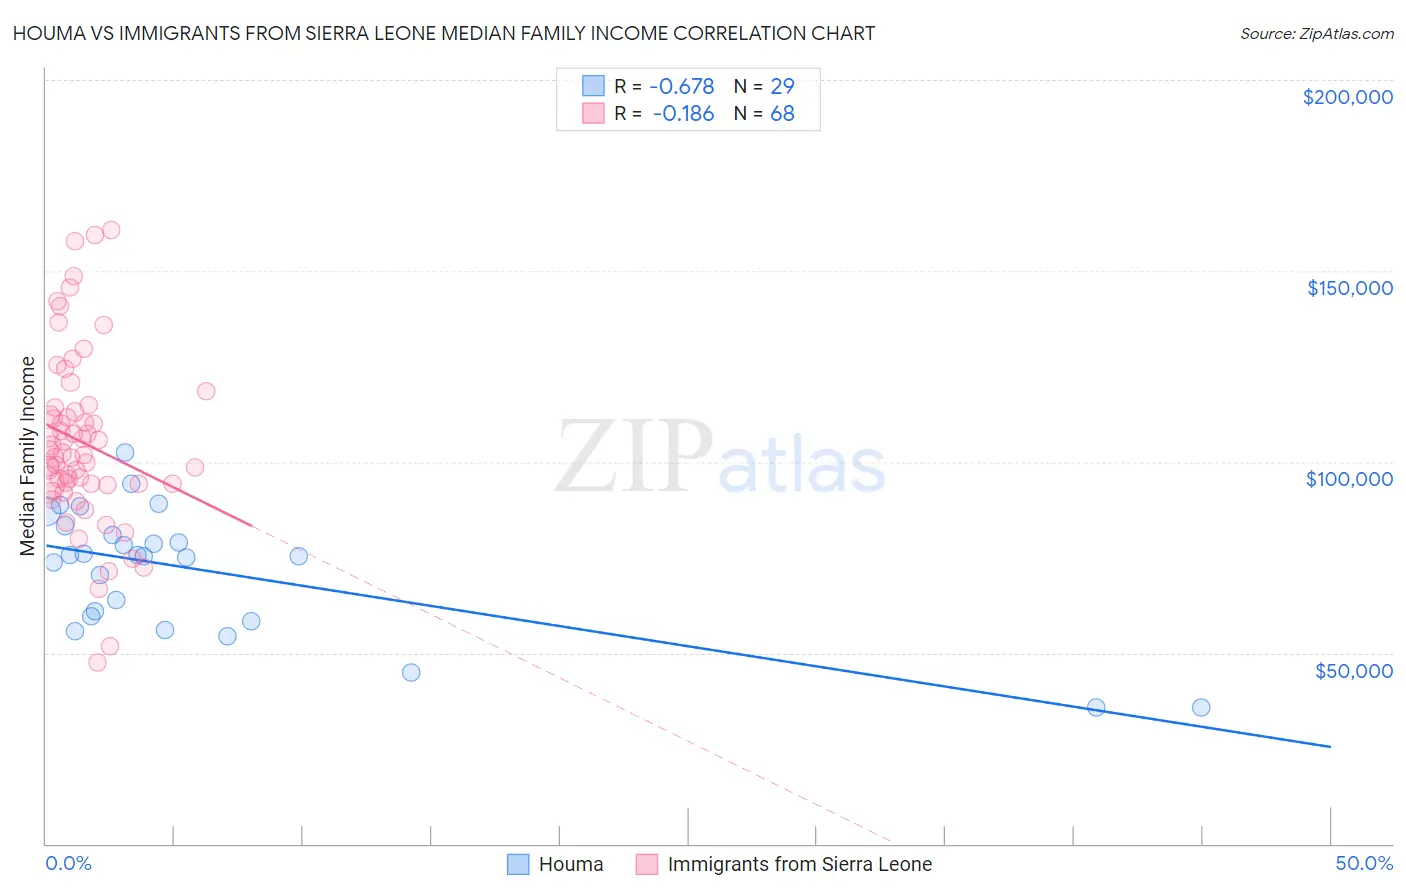
Houma vs Immigrants from Sierra Leone Median Family Income Correlation Chart
The statistical analysis conducted on geographies consisting of 36,790,797 people shows a significant negative correlation between the proportion of Houma and median family income in the United States with a correlation coefficient (R) of -0.678 and weighted average of $76,188. Similarly, the statistical analysis conducted on geographies consisting of 101,644,998 people shows a poor negative correlation between the proportion of Immigrants from Sierra Leone and median family income in the United States with a correlation coefficient (R) of -0.186 and weighted average of $103,990, a difference of 36.5%.
Median Family Income Correlation Summary
| Measurement | Houma | Immigrants from Sierra Leone |
| Minimum | $35,539 | $47,578 |
| Maximum | $102,344 | $160,863 |
| Range | $66,805 | $113,285 |
| Mean | $71,438 | $105,117 |
| Median | $75,379 | $102,019 |
| Interquartile 25% (IQ1) | $58,820 | $94,047 |
| Interquartile 75% (IQ3) | $82,023 | $113,626 |
| Interquartile Range (IQR) | $23,203 | $19,580 |
| Standard Deviation (Sample) | $16,513 | $22,846 |
| Standard Deviation (Population) | $16,226 | $22,677 |
Similar Demographics by Median Family Income
Demographics Similar to Houma by Median Family Income
In terms of median family income, the demographic groups most similar to Houma are Crow ($76,605, a difference of 0.55%), Pueblo ($76,880, a difference of 0.91%), Hopi ($77,188, a difference of 1.3%), Pima ($77,431, a difference of 1.6%), and Immigrants from Yemen ($77,457, a difference of 1.7%).
| Demographics | Rating | Rank | Median Family Income |
| Kiowa | 0.0 /100 | #333 | Tragic $80,885 |
| Menominee | 0.0 /100 | #334 | Tragic $79,563 |
| Yup'ik | 0.0 /100 | #335 | Tragic $79,290 |
| Immigrants | Cuba | 0.0 /100 | #336 | Tragic $78,249 |
| Yuman | 0.0 /100 | #337 | Tragic $78,055 |
| Immigrants | Yemen | 0.0 /100 | #338 | Tragic $77,457 |
| Pima | 0.0 /100 | #339 | Tragic $77,431 |
| Hopi | 0.0 /100 | #340 | Tragic $77,188 |
| Pueblo | 0.0 /100 | #341 | Tragic $76,880 |
| Crow | 0.0 /100 | #342 | Tragic $76,605 |
| Houma | 0.0 /100 | #343 | Tragic $76,188 |
| Tohono O'odham | 0.0 /100 | #344 | Tragic $72,193 |
| Navajo | 0.0 /100 | #345 | Tragic $70,989 |
| Puerto Ricans | 0.0 /100 | #346 | Tragic $70,423 |
| Lumbee | 0.0 /100 | #347 | Tragic $68,679 |
Demographics Similar to Immigrants from Sierra Leone by Median Family Income
In terms of median family income, the demographic groups most similar to Immigrants from Sierra Leone are Costa Rican ($103,989, a difference of 0.0%), Sierra Leonean ($103,859, a difference of 0.13%), Slovak ($103,729, a difference of 0.25%), Icelander ($104,282, a difference of 0.28%), and Scottish ($104,288, a difference of 0.29%).
| Demographics | Rating | Rank | Median Family Income |
| Native Hawaiians | 75.8 /100 | #155 | Good $104,910 |
| Basques | 74.4 /100 | #156 | Good $104,760 |
| Moroccans | 71.6 /100 | #157 | Good $104,488 |
| Scandinavians | 70.8 /100 | #158 | Good $104,410 |
| Swiss | 70.7 /100 | #159 | Good $104,396 |
| Scottish | 69.5 /100 | #160 | Good $104,288 |
| Icelanders | 69.4 /100 | #161 | Good $104,282 |
| Immigrants | Sierra Leone | 66.2 /100 | #162 | Good $103,990 |
| Costa Ricans | 66.2 /100 | #163 | Good $103,989 |
| Sierra Leoneans | 64.7 /100 | #164 | Good $103,859 |
| Slovaks | 63.1 /100 | #165 | Good $103,729 |
| English | 62.6 /100 | #166 | Good $103,684 |
| South American Indians | 61.9 /100 | #167 | Good $103,624 |
| Immigrants | Peru | 60.8 /100 | #168 | Good $103,534 |
| Czechoslovakians | 57.6 /100 | #169 | Average $103,273 |