Houma vs Immigrants from Western Europe Median Family Income
COMPARE
Houma
Immigrants from Western Europe
Median Family Income
Median Family Income Comparison
Houma
Immigrants from Western Europe
$76,188
MEDIAN FAMILY INCOME
0.0/ 100
METRIC RATING
343rd/ 347
METRIC RANK
$112,688
MEDIAN FAMILY INCOME
99.4/ 100
METRIC RATING
75th/ 347
METRIC RANK
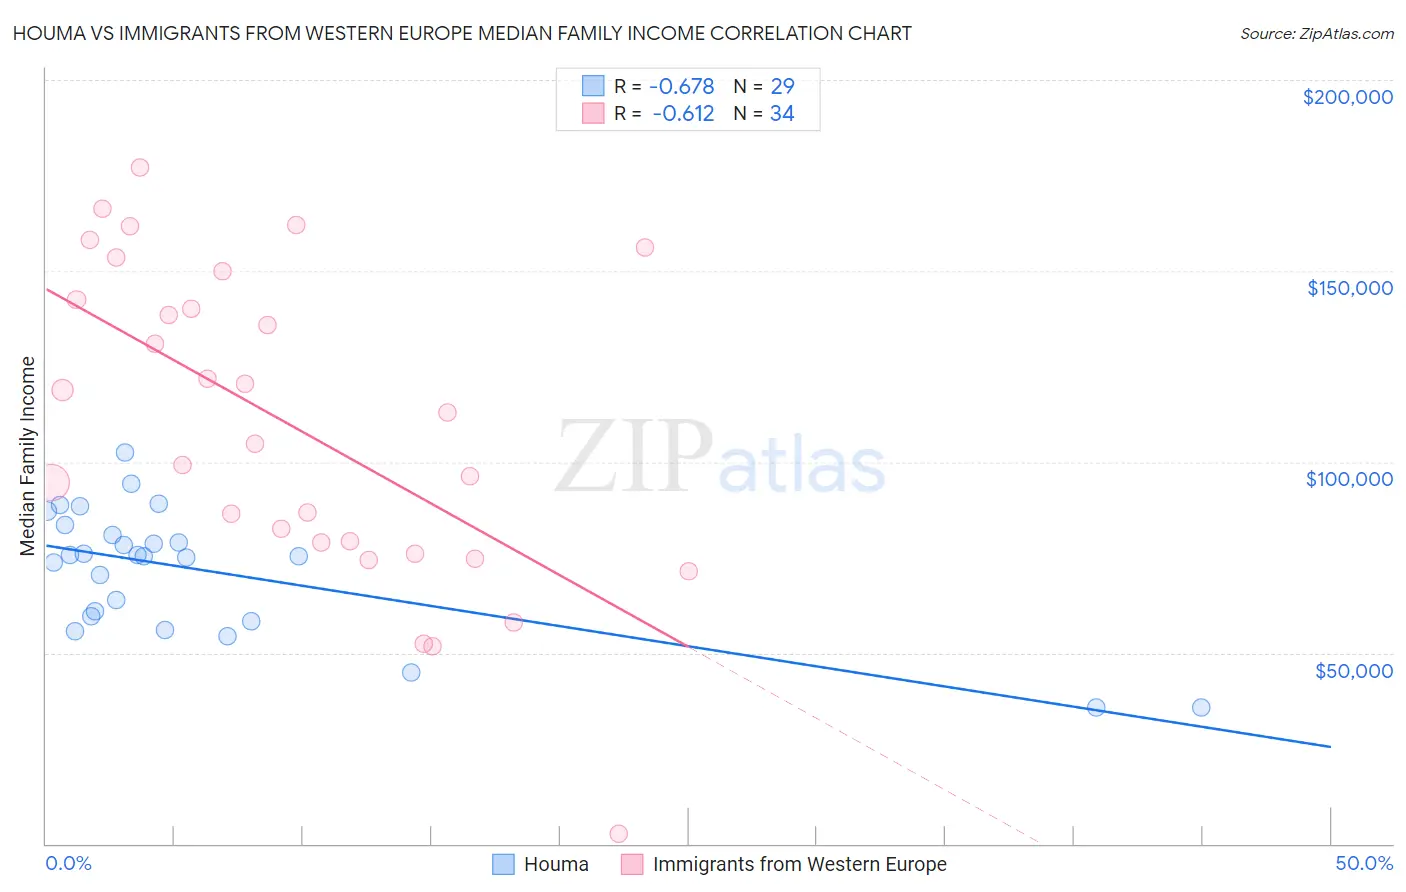
Houma vs Immigrants from Western Europe Median Family Income Correlation Chart
The statistical analysis conducted on geographies consisting of 36,790,797 people shows a significant negative correlation between the proportion of Houma and median family income in the United States with a correlation coefficient (R) of -0.678 and weighted average of $76,188. Similarly, the statistical analysis conducted on geographies consisting of 493,641,524 people shows a significant negative correlation between the proportion of Immigrants from Western Europe and median family income in the United States with a correlation coefficient (R) of -0.612 and weighted average of $112,688, a difference of 47.9%.
Median Family Income Correlation Summary
| Measurement | Houma | Immigrants from Western Europe |
| Minimum | $35,539 | $2,499 |
| Maximum | $102,344 | $177,105 |
| Range | $66,805 | $174,606 |
| Mean | $71,438 | $109,288 |
| Median | $75,379 | $108,868 |
| Interquartile 25% (IQ1) | $58,820 | $78,809 |
| Interquartile 75% (IQ3) | $82,023 | $142,425 |
| Interquartile Range (IQR) | $23,203 | $63,615 |
| Standard Deviation (Sample) | $16,513 | $41,087 |
| Standard Deviation (Population) | $16,226 | $40,478 |
Similar Demographics by Median Family Income
Demographics Similar to Houma by Median Family Income
In terms of median family income, the demographic groups most similar to Houma are Crow ($76,605, a difference of 0.55%), Pueblo ($76,880, a difference of 0.91%), Hopi ($77,188, a difference of 1.3%), Pima ($77,431, a difference of 1.6%), and Immigrants from Yemen ($77,457, a difference of 1.7%).
| Demographics | Rating | Rank | Median Family Income |
| Kiowa | 0.0 /100 | #333 | Tragic $80,885 |
| Menominee | 0.0 /100 | #334 | Tragic $79,563 |
| Yup'ik | 0.0 /100 | #335 | Tragic $79,290 |
| Immigrants | Cuba | 0.0 /100 | #336 | Tragic $78,249 |
| Yuman | 0.0 /100 | #337 | Tragic $78,055 |
| Immigrants | Yemen | 0.0 /100 | #338 | Tragic $77,457 |
| Pima | 0.0 /100 | #339 | Tragic $77,431 |
| Hopi | 0.0 /100 | #340 | Tragic $77,188 |
| Pueblo | 0.0 /100 | #341 | Tragic $76,880 |
| Crow | 0.0 /100 | #342 | Tragic $76,605 |
| Houma | 0.0 /100 | #343 | Tragic $76,188 |
| Tohono O'odham | 0.0 /100 | #344 | Tragic $72,193 |
| Navajo | 0.0 /100 | #345 | Tragic $70,989 |
| Puerto Ricans | 0.0 /100 | #346 | Tragic $70,423 |
| Lumbee | 0.0 /100 | #347 | Tragic $68,679 |
Demographics Similar to Immigrants from Western Europe by Median Family Income
In terms of median family income, the demographic groups most similar to Immigrants from Western Europe are Argentinean ($112,665, a difference of 0.020%), Immigrants from Italy ($112,848, a difference of 0.14%), Immigrants from Eastern Europe ($112,527, a difference of 0.14%), Laotian ($112,859, a difference of 0.15%), and Afghan ($112,971, a difference of 0.25%).
| Demographics | Rating | Rank | Median Family Income |
| Immigrants | Serbia | 99.6 /100 | #68 | Exceptional $113,463 |
| Immigrants | Bulgaria | 99.6 /100 | #69 | Exceptional $113,461 |
| Immigrants | Romania | 99.6 /100 | #70 | Exceptional $113,434 |
| South Africans | 99.5 /100 | #71 | Exceptional $113,229 |
| Afghans | 99.5 /100 | #72 | Exceptional $112,971 |
| Laotians | 99.5 /100 | #73 | Exceptional $112,859 |
| Immigrants | Italy | 99.4 /100 | #74 | Exceptional $112,848 |
| Immigrants | Western Europe | 99.4 /100 | #75 | Exceptional $112,688 |
| Argentineans | 99.4 /100 | #76 | Exceptional $112,665 |
| Immigrants | Eastern Europe | 99.4 /100 | #77 | Exceptional $112,527 |
| Immigrants | Canada | 99.3 /100 | #78 | Exceptional $112,374 |
| Italians | 99.3 /100 | #79 | Exceptional $112,372 |
| Immigrants | Croatia | 99.3 /100 | #80 | Exceptional $112,323 |
| Immigrants | North America | 99.2 /100 | #81 | Exceptional $112,151 |
| Immigrants | England | 99.2 /100 | #82 | Exceptional $112,038 |