Houma vs Immigrants from Guatemala Median Family Income
COMPARE
Houma
Immigrants from Guatemala
Median Family Income
Median Family Income Comparison
Houma
Immigrants from Guatemala
$76,188
MEDIAN FAMILY INCOME
0.0/ 100
METRIC RATING
343rd/ 347
METRIC RANK
$87,191
MEDIAN FAMILY INCOME
0.0/ 100
METRIC RATING
296th/ 347
METRIC RANK
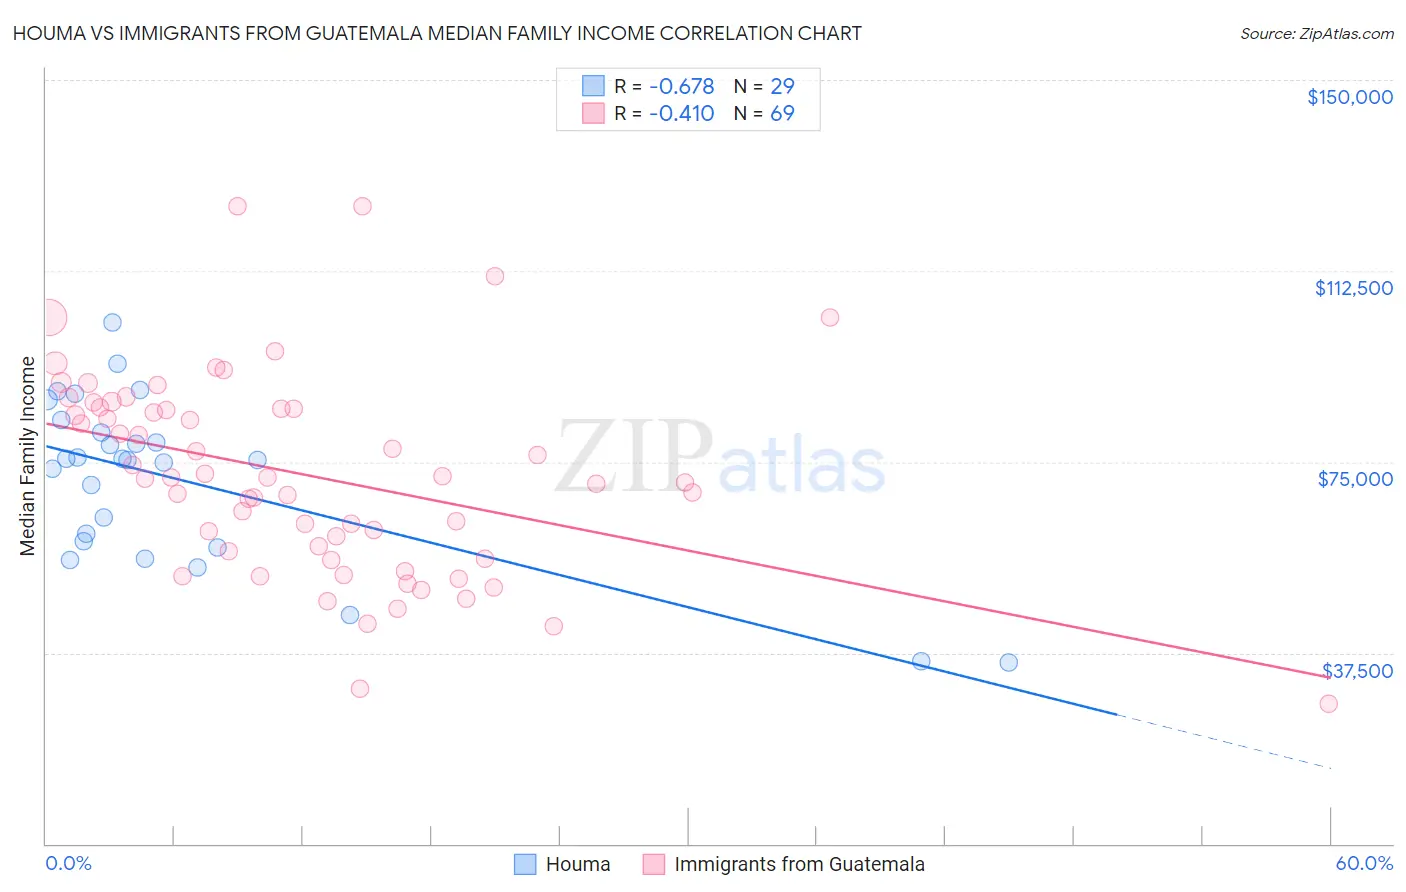
Houma vs Immigrants from Guatemala Median Family Income Correlation Chart
The statistical analysis conducted on geographies consisting of 36,790,797 people shows a significant negative correlation between the proportion of Houma and median family income in the United States with a correlation coefficient (R) of -0.678 and weighted average of $76,188. Similarly, the statistical analysis conducted on geographies consisting of 377,084,903 people shows a moderate negative correlation between the proportion of Immigrants from Guatemala and median family income in the United States with a correlation coefficient (R) of -0.410 and weighted average of $87,191, a difference of 14.4%.
Median Family Income Correlation Summary
| Measurement | Houma | Immigrants from Guatemala |
| Minimum | $35,539 | $27,406 |
| Maximum | $102,344 | $125,307 |
| Range | $66,805 | $97,901 |
| Mean | $71,438 | $72,495 |
| Median | $75,379 | $71,855 |
| Interquartile 25% (IQ1) | $58,820 | $56,716 |
| Interquartile 75% (IQ3) | $82,023 | $85,579 |
| Interquartile Range (IQR) | $23,203 | $28,864 |
| Standard Deviation (Sample) | $16,513 | $19,880 |
| Standard Deviation (Population) | $16,226 | $19,735 |
Similar Demographics by Median Family Income
Demographics Similar to Houma by Median Family Income
In terms of median family income, the demographic groups most similar to Houma are Crow ($76,605, a difference of 0.55%), Pueblo ($76,880, a difference of 0.91%), Hopi ($77,188, a difference of 1.3%), Pima ($77,431, a difference of 1.6%), and Immigrants from Yemen ($77,457, a difference of 1.7%).
| Demographics | Rating | Rank | Median Family Income |
| Kiowa | 0.0 /100 | #333 | Tragic $80,885 |
| Menominee | 0.0 /100 | #334 | Tragic $79,563 |
| Yup'ik | 0.0 /100 | #335 | Tragic $79,290 |
| Immigrants | Cuba | 0.0 /100 | #336 | Tragic $78,249 |
| Yuman | 0.0 /100 | #337 | Tragic $78,055 |
| Immigrants | Yemen | 0.0 /100 | #338 | Tragic $77,457 |
| Pima | 0.0 /100 | #339 | Tragic $77,431 |
| Hopi | 0.0 /100 | #340 | Tragic $77,188 |
| Pueblo | 0.0 /100 | #341 | Tragic $76,880 |
| Crow | 0.0 /100 | #342 | Tragic $76,605 |
| Houma | 0.0 /100 | #343 | Tragic $76,188 |
| Tohono O'odham | 0.0 /100 | #344 | Tragic $72,193 |
| Navajo | 0.0 /100 | #345 | Tragic $70,989 |
| Puerto Ricans | 0.0 /100 | #346 | Tragic $70,423 |
| Lumbee | 0.0 /100 | #347 | Tragic $68,679 |
Demographics Similar to Immigrants from Guatemala by Median Family Income
In terms of median family income, the demographic groups most similar to Immigrants from Guatemala are Cajun ($87,157, a difference of 0.040%), Yaqui ($87,289, a difference of 0.11%), Fijian ($87,387, a difference of 0.22%), Immigrants from Latin America ($86,989, a difference of 0.23%), and Chippewa ($86,852, a difference of 0.39%).
| Demographics | Rating | Rank | Median Family Income |
| Central American Indians | 0.1 /100 | #289 | Tragic $88,034 |
| Shoshone | 0.1 /100 | #290 | Tragic $87,872 |
| Immigrants | Cabo Verde | 0.1 /100 | #291 | Tragic $87,830 |
| Africans | 0.1 /100 | #292 | Tragic $87,820 |
| Ute | 0.0 /100 | #293 | Tragic $87,596 |
| Fijians | 0.0 /100 | #294 | Tragic $87,387 |
| Yaqui | 0.0 /100 | #295 | Tragic $87,289 |
| Immigrants | Guatemala | 0.0 /100 | #296 | Tragic $87,191 |
| Cajuns | 0.0 /100 | #297 | Tragic $87,157 |
| Immigrants | Latin America | 0.0 /100 | #298 | Tragic $86,989 |
| Chippewa | 0.0 /100 | #299 | Tragic $86,852 |
| Ottawa | 0.0 /100 | #300 | Tragic $86,380 |
| Colville | 0.0 /100 | #301 | Tragic $85,792 |
| Spanish American Indians | 0.0 /100 | #302 | Tragic $85,728 |
| Hispanics or Latinos | 0.0 /100 | #303 | Tragic $85,647 |