Houma vs Dutch West Indian Median Family Income
COMPARE
Houma
Dutch West Indian
Median Family Income
Median Family Income Comparison
Houma
Dutch West Indians
$76,188
MEDIAN FAMILY INCOME
0.0/ 100
METRIC RATING
343rd/ 347
METRIC RANK
$81,852
MEDIAN FAMILY INCOME
0.0/ 100
METRIC RATING
329th/ 347
METRIC RANK
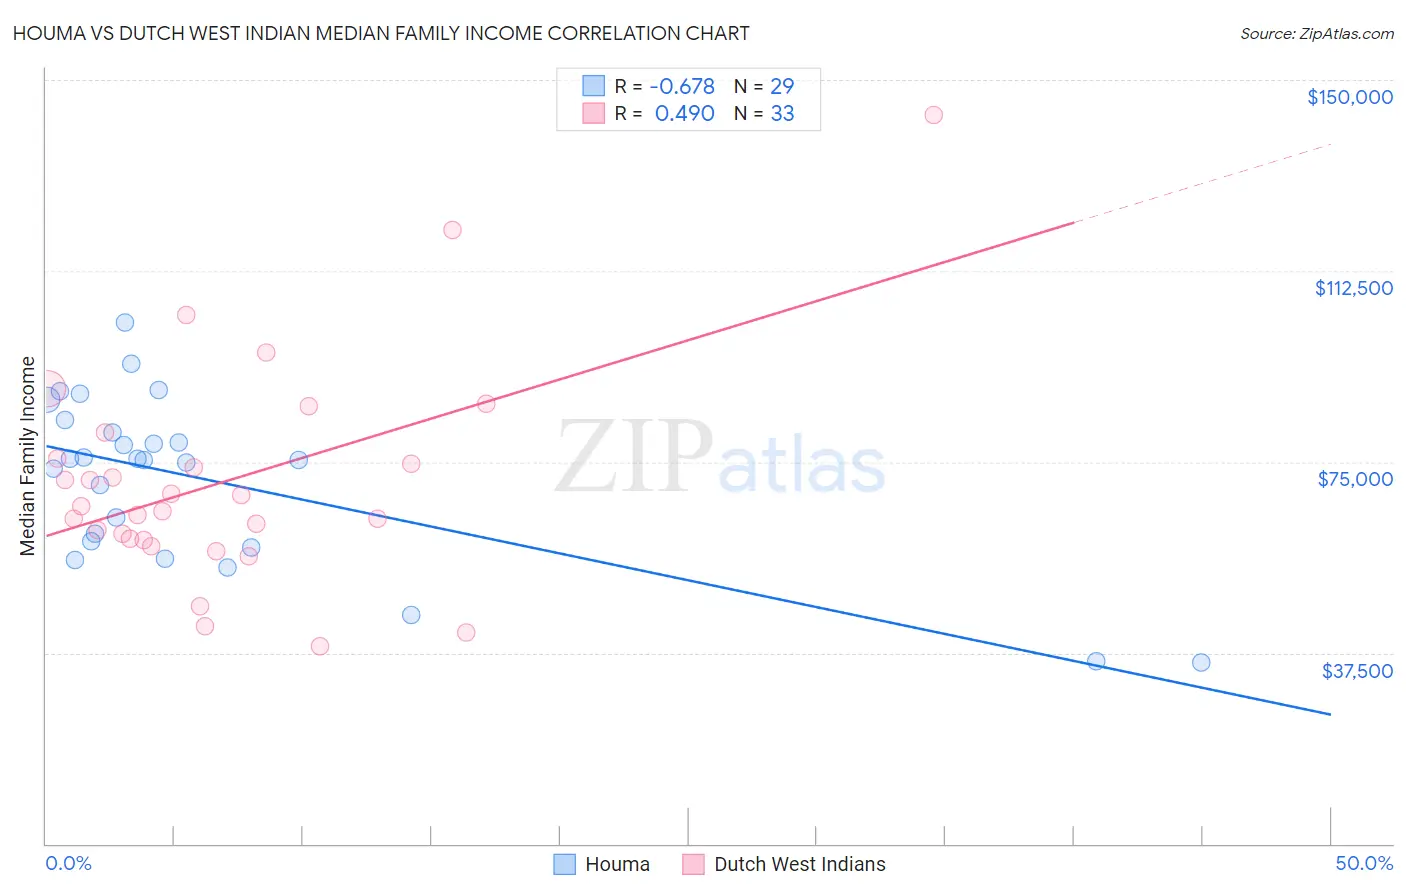
Houma vs Dutch West Indian Median Family Income Correlation Chart
The statistical analysis conducted on geographies consisting of 36,790,797 people shows a significant negative correlation between the proportion of Houma and median family income in the United States with a correlation coefficient (R) of -0.678 and weighted average of $76,188. Similarly, the statistical analysis conducted on geographies consisting of 85,761,161 people shows a moderate positive correlation between the proportion of Dutch West Indians and median family income in the United States with a correlation coefficient (R) of 0.490 and weighted average of $81,852, a difference of 7.4%.
Median Family Income Correlation Summary
| Measurement | Houma | Dutch West Indian |
| Minimum | $35,539 | $38,750 |
| Maximum | $102,344 | $143,036 |
| Range | $66,805 | $104,286 |
| Mean | $71,438 | $71,323 |
| Median | $75,379 | $66,291 |
| Interquartile 25% (IQ1) | $58,820 | $59,737 |
| Interquartile 75% (IQ3) | $82,023 | $78,266 |
| Interquartile Range (IQR) | $23,203 | $18,529 |
| Standard Deviation (Sample) | $16,513 | $21,583 |
| Standard Deviation (Population) | $16,226 | $21,254 |
Demographics Similar to Houma and Dutch West Indians by Median Family Income
In terms of median family income, the demographic groups most similar to Houma are Crow ($76,605, a difference of 0.55%), Pueblo ($76,880, a difference of 0.91%), Hopi ($77,188, a difference of 1.3%), Pima ($77,431, a difference of 1.6%), and Immigrants from Yemen ($77,457, a difference of 1.7%). Similarly, the demographic groups most similar to Dutch West Indians are Black/African American ($81,912, a difference of 0.070%), Arapaho ($82,064, a difference of 0.26%), Immigrants from Congo ($82,216, a difference of 0.45%), Cheyenne ($81,385, a difference of 0.57%), and Immigrants from Dominican Republic ($81,233, a difference of 0.76%).
| Demographics | Rating | Rank | Median Family Income |
| Immigrants | Congo | 0.0 /100 | #326 | Tragic $82,216 |
| Arapaho | 0.0 /100 | #327 | Tragic $82,064 |
| Blacks/African Americans | 0.0 /100 | #328 | Tragic $81,912 |
| Dutch West Indians | 0.0 /100 | #329 | Tragic $81,852 |
| Cheyenne | 0.0 /100 | #330 | Tragic $81,385 |
| Immigrants | Dominican Republic | 0.0 /100 | #331 | Tragic $81,233 |
| Natives/Alaskans | 0.0 /100 | #332 | Tragic $80,908 |
| Kiowa | 0.0 /100 | #333 | Tragic $80,885 |
| Menominee | 0.0 /100 | #334 | Tragic $79,563 |
| Yup'ik | 0.0 /100 | #335 | Tragic $79,290 |
| Immigrants | Cuba | 0.0 /100 | #336 | Tragic $78,249 |
| Yuman | 0.0 /100 | #337 | Tragic $78,055 |
| Immigrants | Yemen | 0.0 /100 | #338 | Tragic $77,457 |
| Pima | 0.0 /100 | #339 | Tragic $77,431 |
| Hopi | 0.0 /100 | #340 | Tragic $77,188 |
| Pueblo | 0.0 /100 | #341 | Tragic $76,880 |
| Crow | 0.0 /100 | #342 | Tragic $76,605 |
| Houma | 0.0 /100 | #343 | Tragic $76,188 |
| Tohono O'odham | 0.0 /100 | #344 | Tragic $72,193 |
| Navajo | 0.0 /100 | #345 | Tragic $70,989 |
| Puerto Ricans | 0.0 /100 | #346 | Tragic $70,423 |