Houma vs Immigrants from the Azores Median Family Income
COMPARE
Houma
Immigrants from the Azores
Median Family Income
Median Family Income Comparison
Houma
Immigrants from the Azores
$76,188
MEDIAN FAMILY INCOME
0.0/ 100
METRIC RATING
343rd/ 347
METRIC RANK
$95,402
MEDIAN FAMILY INCOME
2.4/ 100
METRIC RATING
228th/ 347
METRIC RANK
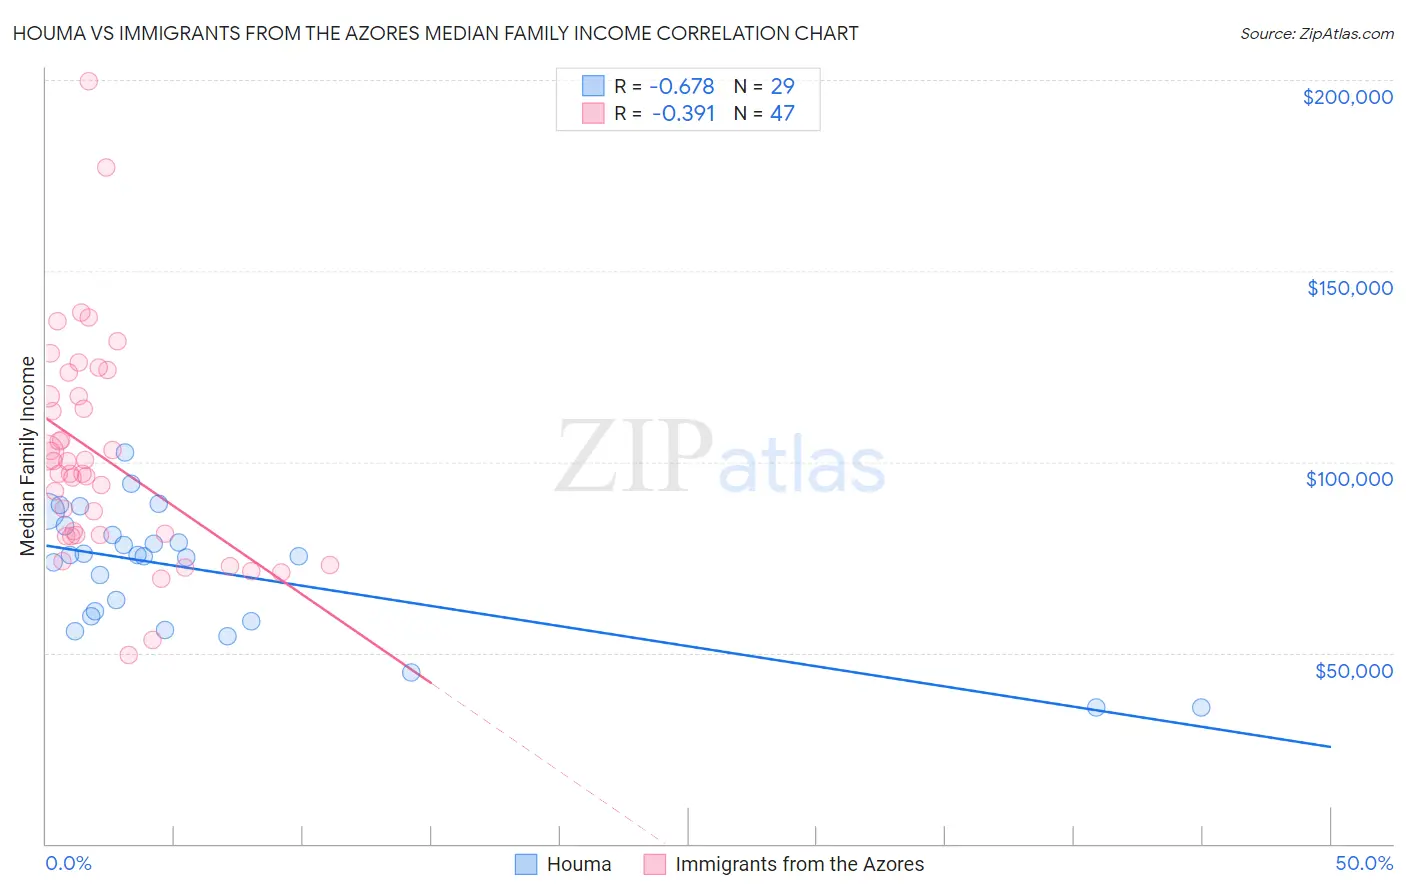
Houma vs Immigrants from the Azores Median Family Income Correlation Chart
The statistical analysis conducted on geographies consisting of 36,790,797 people shows a significant negative correlation between the proportion of Houma and median family income in the United States with a correlation coefficient (R) of -0.678 and weighted average of $76,188. Similarly, the statistical analysis conducted on geographies consisting of 46,255,736 people shows a mild negative correlation between the proportion of Immigrants from the Azores and median family income in the United States with a correlation coefficient (R) of -0.391 and weighted average of $95,402, a difference of 25.2%.
Median Family Income Correlation Summary
| Measurement | Houma | Immigrants from the Azores |
| Minimum | $35,539 | $49,583 |
| Maximum | $102,344 | $199,510 |
| Range | $66,805 | $149,927 |
| Mean | $71,438 | $101,435 |
| Median | $75,379 | $96,945 |
| Interquartile 25% (IQ1) | $58,820 | $80,714 |
| Interquartile 75% (IQ3) | $82,023 | $117,338 |
| Interquartile Range (IQR) | $23,203 | $36,624 |
| Standard Deviation (Sample) | $16,513 | $28,827 |
| Standard Deviation (Population) | $16,226 | $28,519 |
Similar Demographics by Median Family Income
Demographics Similar to Houma by Median Family Income
In terms of median family income, the demographic groups most similar to Houma are Crow ($76,605, a difference of 0.55%), Pueblo ($76,880, a difference of 0.91%), Hopi ($77,188, a difference of 1.3%), Pima ($77,431, a difference of 1.6%), and Immigrants from Yemen ($77,457, a difference of 1.7%).
| Demographics | Rating | Rank | Median Family Income |
| Kiowa | 0.0 /100 | #333 | Tragic $80,885 |
| Menominee | 0.0 /100 | #334 | Tragic $79,563 |
| Yup'ik | 0.0 /100 | #335 | Tragic $79,290 |
| Immigrants | Cuba | 0.0 /100 | #336 | Tragic $78,249 |
| Yuman | 0.0 /100 | #337 | Tragic $78,055 |
| Immigrants | Yemen | 0.0 /100 | #338 | Tragic $77,457 |
| Pima | 0.0 /100 | #339 | Tragic $77,431 |
| Hopi | 0.0 /100 | #340 | Tragic $77,188 |
| Pueblo | 0.0 /100 | #341 | Tragic $76,880 |
| Crow | 0.0 /100 | #342 | Tragic $76,605 |
| Houma | 0.0 /100 | #343 | Tragic $76,188 |
| Tohono O'odham | 0.0 /100 | #344 | Tragic $72,193 |
| Navajo | 0.0 /100 | #345 | Tragic $70,989 |
| Puerto Ricans | 0.0 /100 | #346 | Tragic $70,423 |
| Lumbee | 0.0 /100 | #347 | Tragic $68,679 |
Demographics Similar to Immigrants from the Azores by Median Family Income
In terms of median family income, the demographic groups most similar to Immigrants from the Azores are Marshallese ($95,293, a difference of 0.11%), Alaska Native ($95,573, a difference of 0.18%), Malaysian ($95,230, a difference of 0.18%), Immigrants from Panama ($95,647, a difference of 0.26%), and Ecuadorian ($95,114, a difference of 0.30%).
| Demographics | Rating | Rank | Median Family Income |
| Immigrants | Ghana | 4.2 /100 | #221 | Tragic $96,544 |
| Immigrants | Nigeria | 4.0 /100 | #222 | Tragic $96,439 |
| Venezuelans | 3.7 /100 | #223 | Tragic $96,281 |
| Immigrants | Nonimmigrants | 3.6 /100 | #224 | Tragic $96,231 |
| Vietnamese | 3.4 /100 | #225 | Tragic $96,123 |
| Immigrants | Panama | 2.7 /100 | #226 | Tragic $95,647 |
| Alaska Natives | 2.6 /100 | #227 | Tragic $95,573 |
| Immigrants | Azores | 2.4 /100 | #228 | Tragic $95,402 |
| Marshallese | 2.2 /100 | #229 | Tragic $95,293 |
| Malaysians | 2.2 /100 | #230 | Tragic $95,230 |
| Ecuadorians | 2.1 /100 | #231 | Tragic $95,114 |
| Immigrants | Venezuela | 1.9 /100 | #232 | Tragic $94,904 |
| Immigrants | Bangladesh | 1.6 /100 | #233 | Tragic $94,665 |
| Immigrants | Western Africa | 1.6 /100 | #234 | Tragic $94,638 |
| Immigrants | Burma/Myanmar | 1.5 /100 | #235 | Tragic $94,472 |