Iroquois vs Norwegian Median Family Income
COMPARE
Iroquois
Norwegian
Median Family Income
Median Family Income Comparison
Iroquois
Norwegians
$90,543
MEDIAN FAMILY INCOME
0.2/ 100
METRIC RATING
271st/ 347
METRIC RANK
$106,144
MEDIAN FAMILY INCOME
85.5/ 100
METRIC RATING
140th/ 347
METRIC RANK
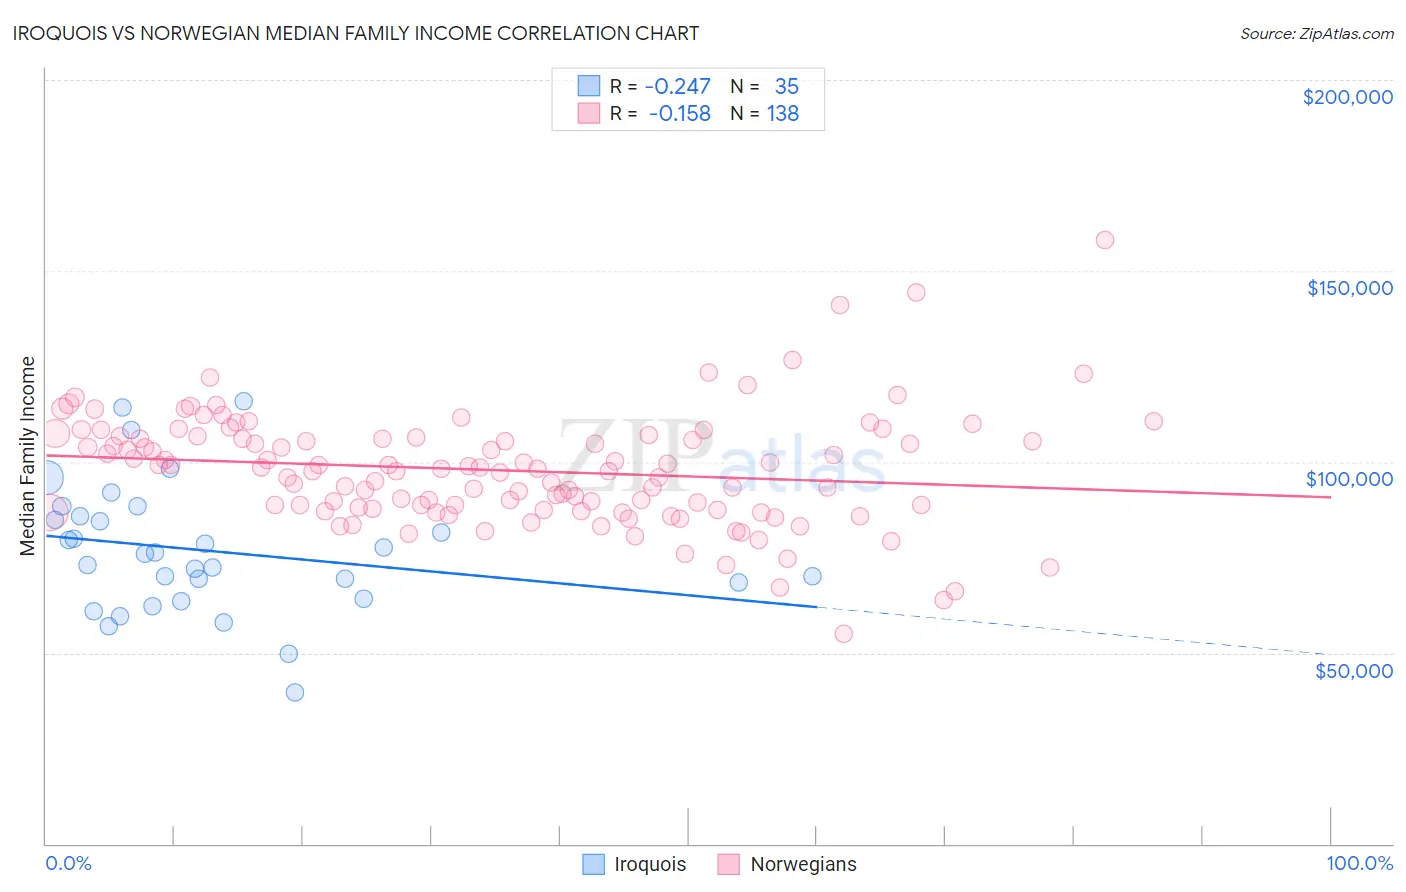
Iroquois vs Norwegian Median Family Income Correlation Chart
The statistical analysis conducted on geographies consisting of 207,203,022 people shows a weak negative correlation between the proportion of Iroquois and median family income in the United States with a correlation coefficient (R) of -0.247 and weighted average of $90,543. Similarly, the statistical analysis conducted on geographies consisting of 532,482,890 people shows a poor negative correlation between the proportion of Norwegians and median family income in the United States with a correlation coefficient (R) of -0.158 and weighted average of $106,144, a difference of 17.2%.
Median Family Income Correlation Summary
| Measurement | Iroquois | Norwegian |
| Minimum | $39,479 | $55,000 |
| Maximum | $115,891 | $158,125 |
| Range | $76,412 | $103,125 |
| Mean | $76,689 | $97,803 |
| Median | $75,795 | $98,173 |
| Interquartile 25% (IQ1) | $64,141 | $87,829 |
| Interquartile 75% (IQ3) | $85,646 | $106,302 |
| Interquartile Range (IQR) | $21,505 | $18,473 |
| Standard Deviation (Sample) | $16,973 | $14,847 |
| Standard Deviation (Population) | $16,729 | $14,793 |
Similar Demographics by Median Family Income
Demographics Similar to Iroquois by Median Family Income
In terms of median family income, the demographic groups most similar to Iroquois are Jamaican ($90,581, a difference of 0.040%), Immigrants from Liberia ($90,450, a difference of 0.10%), Immigrants from Micronesia ($90,345, a difference of 0.22%), Spanish American ($90,322, a difference of 0.24%), and Cree ($90,882, a difference of 0.37%).
| Demographics | Rating | Rank | Median Family Income |
| Senegalese | 0.3 /100 | #264 | Tragic $91,475 |
| Hmong | 0.3 /100 | #265 | Tragic $91,296 |
| Central Americans | 0.3 /100 | #266 | Tragic $91,087 |
| Mexican American Indians | 0.2 /100 | #267 | Tragic $90,918 |
| Cree | 0.2 /100 | #268 | Tragic $90,882 |
| Belizeans | 0.2 /100 | #269 | Tragic $90,880 |
| Jamaicans | 0.2 /100 | #270 | Tragic $90,581 |
| Iroquois | 0.2 /100 | #271 | Tragic $90,543 |
| Immigrants | Liberia | 0.2 /100 | #272 | Tragic $90,450 |
| Immigrants | Micronesia | 0.2 /100 | #273 | Tragic $90,345 |
| Spanish Americans | 0.2 /100 | #274 | Tragic $90,322 |
| Immigrants | St. Vincent and the Grenadines | 0.2 /100 | #275 | Tragic $90,094 |
| Immigrants | Zaire | 0.1 /100 | #276 | Tragic $89,285 |
| Immigrants | Jamaica | 0.1 /100 | #277 | Tragic $89,268 |
| Immigrants | Grenada | 0.1 /100 | #278 | Tragic $89,249 |
Demographics Similar to Norwegians by Median Family Income
In terms of median family income, the demographic groups most similar to Norwegians are Immigrants from Syria ($106,118, a difference of 0.020%), Immigrants from Uganda ($106,188, a difference of 0.040%), Immigrants from Vietnam ($106,186, a difference of 0.040%), Luxembourger ($106,183, a difference of 0.040%), and Immigrants from South Eastern Asia ($106,252, a difference of 0.10%).
| Demographics | Rating | Rank | Median Family Income |
| Ugandans | 87.8 /100 | #133 | Excellent $106,541 |
| Immigrants | Oceania | 87.3 /100 | #134 | Excellent $106,453 |
| Portuguese | 86.3 /100 | #135 | Excellent $106,286 |
| Immigrants | South Eastern Asia | 86.1 /100 | #136 | Excellent $106,252 |
| Immigrants | Uganda | 85.7 /100 | #137 | Excellent $106,188 |
| Immigrants | Vietnam | 85.7 /100 | #138 | Excellent $106,186 |
| Luxembourgers | 85.7 /100 | #139 | Excellent $106,183 |
| Norwegians | 85.5 /100 | #140 | Excellent $106,144 |
| Immigrants | Syria | 85.3 /100 | #141 | Excellent $106,118 |
| Slovenes | 84.7 /100 | #142 | Excellent $106,020 |
| Tongans | 84.3 /100 | #143 | Excellent $105,967 |
| Immigrants | Morocco | 84.3 /100 | #144 | Excellent $105,964 |
| Danes | 83.8 /100 | #145 | Excellent $105,900 |
| Czechs | 83.4 /100 | #146 | Excellent $105,839 |
| Immigrants | Chile | 82.1 /100 | #147 | Excellent $105,655 |