Greek vs Norwegian Median Family Income
COMPARE
Greek
Norwegian
Median Family Income
Median Family Income Comparison
Greeks
Norwegians
$115,192
MEDIAN FAMILY INCOME
99.8/ 100
METRIC RATING
57th/ 347
METRIC RANK
$106,144
MEDIAN FAMILY INCOME
85.5/ 100
METRIC RATING
140th/ 347
METRIC RANK
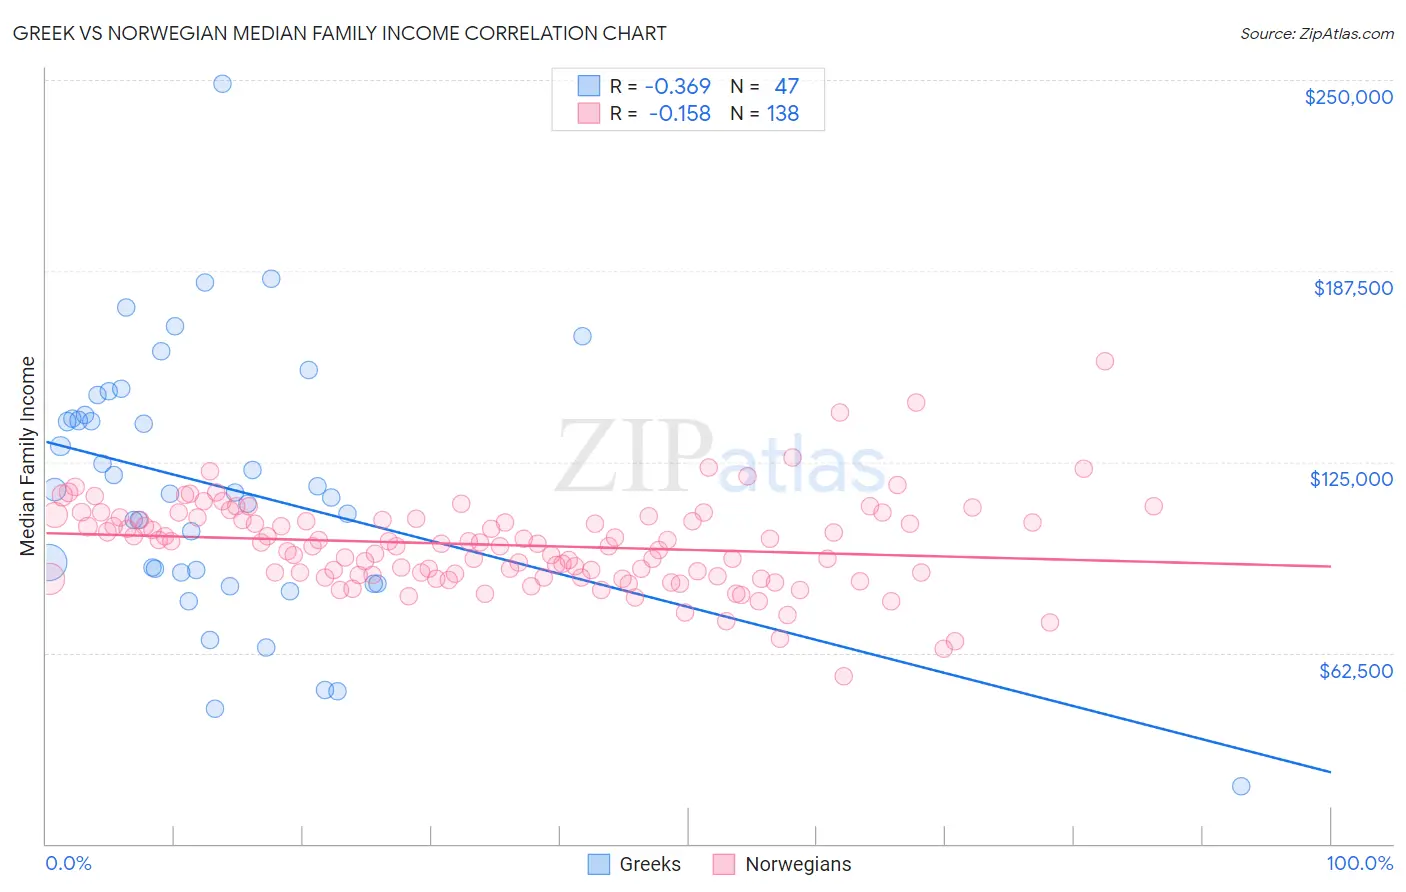
Greek vs Norwegian Median Family Income Correlation Chart
The statistical analysis conducted on geographies consisting of 482,131,670 people shows a mild negative correlation between the proportion of Greeks and median family income in the United States with a correlation coefficient (R) of -0.369 and weighted average of $115,192. Similarly, the statistical analysis conducted on geographies consisting of 532,482,890 people shows a poor negative correlation between the proportion of Norwegians and median family income in the United States with a correlation coefficient (R) of -0.158 and weighted average of $106,144, a difference of 8.5%.
Median Family Income Correlation Summary
| Measurement | Greek | Norwegian |
| Minimum | $18,825 | $55,000 |
| Maximum | $248,750 | $158,125 |
| Range | $229,925 | $103,125 |
| Mean | $116,811 | $97,803 |
| Median | $115,024 | $98,173 |
| Interquartile 25% (IQ1) | $88,890 | $87,829 |
| Interquartile 75% (IQ3) | $140,272 | $106,302 |
| Interquartile Range (IQR) | $51,382 | $18,473 |
| Standard Deviation (Sample) | $42,578 | $14,847 |
| Standard Deviation (Population) | $42,122 | $14,793 |
Similar Demographics by Median Family Income
Demographics Similar to Greeks by Median Family Income
In terms of median family income, the demographic groups most similar to Greeks are New Zealander ($115,230, a difference of 0.030%), Immigrants from Indonesia ($115,162, a difference of 0.030%), Lithuanian ($115,395, a difference of 0.18%), Immigrants from Netherlands ($114,987, a difference of 0.18%), and Immigrants from Europe ($115,523, a difference of 0.29%).
| Demographics | Rating | Rank | Median Family Income |
| Immigrants | Czechoslovakia | 99.9 /100 | #50 | Exceptional $116,165 |
| Immigrants | Malaysia | 99.9 /100 | #51 | Exceptional $115,880 |
| Maltese | 99.9 /100 | #52 | Exceptional $115,862 |
| Immigrants | Norway | 99.9 /100 | #53 | Exceptional $115,847 |
| Immigrants | Europe | 99.9 /100 | #54 | Exceptional $115,523 |
| Lithuanians | 99.8 /100 | #55 | Exceptional $115,395 |
| New Zealanders | 99.8 /100 | #56 | Exceptional $115,230 |
| Greeks | 99.8 /100 | #57 | Exceptional $115,192 |
| Immigrants | Indonesia | 99.8 /100 | #58 | Exceptional $115,162 |
| Immigrants | Netherlands | 99.8 /100 | #59 | Exceptional $114,987 |
| Immigrants | Latvia | 99.8 /100 | #60 | Exceptional $114,826 |
| Immigrants | Belarus | 99.8 /100 | #61 | Exceptional $114,586 |
| Mongolians | 99.8 /100 | #62 | Exceptional $114,553 |
| Immigrants | Pakistan | 99.8 /100 | #63 | Exceptional $114,406 |
| Immigrants | Scotland | 99.7 /100 | #64 | Exceptional $114,392 |
Demographics Similar to Norwegians by Median Family Income
In terms of median family income, the demographic groups most similar to Norwegians are Immigrants from Syria ($106,118, a difference of 0.020%), Immigrants from Uganda ($106,188, a difference of 0.040%), Immigrants from Vietnam ($106,186, a difference of 0.040%), Luxembourger ($106,183, a difference of 0.040%), and Immigrants from South Eastern Asia ($106,252, a difference of 0.10%).
| Demographics | Rating | Rank | Median Family Income |
| Ugandans | 87.8 /100 | #133 | Excellent $106,541 |
| Immigrants | Oceania | 87.3 /100 | #134 | Excellent $106,453 |
| Portuguese | 86.3 /100 | #135 | Excellent $106,286 |
| Immigrants | South Eastern Asia | 86.1 /100 | #136 | Excellent $106,252 |
| Immigrants | Uganda | 85.7 /100 | #137 | Excellent $106,188 |
| Immigrants | Vietnam | 85.7 /100 | #138 | Excellent $106,186 |
| Luxembourgers | 85.7 /100 | #139 | Excellent $106,183 |
| Norwegians | 85.5 /100 | #140 | Excellent $106,144 |
| Immigrants | Syria | 85.3 /100 | #141 | Excellent $106,118 |
| Slovenes | 84.7 /100 | #142 | Excellent $106,020 |
| Tongans | 84.3 /100 | #143 | Excellent $105,967 |
| Immigrants | Morocco | 84.3 /100 | #144 | Excellent $105,964 |
| Danes | 83.8 /100 | #145 | Excellent $105,900 |
| Czechs | 83.4 /100 | #146 | Excellent $105,839 |
| Immigrants | Chile | 82.1 /100 | #147 | Excellent $105,655 |