Houma vs Immigrants from Caribbean Median Family Income
COMPARE
Houma
Immigrants from Caribbean
Median Family Income
Median Family Income Comparison
Houma
Immigrants from Caribbean
$76,188
MEDIAN FAMILY INCOME
0.0/ 100
METRIC RATING
343rd/ 347
METRIC RANK
$83,319
MEDIAN FAMILY INCOME
0.0/ 100
METRIC RATING
321st/ 347
METRIC RANK
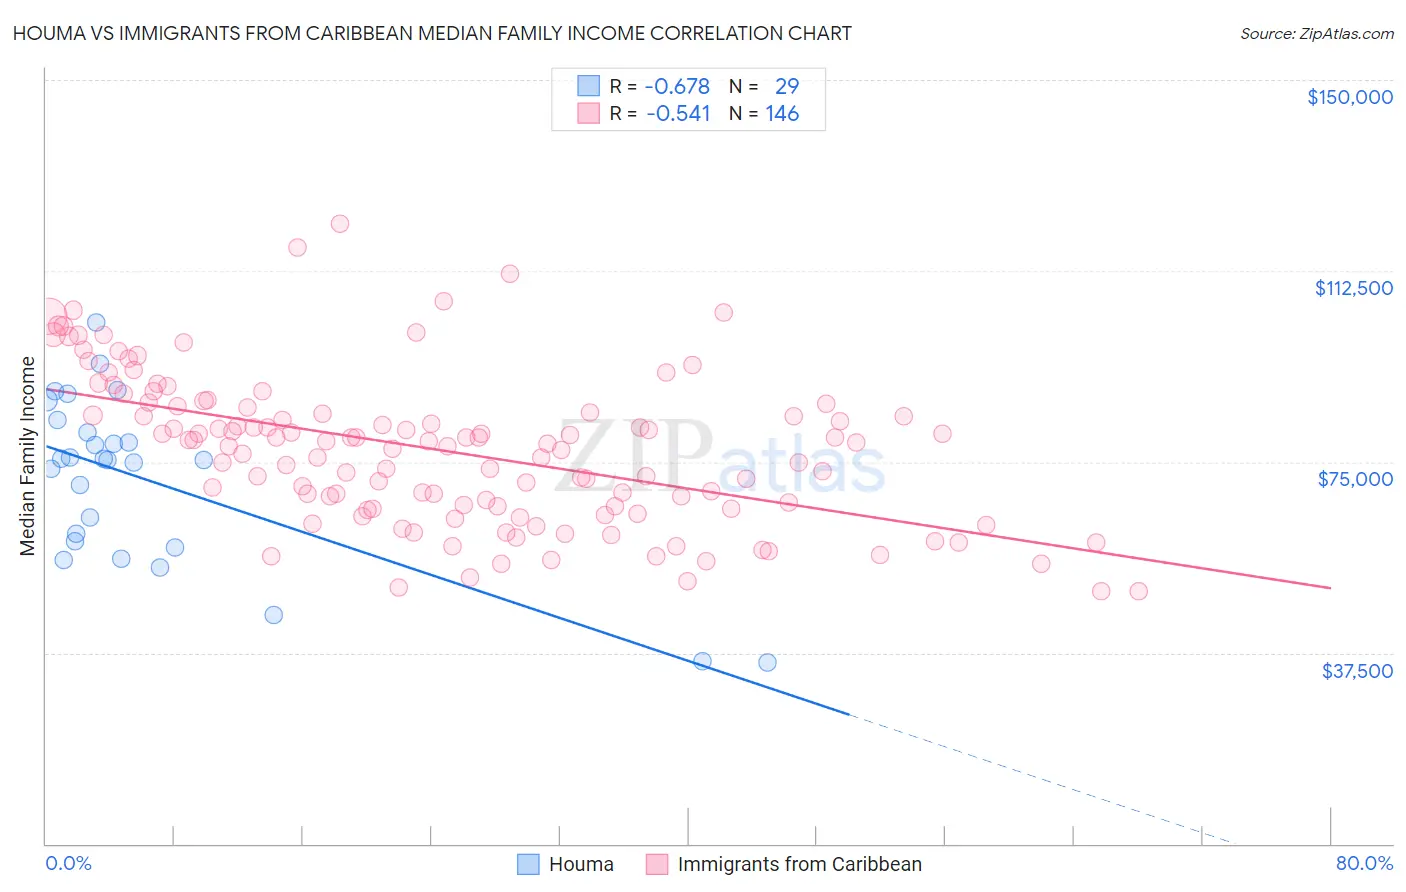
Houma vs Immigrants from Caribbean Median Family Income Correlation Chart
The statistical analysis conducted on geographies consisting of 36,790,797 people shows a significant negative correlation between the proportion of Houma and median family income in the United States with a correlation coefficient (R) of -0.678 and weighted average of $76,188. Similarly, the statistical analysis conducted on geographies consisting of 449,450,188 people shows a substantial negative correlation between the proportion of Immigrants from Caribbean and median family income in the United States with a correlation coefficient (R) of -0.541 and weighted average of $83,319, a difference of 9.4%.
Median Family Income Correlation Summary
| Measurement | Houma | Immigrants from Caribbean |
| Minimum | $35,539 | $49,547 |
| Maximum | $102,344 | $121,711 |
| Range | $66,805 | $72,164 |
| Mean | $71,438 | $77,294 |
| Median | $75,379 | $78,717 |
| Interquartile 25% (IQ1) | $58,820 | $66,192 |
| Interquartile 75% (IQ3) | $82,023 | $85,685 |
| Interquartile Range (IQR) | $23,203 | $19,492 |
| Standard Deviation (Sample) | $16,513 | $14,692 |
| Standard Deviation (Population) | $16,226 | $14,641 |
Similar Demographics by Median Family Income
Demographics Similar to Houma by Median Family Income
In terms of median family income, the demographic groups most similar to Houma are Crow ($76,605, a difference of 0.55%), Pueblo ($76,880, a difference of 0.91%), Hopi ($77,188, a difference of 1.3%), Pima ($77,431, a difference of 1.6%), and Immigrants from Yemen ($77,457, a difference of 1.7%).
| Demographics | Rating | Rank | Median Family Income |
| Kiowa | 0.0 /100 | #333 | Tragic $80,885 |
| Menominee | 0.0 /100 | #334 | Tragic $79,563 |
| Yup'ik | 0.0 /100 | #335 | Tragic $79,290 |
| Immigrants | Cuba | 0.0 /100 | #336 | Tragic $78,249 |
| Yuman | 0.0 /100 | #337 | Tragic $78,055 |
| Immigrants | Yemen | 0.0 /100 | #338 | Tragic $77,457 |
| Pima | 0.0 /100 | #339 | Tragic $77,431 |
| Hopi | 0.0 /100 | #340 | Tragic $77,188 |
| Pueblo | 0.0 /100 | #341 | Tragic $76,880 |
| Crow | 0.0 /100 | #342 | Tragic $76,605 |
| Houma | 0.0 /100 | #343 | Tragic $76,188 |
| Tohono O'odham | 0.0 /100 | #344 | Tragic $72,193 |
| Navajo | 0.0 /100 | #345 | Tragic $70,989 |
| Puerto Ricans | 0.0 /100 | #346 | Tragic $70,423 |
| Lumbee | 0.0 /100 | #347 | Tragic $68,679 |
Demographics Similar to Immigrants from Caribbean by Median Family Income
In terms of median family income, the demographic groups most similar to Immigrants from Caribbean are Seminole ($83,354, a difference of 0.040%), Immigrants from Honduras ($83,618, a difference of 0.36%), Immigrants from Mexico ($83,639, a difference of 0.38%), Dominican ($82,888, a difference of 0.52%), and Yakama ($83,932, a difference of 0.74%).
| Demographics | Rating | Rank | Median Family Income |
| Immigrants | Bahamas | 0.0 /100 | #314 | Tragic $84,732 |
| Apache | 0.0 /100 | #315 | Tragic $84,451 |
| Immigrants | Haiti | 0.0 /100 | #316 | Tragic $84,018 |
| Yakama | 0.0 /100 | #317 | Tragic $83,932 |
| Immigrants | Mexico | 0.0 /100 | #318 | Tragic $83,639 |
| Immigrants | Honduras | 0.0 /100 | #319 | Tragic $83,618 |
| Seminole | 0.0 /100 | #320 | Tragic $83,354 |
| Immigrants | Caribbean | 0.0 /100 | #321 | Tragic $83,319 |
| Dominicans | 0.0 /100 | #322 | Tragic $82,888 |
| Bahamians | 0.0 /100 | #323 | Tragic $82,631 |
| Creek | 0.0 /100 | #324 | Tragic $82,560 |
| Sioux | 0.0 /100 | #325 | Tragic $82,386 |
| Immigrants | Congo | 0.0 /100 | #326 | Tragic $82,216 |
| Arapaho | 0.0 /100 | #327 | Tragic $82,064 |
| Blacks/African Americans | 0.0 /100 | #328 | Tragic $81,912 |