Houma vs Guyanese Median Family Income
COMPARE
Houma
Guyanese
Median Family Income
Median Family Income Comparison
Houma
Guyanese
$76,188
MEDIAN FAMILY INCOME
0.0/ 100
METRIC RATING
343rd/ 347
METRIC RANK
$93,373
MEDIAN FAMILY INCOME
0.9/ 100
METRIC RATING
246th/ 347
METRIC RANK
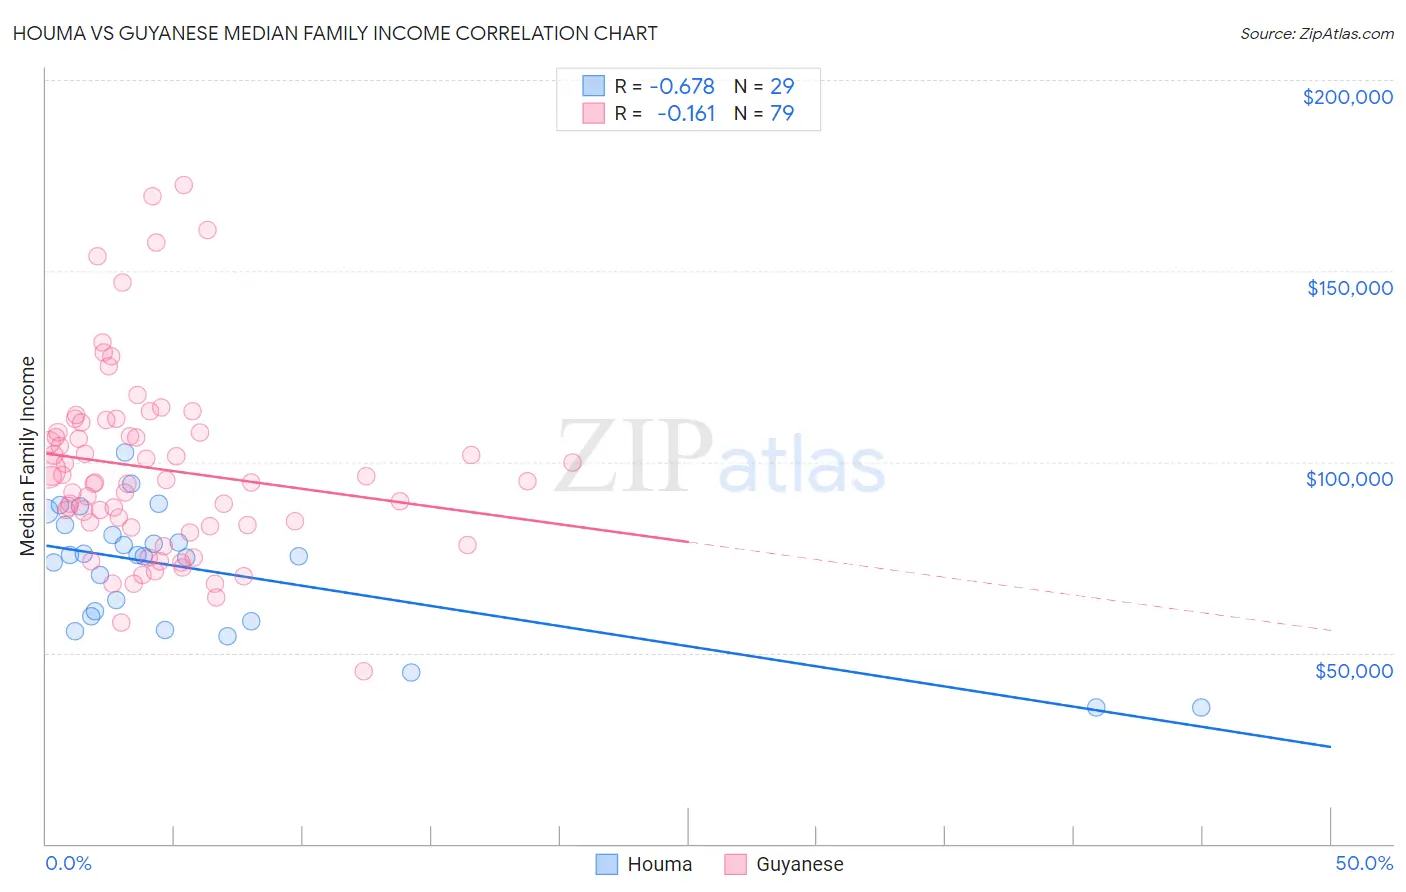
Houma vs Guyanese Median Family Income Correlation Chart
The statistical analysis conducted on geographies consisting of 36,790,797 people shows a significant negative correlation between the proportion of Houma and median family income in the United States with a correlation coefficient (R) of -0.678 and weighted average of $76,188. Similarly, the statistical analysis conducted on geographies consisting of 176,743,960 people shows a poor negative correlation between the proportion of Guyanese and median family income in the United States with a correlation coefficient (R) of -0.161 and weighted average of $93,373, a difference of 22.6%.
Median Family Income Correlation Summary
| Measurement | Houma | Guyanese |
| Minimum | $35,539 | $45,100 |
| Maximum | $102,344 | $172,597 |
| Range | $66,805 | $127,497 |
| Mean | $71,438 | $98,114 |
| Median | $75,379 | $94,843 |
| Interquartile 25% (IQ1) | $58,820 | $83,119 |
| Interquartile 75% (IQ3) | $82,023 | $107,693 |
| Interquartile Range (IQR) | $23,203 | $24,574 |
| Standard Deviation (Sample) | $16,513 | $24,573 |
| Standard Deviation (Population) | $16,226 | $24,417 |
Similar Demographics by Median Family Income
Demographics Similar to Houma by Median Family Income
In terms of median family income, the demographic groups most similar to Houma are Crow ($76,605, a difference of 0.55%), Pueblo ($76,880, a difference of 0.91%), Hopi ($77,188, a difference of 1.3%), Pima ($77,431, a difference of 1.6%), and Immigrants from Yemen ($77,457, a difference of 1.7%).
| Demographics | Rating | Rank | Median Family Income |
| Kiowa | 0.0 /100 | #333 | Tragic $80,885 |
| Menominee | 0.0 /100 | #334 | Tragic $79,563 |
| Yup'ik | 0.0 /100 | #335 | Tragic $79,290 |
| Immigrants | Cuba | 0.0 /100 | #336 | Tragic $78,249 |
| Yuman | 0.0 /100 | #337 | Tragic $78,055 |
| Immigrants | Yemen | 0.0 /100 | #338 | Tragic $77,457 |
| Pima | 0.0 /100 | #339 | Tragic $77,431 |
| Hopi | 0.0 /100 | #340 | Tragic $77,188 |
| Pueblo | 0.0 /100 | #341 | Tragic $76,880 |
| Crow | 0.0 /100 | #342 | Tragic $76,605 |
| Houma | 0.0 /100 | #343 | Tragic $76,188 |
| Tohono O'odham | 0.0 /100 | #344 | Tragic $72,193 |
| Navajo | 0.0 /100 | #345 | Tragic $70,989 |
| Puerto Ricans | 0.0 /100 | #346 | Tragic $70,423 |
| Lumbee | 0.0 /100 | #347 | Tragic $68,679 |
Demographics Similar to Guyanese by Median Family Income
In terms of median family income, the demographic groups most similar to Guyanese are Immigrants from Middle Africa ($93,593, a difference of 0.23%), Subsaharan African ($93,748, a difference of 0.40%), Immigrants from Senegal ($92,912, a difference of 0.50%), German Russian ($93,858, a difference of 0.52%), and French American Indian ($92,872, a difference of 0.54%).
| Demographics | Rating | Rank | Median Family Income |
| Salvadorans | 1.2 /100 | #239 | Tragic $94,109 |
| Somalis | 1.2 /100 | #240 | Tragic $94,085 |
| Immigrants | Trinidad and Tobago | 1.2 /100 | #241 | Tragic $93,988 |
| Barbadians | 1.1 /100 | #242 | Tragic $93,919 |
| German Russians | 1.1 /100 | #243 | Tragic $93,858 |
| Sub-Saharan Africans | 1.0 /100 | #244 | Tragic $93,748 |
| Immigrants | Middle Africa | 1.0 /100 | #245 | Tragic $93,593 |
| Guyanese | 0.9 /100 | #246 | Tragic $93,373 |
| Immigrants | Senegal | 0.7 /100 | #247 | Tragic $92,912 |
| French American Indians | 0.7 /100 | #248 | Tragic $92,872 |
| Immigrants | Ecuador | 0.7 /100 | #249 | Tragic $92,837 |
| West Indians | 0.6 /100 | #250 | Tragic $92,765 |
| Immigrants | Somalia | 0.6 /100 | #251 | Tragic $92,609 |
| Immigrants | El Salvador | 0.6 /100 | #252 | Tragic $92,545 |
| Immigrants | Guyana | 0.6 /100 | #253 | Tragic $92,513 |