Spanish vs Immigrants from Sierra Leone Median Family Income
COMPARE
Spanish
Immigrants from Sierra Leone
Median Family Income
Median Family Income Comparison
Spanish
Immigrants from Sierra Leone
$99,977
MEDIAN FAMILY INCOME
20.1/ 100
METRIC RATING
200th/ 347
METRIC RANK
$103,990
MEDIAN FAMILY INCOME
66.2/ 100
METRIC RATING
162nd/ 347
METRIC RANK
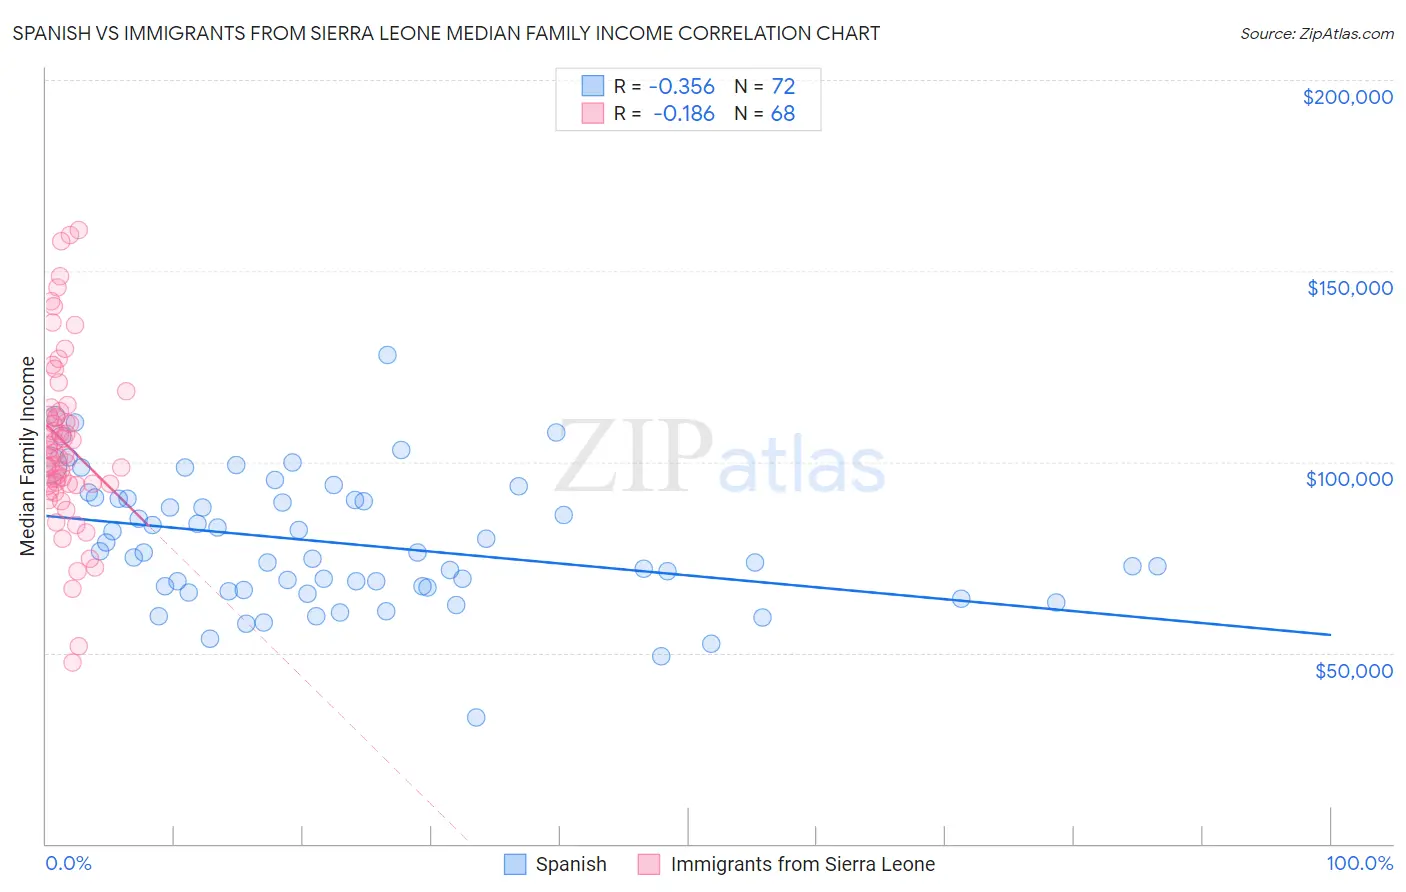
Spanish vs Immigrants from Sierra Leone Median Family Income Correlation Chart
The statistical analysis conducted on geographies consisting of 421,758,667 people shows a mild negative correlation between the proportion of Spanish and median family income in the United States with a correlation coefficient (R) of -0.356 and weighted average of $99,977. Similarly, the statistical analysis conducted on geographies consisting of 101,644,998 people shows a poor negative correlation between the proportion of Immigrants from Sierra Leone and median family income in the United States with a correlation coefficient (R) of -0.186 and weighted average of $103,990, a difference of 4.0%.
Median Family Income Correlation Summary
| Measurement | Spanish | Immigrants from Sierra Leone |
| Minimum | $32,992 | $47,578 |
| Maximum | $127,945 | $160,863 |
| Range | $94,953 | $113,285 |
| Mean | $78,597 | $105,117 |
| Median | $75,704 | $102,019 |
| Interquartile 25% (IQ1) | $66,829 | $94,047 |
| Interquartile 75% (IQ3) | $90,296 | $113,626 |
| Interquartile Range (IQR) | $23,466 | $19,580 |
| Standard Deviation (Sample) | $17,174 | $22,846 |
| Standard Deviation (Population) | $17,054 | $22,677 |
Similar Demographics by Median Family Income
Demographics Similar to Spanish by Median Family Income
In terms of median family income, the demographic groups most similar to Spanish are Yugoslavian ($100,119, a difference of 0.14%), Immigrants from Thailand ($99,840, a difference of 0.14%), White/Caucasian ($99,800, a difference of 0.18%), Immigrants from Africa ($100,256, a difference of 0.28%), and Immigrants from Cameroon ($100,289, a difference of 0.31%).
| Demographics | Rating | Rank | Median Family Income |
| Iraqis | 26.3 /100 | #193 | Fair $100,658 |
| Uruguayans | 26.3 /100 | #194 | Fair $100,656 |
| Immigrants | South America | 23.9 /100 | #195 | Fair $100,414 |
| Samoans | 23.3 /100 | #196 | Fair $100,344 |
| Immigrants | Cameroon | 22.8 /100 | #197 | Fair $100,289 |
| Immigrants | Africa | 22.5 /100 | #198 | Fair $100,256 |
| Yugoslavians | 21.3 /100 | #199 | Fair $100,119 |
| Spanish | 20.1 /100 | #200 | Fair $99,977 |
| Immigrants | Thailand | 19.0 /100 | #201 | Poor $99,840 |
| Whites/Caucasians | 18.7 /100 | #202 | Poor $99,800 |
| Scotch-Irish | 17.1 /100 | #203 | Poor $99,591 |
| Ghanaians | 12.6 /100 | #204 | Poor $98,877 |
| Hawaiians | 12.5 /100 | #205 | Poor $98,869 |
| Immigrants | Iraq | 12.1 /100 | #206 | Poor $98,786 |
| Aleuts | 11.6 /100 | #207 | Poor $98,702 |
Demographics Similar to Immigrants from Sierra Leone by Median Family Income
In terms of median family income, the demographic groups most similar to Immigrants from Sierra Leone are Costa Rican ($103,989, a difference of 0.0%), Sierra Leonean ($103,859, a difference of 0.13%), Slovak ($103,729, a difference of 0.25%), Icelander ($104,282, a difference of 0.28%), and Scottish ($104,288, a difference of 0.29%).
| Demographics | Rating | Rank | Median Family Income |
| Native Hawaiians | 75.8 /100 | #155 | Good $104,910 |
| Basques | 74.4 /100 | #156 | Good $104,760 |
| Moroccans | 71.6 /100 | #157 | Good $104,488 |
| Scandinavians | 70.8 /100 | #158 | Good $104,410 |
| Swiss | 70.7 /100 | #159 | Good $104,396 |
| Scottish | 69.5 /100 | #160 | Good $104,288 |
| Icelanders | 69.4 /100 | #161 | Good $104,282 |
| Immigrants | Sierra Leone | 66.2 /100 | #162 | Good $103,990 |
| Costa Ricans | 66.2 /100 | #163 | Good $103,989 |
| Sierra Leoneans | 64.7 /100 | #164 | Good $103,859 |
| Slovaks | 63.1 /100 | #165 | Good $103,729 |
| English | 62.6 /100 | #166 | Good $103,684 |
| South American Indians | 61.9 /100 | #167 | Good $103,624 |
| Immigrants | Peru | 60.8 /100 | #168 | Good $103,534 |
| Czechoslovakians | 57.6 /100 | #169 | Average $103,273 |