Somali vs Immigrants from Sierra Leone Median Family Income
COMPARE
Somali
Immigrants from Sierra Leone
Median Family Income
Median Family Income Comparison
Somalis
Immigrants from Sierra Leone
$94,085
MEDIAN FAMILY INCOME
1.2/ 100
METRIC RATING
240th/ 347
METRIC RANK
$103,990
MEDIAN FAMILY INCOME
66.2/ 100
METRIC RATING
162nd/ 347
METRIC RANK
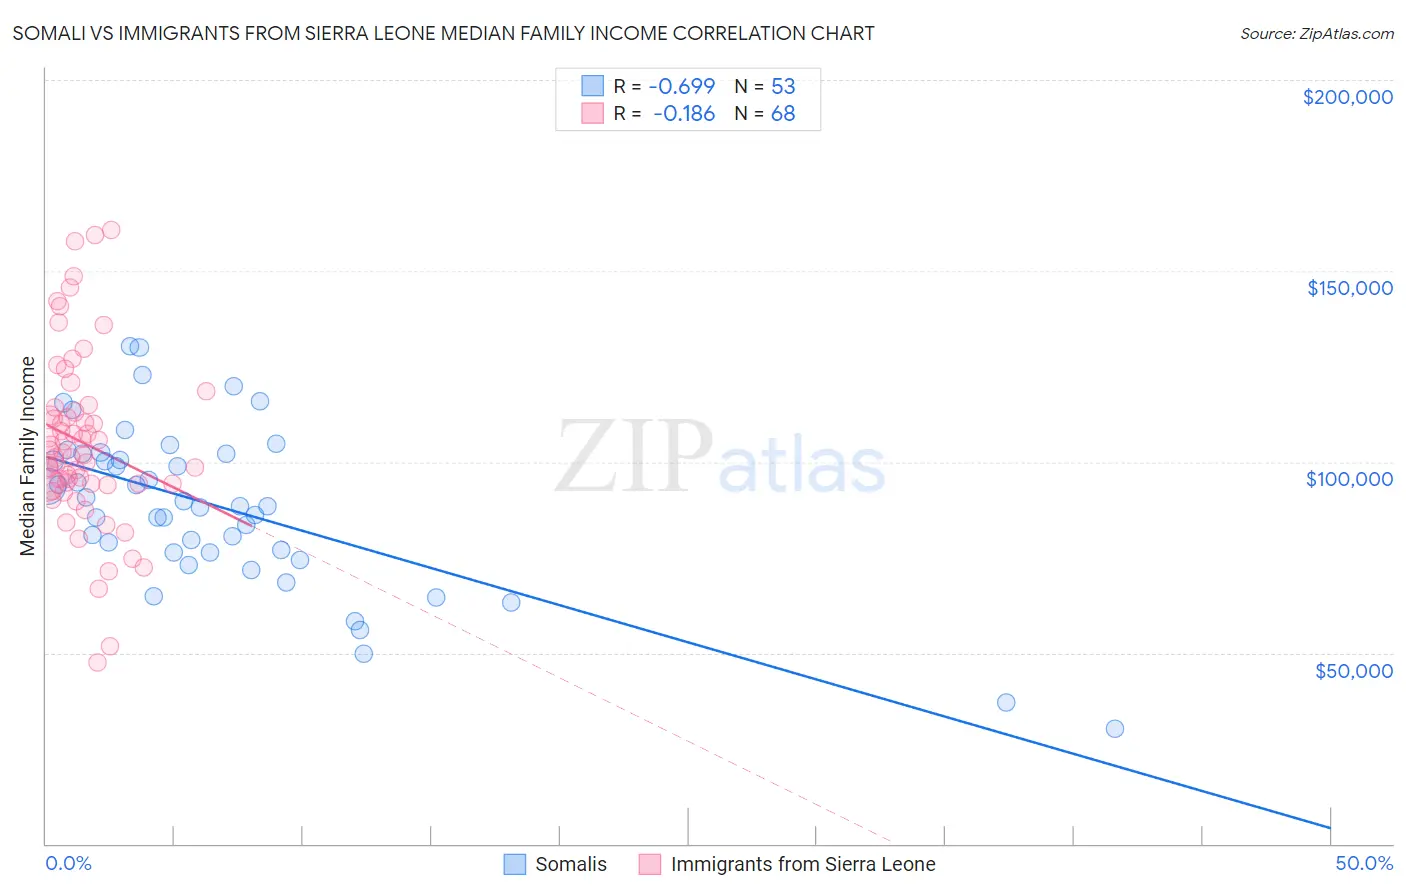
Somali vs Immigrants from Sierra Leone Median Family Income Correlation Chart
The statistical analysis conducted on geographies consisting of 99,278,232 people shows a significant negative correlation between the proportion of Somalis and median family income in the United States with a correlation coefficient (R) of -0.699 and weighted average of $94,085. Similarly, the statistical analysis conducted on geographies consisting of 101,644,998 people shows a poor negative correlation between the proportion of Immigrants from Sierra Leone and median family income in the United States with a correlation coefficient (R) of -0.186 and weighted average of $103,990, a difference of 10.5%.
Median Family Income Correlation Summary
| Measurement | Somali | Immigrants from Sierra Leone |
| Minimum | $29,978 | $47,578 |
| Maximum | $130,246 | $160,863 |
| Range | $100,268 | $113,285 |
| Mean | $88,236 | $105,117 |
| Median | $88,476 | $102,019 |
| Interquartile 25% (IQ1) | $76,386 | $94,047 |
| Interquartile 75% (IQ3) | $102,172 | $113,626 |
| Interquartile Range (IQR) | $25,786 | $19,580 |
| Standard Deviation (Sample) | $21,250 | $22,846 |
| Standard Deviation (Population) | $21,049 | $22,677 |
Similar Demographics by Median Family Income
Demographics Similar to Somalis by Median Family Income
In terms of median family income, the demographic groups most similar to Somalis are Salvadoran ($94,109, a difference of 0.030%), Nepalese ($94,153, a difference of 0.070%), Immigrants from Trinidad and Tobago ($93,988, a difference of 0.10%), Barbadian ($93,919, a difference of 0.18%), and German Russian ($93,858, a difference of 0.24%).
| Demographics | Rating | Rank | Median Family Income |
| Immigrants | Bangladesh | 1.6 /100 | #233 | Tragic $94,665 |
| Immigrants | Western Africa | 1.6 /100 | #234 | Tragic $94,638 |
| Immigrants | Burma/Myanmar | 1.5 /100 | #235 | Tragic $94,472 |
| Trinidadians and Tobagonians | 1.5 /100 | #236 | Tragic $94,466 |
| Alaskan Athabascans | 1.5 /100 | #237 | Tragic $94,429 |
| Nepalese | 1.3 /100 | #238 | Tragic $94,153 |
| Salvadorans | 1.2 /100 | #239 | Tragic $94,109 |
| Somalis | 1.2 /100 | #240 | Tragic $94,085 |
| Immigrants | Trinidad and Tobago | 1.2 /100 | #241 | Tragic $93,988 |
| Barbadians | 1.1 /100 | #242 | Tragic $93,919 |
| German Russians | 1.1 /100 | #243 | Tragic $93,858 |
| Sub-Saharan Africans | 1.0 /100 | #244 | Tragic $93,748 |
| Immigrants | Middle Africa | 1.0 /100 | #245 | Tragic $93,593 |
| Guyanese | 0.9 /100 | #246 | Tragic $93,373 |
| Immigrants | Senegal | 0.7 /100 | #247 | Tragic $92,912 |
Demographics Similar to Immigrants from Sierra Leone by Median Family Income
In terms of median family income, the demographic groups most similar to Immigrants from Sierra Leone are Costa Rican ($103,989, a difference of 0.0%), Sierra Leonean ($103,859, a difference of 0.13%), Slovak ($103,729, a difference of 0.25%), Icelander ($104,282, a difference of 0.28%), and Scottish ($104,288, a difference of 0.29%).
| Demographics | Rating | Rank | Median Family Income |
| Native Hawaiians | 75.8 /100 | #155 | Good $104,910 |
| Basques | 74.4 /100 | #156 | Good $104,760 |
| Moroccans | 71.6 /100 | #157 | Good $104,488 |
| Scandinavians | 70.8 /100 | #158 | Good $104,410 |
| Swiss | 70.7 /100 | #159 | Good $104,396 |
| Scottish | 69.5 /100 | #160 | Good $104,288 |
| Icelanders | 69.4 /100 | #161 | Good $104,282 |
| Immigrants | Sierra Leone | 66.2 /100 | #162 | Good $103,990 |
| Costa Ricans | 66.2 /100 | #163 | Good $103,989 |
| Sierra Leoneans | 64.7 /100 | #164 | Good $103,859 |
| Slovaks | 63.1 /100 | #165 | Good $103,729 |
| English | 62.6 /100 | #166 | Good $103,684 |
| South American Indians | 61.9 /100 | #167 | Good $103,624 |
| Immigrants | Peru | 60.8 /100 | #168 | Good $103,534 |
| Czechoslovakians | 57.6 /100 | #169 | Average $103,273 |