Houma vs Immigrants from the Azores Unemployment Among Ages 60 to 64 years

COMPARE

Houma
Race
Ancestry
AfghanAfricanAlaska NativeAlaskan AthabascanAlbanianAleutAlsatianAmericanApacheArabArapahoArgentineanArmenianAssyrian/Chaldean/SyriacAustralianAustrianBahamianBangladeshiBarbadianBasqueBelgianBelizeanBermudanBhutaneseBlackfeetBolivianBrazilianBritishBritish West IndianBulgarianBurmeseCajunCambodianCanadianCape VerdeanCarpatho RusynCelticCentral AmericanCentral American IndianCherokeeCheyenneChickasawChileanChineseChippewaChoctawColombianColvilleComancheCosta RicanCreeCreekCroatianCrowCubanCypriotCzechCzechoslovakianDanishDelawareDominicanDutchDutch West IndianEastern EuropeanEcuadorianEgyptianEnglishEstonianEthiopianEuropeanFijianFilipinoFinnishFrenchFrench American IndianFrench CanadianGermanGerman RussianGhanaianGreekGuamanian/ChamorroGuatemalanGuyaneseHaitianHmongHonduranHopiHoumaHungarianIcelanderIndian (Asian)IndonesianInupiatIranianIraqiIrishIroquoisIsraeliItalianJamaicanJapaneseJordanianKenyanKiowaKoreanLaotianLatvianLebaneseLiberianLithuanianLumbeeLuxembourgerMacedonianMalaysianMalteseMarshalleseMenomineeMexicanMexican American IndianMongolianMoroccanNative HawaiianNavajoNepaleseNew ZealanderNicaraguanNigerianNorthern EuropeanNorwegianOkinawanOsageOttawaPaiutePakistaniPalestinianPanamanianParaguayanPennsylvania GermanPeruvianPimaPolishPortuguesePotawatomiPuebloPuerto RicanPuget Sound SalishRomanianRussianSalvadoranSamoanScandinavianScotch-IrishScottishSeminoleSenegaleseSerbianShoshoneSierra LeoneanSiouxSlavicSlovakSloveneSomaliSouth AfricanSouth AmericanSouth American IndianSoviet UnionSpaniardSpanishSpanish AmericanSpanish American IndianSri LankanSubsaharan AfricanSudaneseSwedishSwissSyrianTaiwaneseThaiTlingit-HaidaTohono O'OdhamTonganTrinidadian and TobagonianTsimshianTurkishU.S. Virgin IslanderUgandanUkrainianUruguayanUteVenezuelanVietnameseWelshWest IndianYakamaYaquiYugoslavianYumanYup'ikZimbabwean
Immigration
NonimmigrantsImmigrantsAfghanistanAfricaAlbaniaArgentinaArmeniaAsiaAustraliaAustriaBahamasBangladeshBarbadosBelarusBelgiumBelizeBoliviaBosnia and HerzegovinaBrazilBulgariaBurma/MyanmarCabo VerdeCambodiaCameroonCanadaCaribbeanCentral AmericaChileChinaColombiaCongoCosta RicaCroatiaCubaCzechoslovakiaDenmarkDominicaDominican RepublicEastern AfricaEastern AsiaEastern EuropeEcuadorEgyptEl SalvadorEnglandEritreaEthiopiaEuropeFijiFranceGermanyGhanaGreeceGrenadaGuatemalaGuyanaHaitiHondurasHong KongHungaryIndiaIndonesiaIranIraqIrelandIsraelItalyJamaicaJapanJordanKazakhstanKenyaKoreaKuwaitLaosLatin AmericaLatviaLebanonLiberiaLithuaniaMalaysiaMexicoMicronesiaMiddle AfricaMoldovaMoroccoNepalNetherlandsNicaraguaNigeriaNorth AmericaNorth MacedoniaNorthern AfricaNorthern EuropeNorwayOceaniaPakistanPanamaPeruPhilippinesPolandPortugalRomaniaRussiaSaudi ArabiaScotlandSenegalSerbiaSierra LeoneSingaporeSomaliaSouth AfricaSouth AmericaSouth Central AsiaSouth Eastern AsiaSouthern EuropeSpainSri LankaSt. Vincent and the GrenadinesSudanSwedenSwitzerlandSyriaTaiwanThailandTrinidad and TobagoTurkeyUgandaUkraineUruguayUzbekistanVenezuelaVietnamWest IndiesWestern AfricaWestern AsiaWestern EuropeYemenZaireZimbabwe
Immigrants from the Azores
Race
Ancestry
AfghanAfricanAlaska NativeAlaskan AthabascanAlbanianAleutAlsatianAmericanApacheArabArapahoArgentineanArmenianAssyrian/Chaldean/SyriacAustralianAustrianBahamianBangladeshiBarbadianBasqueBelgianBelizeanBermudanBhutaneseBlackfeetBolivianBrazilianBritishBritish West IndianBulgarianBurmeseCajunCambodianCanadianCape VerdeanCarpatho RusynCelticCentral AmericanCentral American IndianCherokeeCheyenneChickasawChileanChineseChippewaChoctawColombianColvilleComancheCosta RicanCreeCreekCroatianCrowCubanCypriotCzechCzechoslovakianDanishDelawareDominicanDutchDutch West IndianEastern EuropeanEcuadorianEgyptianEnglishEstonianEthiopianEuropeanFijianFilipinoFinnishFrenchFrench American IndianFrench CanadianGermanGerman RussianGhanaianGreekGuamanian/ChamorroGuatemalanGuyaneseHaitianHmongHonduranHopiHungarianIcelanderIndian (Asian)IndonesianInupiatIranianIraqiIrishIroquoisIsraeliItalianJamaicanJapaneseJordanianKenyanKiowaKoreanLaotianLatvianLebaneseLiberianLithuanianLumbeeLuxembourgerMacedonianMalaysianMalteseMarshalleseMenomineeMexicanMexican American IndianMongolianMoroccanNative HawaiianNavajoNepaleseNew ZealanderNicaraguanNigerianNorthern EuropeanNorwegianOkinawanOsageOttawaPaiutePakistaniPalestinianPanamanianParaguayanPennsylvania GermanPeruvianPimaPolishPortuguesePotawatomiPuebloPuerto RicanPuget Sound SalishRomanianRussianSalvadoranSamoanScandinavianScotch-IrishScottishSeminoleSenegaleseSerbianShoshoneSierra LeoneanSiouxSlavicSlovakSloveneSomaliSouth AfricanSouth AmericanSouth American IndianSoviet UnionSpaniardSpanishSpanish AmericanSpanish American IndianSri LankanSubsaharan AfricanSudaneseSwedishSwissSyrianTaiwaneseThaiTlingit-HaidaTohono O'OdhamTonganTrinidadian and TobagonianTsimshianTurkishU.S. Virgin IslanderUgandanUkrainianUruguayanUteVenezuelanVietnameseWelshWest IndianYakamaYaquiYugoslavianYumanYup'ikZimbabwean
Immigration
NonimmigrantsImmigrantsAfghanistanAfricaAlbaniaArgentinaArmeniaAsiaAustraliaAustriaBahamasBangladeshBarbadosBelarusBelgiumBelizeBoliviaBosnia and HerzegovinaBrazilBulgariaBurma/MyanmarCabo VerdeCambodiaCameroonCanadaCaribbeanCentral AmericaChileChinaColombiaCongoCosta RicaCroatiaCubaCzechoslovakiaDenmarkDominicaDominican RepublicEastern AfricaEastern AsiaEastern EuropeEcuadorEgyptEl SalvadorEnglandEritreaEthiopiaEuropeFijiFranceGermanyGhanaGreeceGrenadaGuatemalaGuyanaHaitiHondurasHong KongHungaryIndiaIndonesiaIranIraqIrelandIsraelItalyJamaicaJapanJordanKazakhstanKenyaKoreaKuwaitLaosLatin AmericaLatviaLebanonLiberiaLithuaniaMalaysiaMexicoMicronesiaMiddle AfricaMoldovaMoroccoNepalNetherlandsNicaraguaNigeriaNorth AmericaNorth MacedoniaNorthern AfricaNorthern EuropeNorwayOceaniaPakistanPanamaPeruPhilippinesPolandPortugalRomaniaRussiaSaudi ArabiaScotlandSenegalSerbiaSierra LeoneSingaporeSomaliaSouth AfricaSouth AmericaSouth Central AsiaSouth Eastern AsiaSouthern EuropeSpainSri LankaSt. Vincent and the GrenadinesSudanSwedenSwitzerlandSyriaTaiwanThailandTrinidad and TobagoTurkeyUgandaUkraineUruguayUzbekistanVenezuelaVietnamWest IndiesWestern AfricaWestern AsiaWestern EuropeYemenZaireZimbabweAzores
Unemployment Among Ages 60 to 64 years
Income
Poverty
Unemployment
Labor Participation
Family Structure
Vehicle Availability
Education Level
Disability

Unemployment Among Ages 60 to 64 years Comparison

Houma

Immigrants from the Azores

Fair
Exceptional
4.9%
UNEMPLOYMENT AMONG AGES 60 TO 64 YEARS
28.3/ 100
METRIC RATING
193rd/ 347
METRIC RANK
4.0%
UNEMPLOYMENT AMONG AGES 60 TO 64 YEARS
100.0/ 100
METRIC RATING
5th/ 347
METRIC RANK

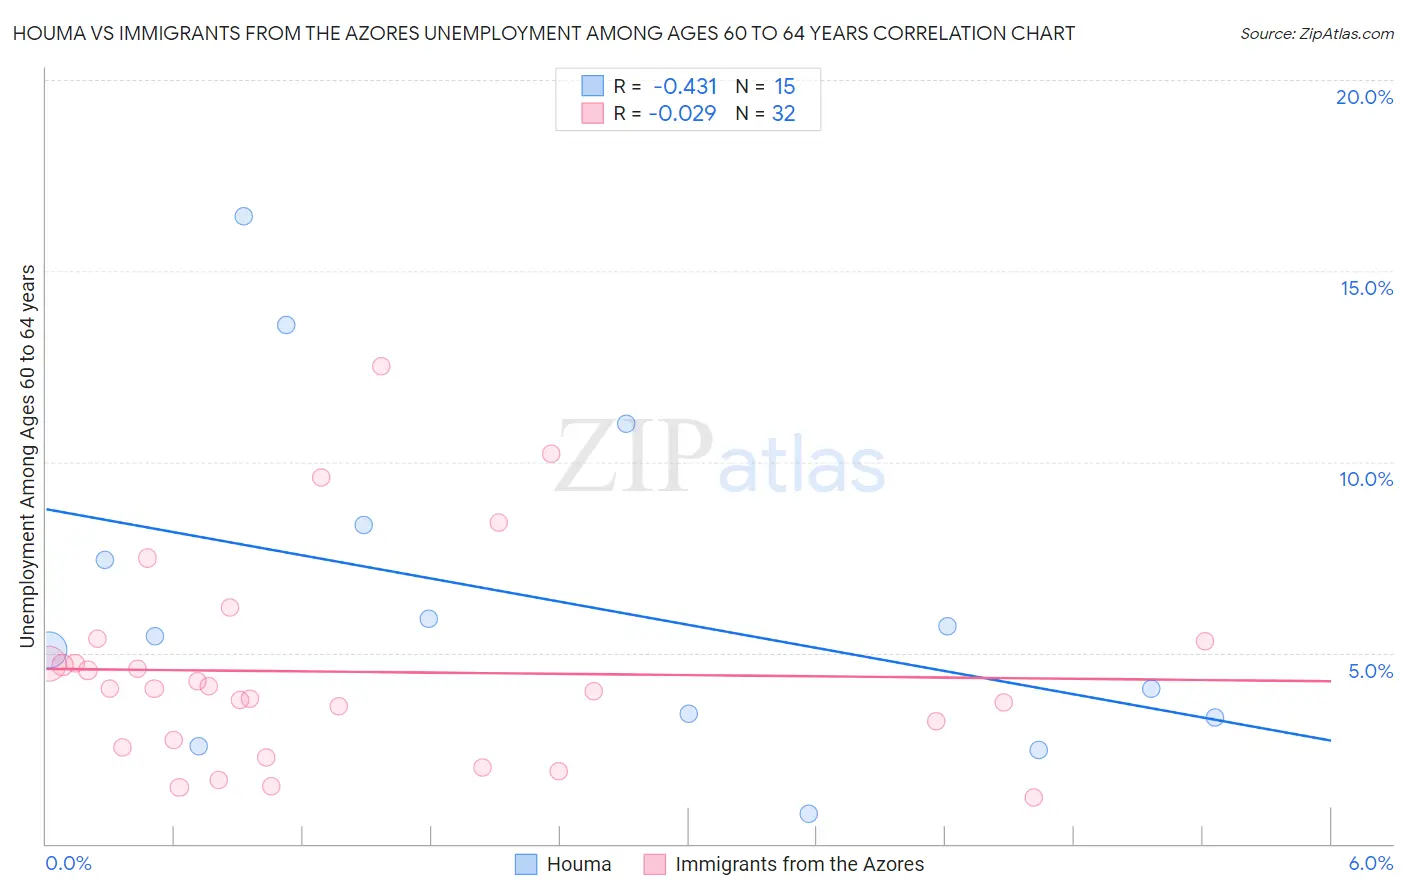
Houma vs Immigrants from the Azores Unemployment Among Ages 60 to 64 years Correlation Chart

The statistical analysis conducted on geographies consisting of 35,391,990 people shows a moderate negative correlation between the proportion of Houma and unemployment rate among population between the ages 60 and 64 in the United States with a correlation coefficient (R) of -0.431 and weighted average of 4.9%. Similarly, the statistical analysis conducted on geographies consisting of 44,749,105 people shows no correlation between the proportion of Immigrants from the Azores and unemployment rate among population between the ages 60 and 64 in the United States with a correlation coefficient (R) of -0.029 and weighted average of 4.0%, a difference of 21.9%.
Houma vs Immigrants from the Azores Unemployment Among Ages 60 to 64 years

Unemployment Among Ages 60 to 64 years Correlation Summary

MeasurementHoumaImmigrants from the Azores
Minimum0.80%1.2%
Maximum16.4%12.5%
Range15.6%11.3%
Mean6.4%4.5%
Median5.4%4.1%
Interquartile 25% (IQ1)3.3%2.6%
Interquartile 75% (IQ3)8.3%5.0%
Interquartile Range (IQR)5.0%2.4%
Standard Deviation (Sample)4.4%2.7%
Standard Deviation (Population)4.2%2.6%

Similar Demographics by Unemployment Among Ages 60 to 64 years

Demographics Similar to Houma by Unemployment Among Ages 60 to 64 years

In terms of unemployment among ages 60 to 64 years, the demographic groups most similar to Houma are Menominee (4.9%, a difference of 0.020%), Immigrants from Nigeria (4.9%, a difference of 0.050%), Immigrants from Nicaragua (4.9%, a difference of 0.060%), Immigrants from Europe (4.9%, a difference of 0.060%), and Immigrants from Colombia (4.9%, a difference of 0.070%).
DemographicsRating | RankUnemployment Among Ages 60 to 64 years
Spaniards
35.8
/100
|
#186
Fair
4.9%
South American Indians
31.2
/100
|
#187
Fair
4.9%
Nicaraguans
30.4
/100
|
#188
Fair
4.9%
Immigrants | Nicaragua
29.8
/100
|
#189
Fair
4.9%
Immigrants | Europe
29.8
/100
|
#190
Fair
4.9%
Immigrants | Nigeria
29.6
/100
|
#191
Fair
4.9%
Menominee
28.8
/100
|
#192
Fair
4.9%
Houma
28.3
/100
|
#193
Fair
4.9%
Immigrants | Colombia
26.8
/100
|
#194
Fair
4.9%
Immigrants | Austria
26.6
/100
|
#195
Fair
4.9%
Immigrants | Asia
25.7
/100
|
#196
Fair
4.9%
Immigrants | Eastern Europe
25.2
/100
|
#197
Fair
4.9%
Guamanians/Chamorros
23.7
/100
|
#198
Fair
4.9%
Immigrants | Vietnam
23.7
/100
|
#199
Fair
4.9%
Immigrants | Czechoslovakia
23.5
/100
|
#200
Fair
4.9%

Demographics Similar to Immigrants from the Azores by Unemployment Among Ages 60 to 64 years

In terms of unemployment among ages 60 to 64 years, the demographic groups most similar to Immigrants from the Azores are Hmong (4.0%, a difference of 0.010%), Chinese (4.0%, a difference of 0.43%), Immigrants from Congo (4.1%, a difference of 2.7%), Fijian (3.9%, a difference of 3.3%), and Lumbee (4.2%, a difference of 3.7%).
DemographicsRating | RankUnemployment Among Ages 60 to 64 years
Marshallese
100.0
/100
|
#1
Exceptional
3.7%
Fijians
100.0
/100
|
#2
Exceptional
3.9%
Chinese
100.0
/100
|
#3
Exceptional
4.0%
Hmong
100.0
/100
|
#4
Exceptional
4.0%
Immigrants | Azores
100.0
/100
|
#5
Exceptional
4.0%
Immigrants | Congo
100.0
/100
|
#6
Exceptional
4.1%
Lumbee
100.0
/100
|
#7
Exceptional
4.2%
Immigrants | Micronesia
100.0
/100
|
#8
Exceptional
4.2%
Indonesians
100.0
/100
|
#9
Exceptional
4.2%
Immigrants | Bosnia and Herzegovina
100.0
/100
|
#10
Exceptional
4.2%
Luxembourgers
100.0
/100
|
#11
Exceptional
4.3%
Immigrants | Cuba
100.0
/100
|
#12
Exceptional
4.3%
Chickasaw
100.0
/100
|
#13
Exceptional
4.3%
Norwegians
100.0
/100
|
#14
Exceptional
4.3%
Sudanese
100.0
/100
|
#15
Exceptional
4.3%