Tlingit-Haida vs Immigrants from the Azores Median Family Income
COMPARE
Tlingit-Haida
Immigrants from the Azores
Median Family Income
Median Family Income Comparison
Tlingit-Haida
Immigrants from the Azores
$101,092
MEDIAN FAMILY INCOME
30.8/ 100
METRIC RATING
187th/ 347
METRIC RANK
$95,402
MEDIAN FAMILY INCOME
2.4/ 100
METRIC RATING
228th/ 347
METRIC RANK
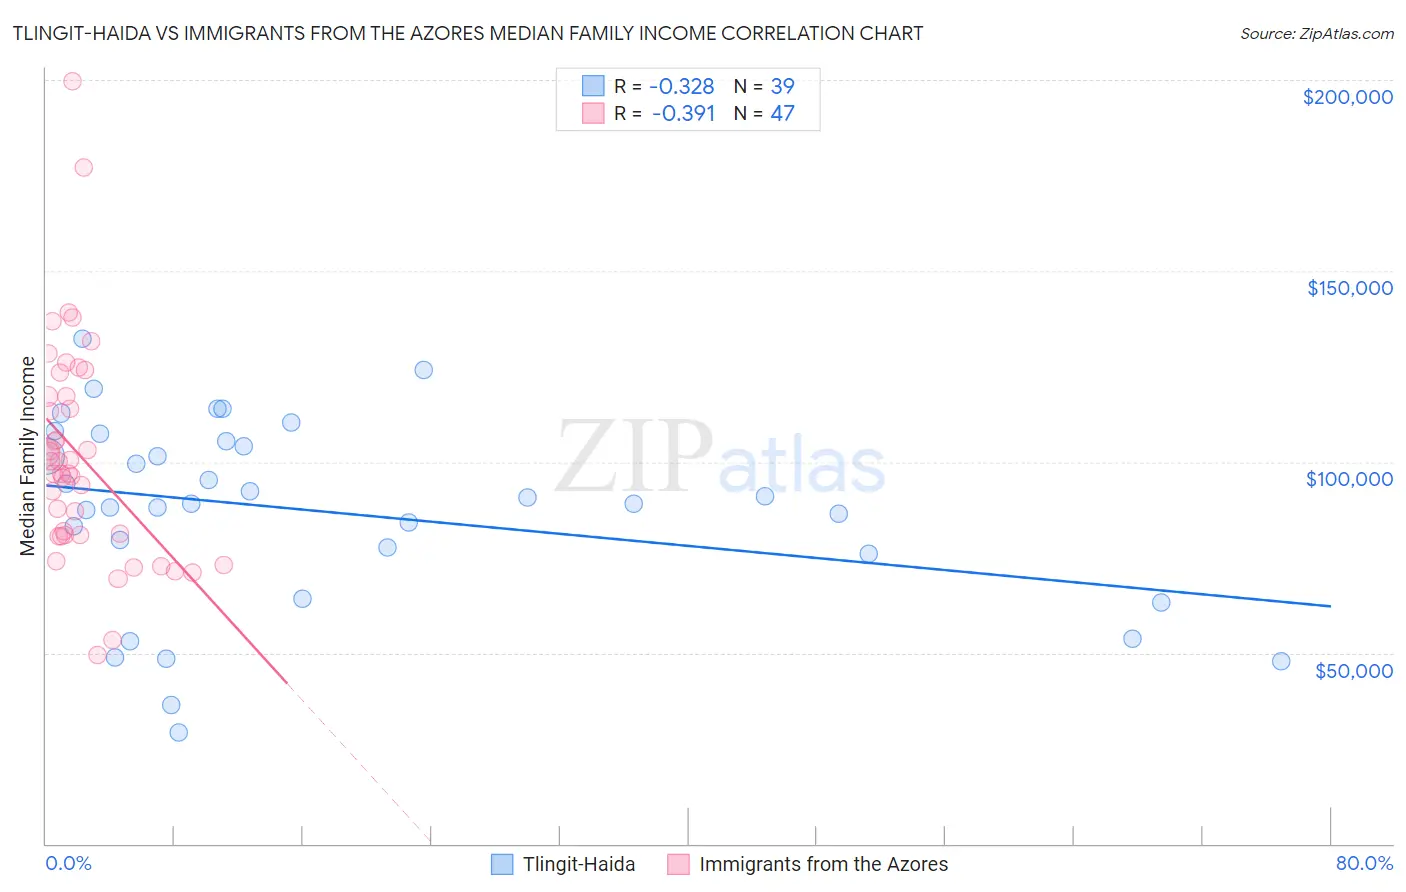
Tlingit-Haida vs Immigrants from the Azores Median Family Income Correlation Chart
The statistical analysis conducted on geographies consisting of 60,853,273 people shows a mild negative correlation between the proportion of Tlingit-Haida and median family income in the United States with a correlation coefficient (R) of -0.328 and weighted average of $101,092. Similarly, the statistical analysis conducted on geographies consisting of 46,255,736 people shows a mild negative correlation between the proportion of Immigrants from the Azores and median family income in the United States with a correlation coefficient (R) of -0.391 and weighted average of $95,402, a difference of 6.0%.
Median Family Income Correlation Summary
| Measurement | Tlingit-Haida | Immigrants from the Azores |
| Minimum | $29,250 | $49,583 |
| Maximum | $132,184 | $199,510 |
| Range | $102,934 | $149,927 |
| Mean | $86,951 | $101,435 |
| Median | $88,958 | $96,945 |
| Interquartile 25% (IQ1) | $75,972 | $80,714 |
| Interquartile 75% (IQ3) | $105,493 | $117,338 |
| Interquartile Range (IQR) | $29,521 | $36,624 |
| Standard Deviation (Sample) | $24,804 | $28,827 |
| Standard Deviation (Population) | $24,484 | $28,519 |
Similar Demographics by Median Family Income
Demographics Similar to Tlingit-Haida by Median Family Income
In terms of median family income, the demographic groups most similar to Tlingit-Haida are Guamanian/Chamorro ($101,061, a difference of 0.030%), Celtic ($101,139, a difference of 0.050%), Dutch ($101,192, a difference of 0.10%), Immigrants from Portugal ($100,984, a difference of 0.11%), and Immigrants ($100,962, a difference of 0.13%).
| Demographics | Rating | Rank | Median Family Income |
| French Canadians | 37.0 /100 | #180 | Fair $101,634 |
| Spaniards | 36.8 /100 | #181 | Fair $101,617 |
| Tsimshian | 35.9 /100 | #182 | Fair $101,543 |
| Kenyans | 34.5 /100 | #183 | Fair $101,417 |
| Immigrants | Costa Rica | 33.7 /100 | #184 | Fair $101,354 |
| Dutch | 31.9 /100 | #185 | Fair $101,192 |
| Celtics | 31.3 /100 | #186 | Fair $101,139 |
| Tlingit-Haida | 30.8 /100 | #187 | Fair $101,092 |
| Guamanians/Chamorros | 30.5 /100 | #188 | Fair $101,061 |
| Immigrants | Portugal | 29.6 /100 | #189 | Fair $100,984 |
| Immigrants | Immigrants | 29.4 /100 | #190 | Fair $100,962 |
| Colombians | 27.2 /100 | #191 | Fair $100,750 |
| Immigrants | Kenya | 26.5 /100 | #192 | Fair $100,679 |
| Iraqis | 26.3 /100 | #193 | Fair $100,658 |
| Uruguayans | 26.3 /100 | #194 | Fair $100,656 |
Demographics Similar to Immigrants from the Azores by Median Family Income
In terms of median family income, the demographic groups most similar to Immigrants from the Azores are Marshallese ($95,293, a difference of 0.11%), Alaska Native ($95,573, a difference of 0.18%), Malaysian ($95,230, a difference of 0.18%), Immigrants from Panama ($95,647, a difference of 0.26%), and Ecuadorian ($95,114, a difference of 0.30%).
| Demographics | Rating | Rank | Median Family Income |
| Immigrants | Ghana | 4.2 /100 | #221 | Tragic $96,544 |
| Immigrants | Nigeria | 4.0 /100 | #222 | Tragic $96,439 |
| Venezuelans | 3.7 /100 | #223 | Tragic $96,281 |
| Immigrants | Nonimmigrants | 3.6 /100 | #224 | Tragic $96,231 |
| Vietnamese | 3.4 /100 | #225 | Tragic $96,123 |
| Immigrants | Panama | 2.7 /100 | #226 | Tragic $95,647 |
| Alaska Natives | 2.6 /100 | #227 | Tragic $95,573 |
| Immigrants | Azores | 2.4 /100 | #228 | Tragic $95,402 |
| Marshallese | 2.2 /100 | #229 | Tragic $95,293 |
| Malaysians | 2.2 /100 | #230 | Tragic $95,230 |
| Ecuadorians | 2.1 /100 | #231 | Tragic $95,114 |
| Immigrants | Venezuela | 1.9 /100 | #232 | Tragic $94,904 |
| Immigrants | Bangladesh | 1.6 /100 | #233 | Tragic $94,665 |
| Immigrants | Western Africa | 1.6 /100 | #234 | Tragic $94,638 |
| Immigrants | Burma/Myanmar | 1.5 /100 | #235 | Tragic $94,472 |