Immigrants from Somalia vs Immigrants from Australia Median Family Income
COMPARE
Immigrants from Somalia
Immigrants from Australia
Median Family Income
Median Family Income Comparison
Immigrants from Somalia
Immigrants from Australia
$92,609
MEDIAN FAMILY INCOME
0.6/ 100
METRIC RATING
251st/ 347
METRIC RANK
$126,620
MEDIAN FAMILY INCOME
100.0/ 100
METRIC RATING
13th/ 347
METRIC RANK
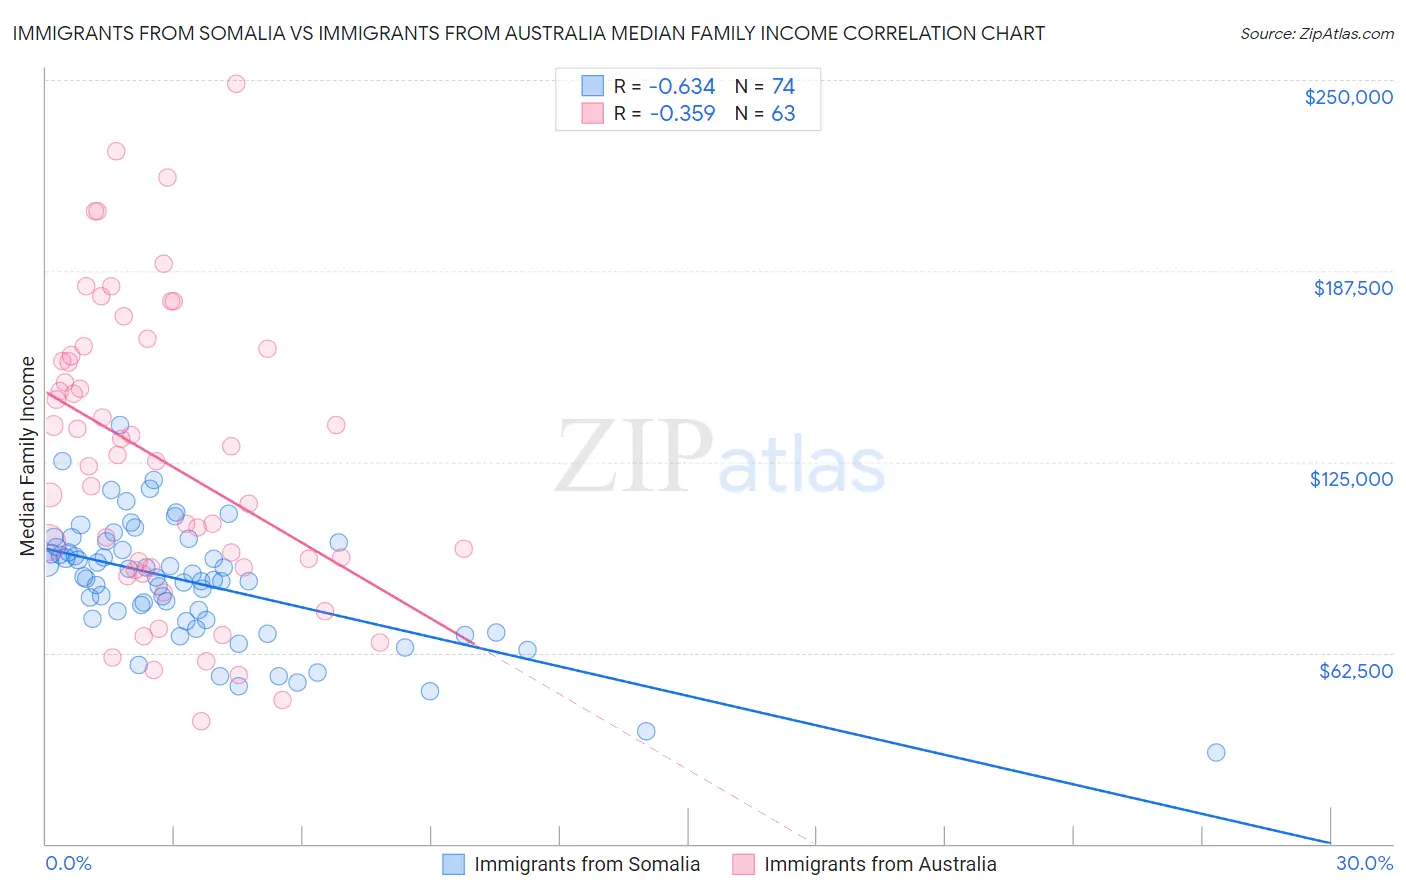
Immigrants from Somalia vs Immigrants from Australia Median Family Income Correlation Chart
The statistical analysis conducted on geographies consisting of 92,093,839 people shows a significant negative correlation between the proportion of Immigrants from Somalia and median family income in the United States with a correlation coefficient (R) of -0.634 and weighted average of $92,609. Similarly, the statistical analysis conducted on geographies consisting of 227,105,113 people shows a mild negative correlation between the proportion of Immigrants from Australia and median family income in the United States with a correlation coefficient (R) of -0.359 and weighted average of $126,620, a difference of 36.7%.
Median Family Income Correlation Summary
| Measurement | Immigrants from Somalia | Immigrants from Australia |
| Minimum | $29,978 | $40,038 |
| Maximum | $137,115 | $248,750 |
| Range | $107,137 | $208,712 |
| Mean | $85,390 | $125,759 |
| Median | $86,897 | $125,053 |
| Interquartile 25% (IQ1) | $73,310 | $90,291 |
| Interquartile 75% (IQ3) | $97,167 | $159,793 |
| Interquartile Range (IQR) | $23,857 | $69,502 |
| Standard Deviation (Sample) | $19,854 | $48,023 |
| Standard Deviation (Population) | $19,720 | $47,640 |
Similar Demographics by Median Family Income
Demographics Similar to Immigrants from Somalia by Median Family Income
In terms of median family income, the demographic groups most similar to Immigrants from Somalia are Immigrants from El Salvador ($92,545, a difference of 0.070%), Immigrants from Guyana ($92,513, a difference of 0.10%), West Indian ($92,765, a difference of 0.17%), Immigrants from Barbados ($92,419, a difference of 0.21%), and Immigrants from Ecuador ($92,837, a difference of 0.25%).
| Demographics | Rating | Rank | Median Family Income |
| Sub-Saharan Africans | 1.0 /100 | #244 | Tragic $93,748 |
| Immigrants | Middle Africa | 1.0 /100 | #245 | Tragic $93,593 |
| Guyanese | 0.9 /100 | #246 | Tragic $93,373 |
| Immigrants | Senegal | 0.7 /100 | #247 | Tragic $92,912 |
| French American Indians | 0.7 /100 | #248 | Tragic $92,872 |
| Immigrants | Ecuador | 0.7 /100 | #249 | Tragic $92,837 |
| West Indians | 0.6 /100 | #250 | Tragic $92,765 |
| Immigrants | Somalia | 0.6 /100 | #251 | Tragic $92,609 |
| Immigrants | El Salvador | 0.6 /100 | #252 | Tragic $92,545 |
| Immigrants | Guyana | 0.6 /100 | #253 | Tragic $92,513 |
| Immigrants | Barbados | 0.5 /100 | #254 | Tragic $92,419 |
| Immigrants | Laos | 0.5 /100 | #255 | Tragic $92,239 |
| Nicaraguans | 0.5 /100 | #256 | Tragic $92,231 |
| Americans | 0.4 /100 | #257 | Tragic $92,096 |
| Osage | 0.4 /100 | #258 | Tragic $91,926 |
Demographics Similar to Immigrants from Australia by Median Family Income
In terms of median family income, the demographic groups most similar to Immigrants from Australia are Cypriot ($127,064, a difference of 0.35%), Immigrants from South Central Asia ($125,956, a difference of 0.53%), Immigrants from Israel ($127,430, a difference of 0.64%), Immigrants from Ireland ($127,584, a difference of 0.76%), and Eastern European ($125,546, a difference of 0.86%).
| Demographics | Rating | Rank | Median Family Income |
| Thais | 100.0 /100 | #6 | Exceptional $131,281 |
| Immigrants | Hong Kong | 100.0 /100 | #7 | Exceptional $131,067 |
| Immigrants | Iran | 100.0 /100 | #8 | Exceptional $130,894 |
| Okinawans | 100.0 /100 | #9 | Exceptional $129,979 |
| Immigrants | Ireland | 100.0 /100 | #10 | Exceptional $127,584 |
| Immigrants | Israel | 100.0 /100 | #11 | Exceptional $127,430 |
| Cypriots | 100.0 /100 | #12 | Exceptional $127,064 |
| Immigrants | Australia | 100.0 /100 | #13 | Exceptional $126,620 |
| Immigrants | South Central Asia | 100.0 /100 | #14 | Exceptional $125,956 |
| Eastern Europeans | 100.0 /100 | #15 | Exceptional $125,546 |
| Immigrants | China | 100.0 /100 | #16 | Exceptional $125,540 |
| Indians (Asian) | 100.0 /100 | #17 | Exceptional $125,312 |
| Immigrants | Eastern Asia | 100.0 /100 | #18 | Exceptional $125,150 |
| Immigrants | Belgium | 100.0 /100 | #19 | Exceptional $123,831 |
| Burmese | 100.0 /100 | #20 | Exceptional $123,369 |