Slovene vs Immigrants from Australia Median Family Income
COMPARE
Slovene
Immigrants from Australia
Median Family Income
Median Family Income Comparison
Slovenes
Immigrants from Australia
$106,020
MEDIAN FAMILY INCOME
84.7/ 100
METRIC RATING
142nd/ 347
METRIC RANK
$126,620
MEDIAN FAMILY INCOME
100.0/ 100
METRIC RATING
13th/ 347
METRIC RANK
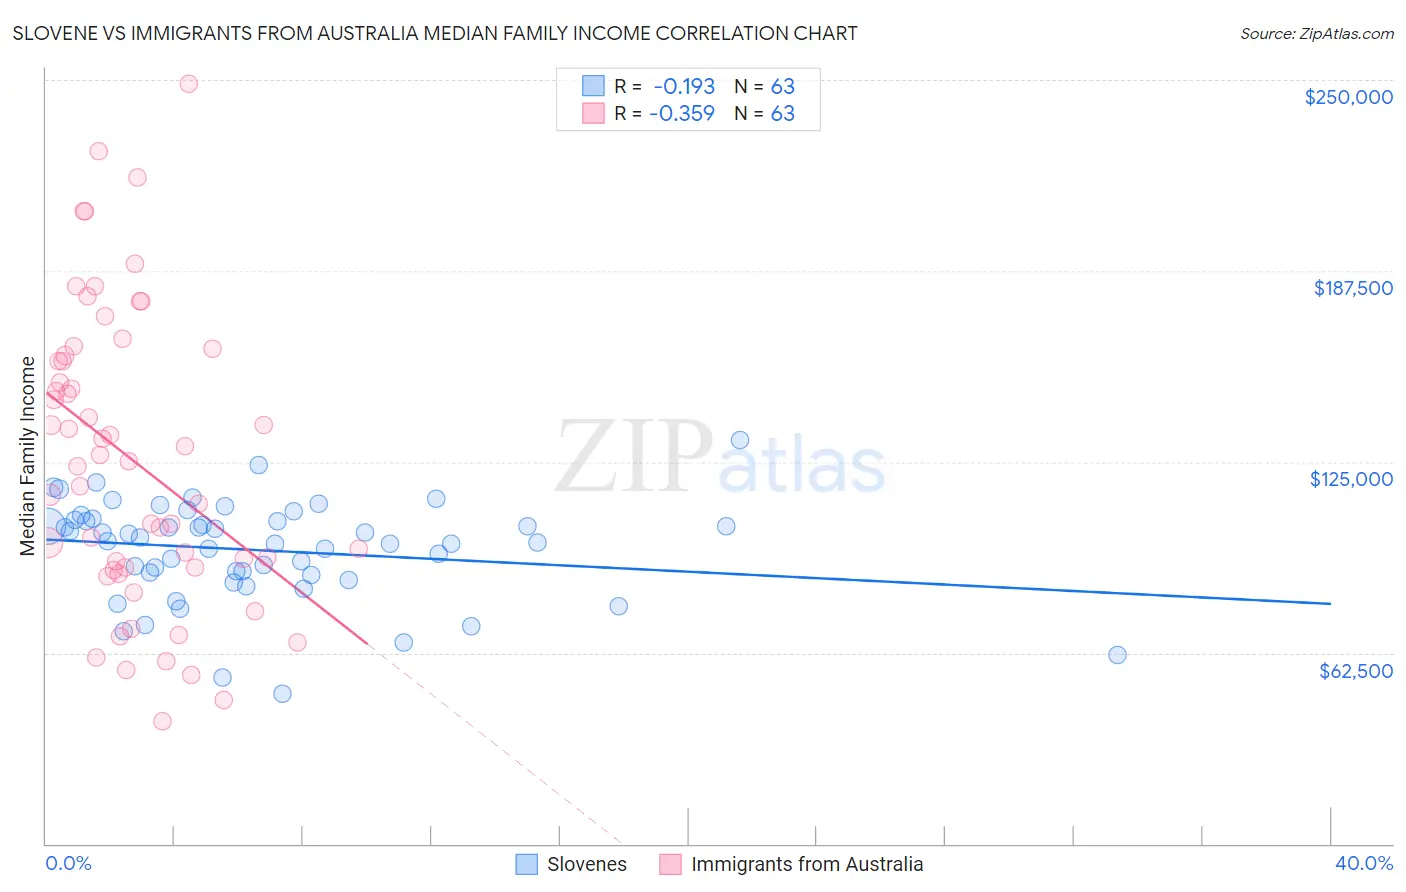
Slovene vs Immigrants from Australia Median Family Income Correlation Chart
The statistical analysis conducted on geographies consisting of 261,214,906 people shows a poor negative correlation between the proportion of Slovenes and median family income in the United States with a correlation coefficient (R) of -0.193 and weighted average of $106,020. Similarly, the statistical analysis conducted on geographies consisting of 227,105,113 people shows a mild negative correlation between the proportion of Immigrants from Australia and median family income in the United States with a correlation coefficient (R) of -0.359 and weighted average of $126,620, a difference of 19.4%.
Median Family Income Correlation Summary
| Measurement | Slovene | Immigrants from Australia |
| Minimum | $48,984 | $40,038 |
| Maximum | $132,096 | $248,750 |
| Range | $83,112 | $208,712 |
| Mean | $96,087 | $125,759 |
| Median | $98,910 | $125,053 |
| Interquartile 25% (IQ1) | $88,135 | $90,291 |
| Interquartile 75% (IQ3) | $105,910 | $159,793 |
| Interquartile Range (IQR) | $17,775 | $69,502 |
| Standard Deviation (Sample) | $16,283 | $48,023 |
| Standard Deviation (Population) | $16,153 | $47,640 |
Similar Demographics by Median Family Income
Demographics Similar to Slovenes by Median Family Income
In terms of median family income, the demographic groups most similar to Slovenes are Tongan ($105,967, a difference of 0.050%), Immigrants from Morocco ($105,964, a difference of 0.050%), Immigrants from Syria ($106,118, a difference of 0.090%), Danish ($105,900, a difference of 0.11%), and Norwegian ($106,144, a difference of 0.12%).
| Demographics | Rating | Rank | Median Family Income |
| Portuguese | 86.3 /100 | #135 | Excellent $106,286 |
| Immigrants | South Eastern Asia | 86.1 /100 | #136 | Excellent $106,252 |
| Immigrants | Uganda | 85.7 /100 | #137 | Excellent $106,188 |
| Immigrants | Vietnam | 85.7 /100 | #138 | Excellent $106,186 |
| Luxembourgers | 85.7 /100 | #139 | Excellent $106,183 |
| Norwegians | 85.5 /100 | #140 | Excellent $106,144 |
| Immigrants | Syria | 85.3 /100 | #141 | Excellent $106,118 |
| Slovenes | 84.7 /100 | #142 | Excellent $106,020 |
| Tongans | 84.3 /100 | #143 | Excellent $105,967 |
| Immigrants | Morocco | 84.3 /100 | #144 | Excellent $105,964 |
| Danes | 83.8 /100 | #145 | Excellent $105,900 |
| Czechs | 83.4 /100 | #146 | Excellent $105,839 |
| Immigrants | Chile | 82.1 /100 | #147 | Excellent $105,655 |
| Hungarians | 81.7 /100 | #148 | Excellent $105,609 |
| Immigrants | Germany | 80.9 /100 | #149 | Excellent $105,507 |
Demographics Similar to Immigrants from Australia by Median Family Income
In terms of median family income, the demographic groups most similar to Immigrants from Australia are Cypriot ($127,064, a difference of 0.35%), Immigrants from South Central Asia ($125,956, a difference of 0.53%), Immigrants from Israel ($127,430, a difference of 0.64%), Immigrants from Ireland ($127,584, a difference of 0.76%), and Eastern European ($125,546, a difference of 0.86%).
| Demographics | Rating | Rank | Median Family Income |
| Thais | 100.0 /100 | #6 | Exceptional $131,281 |
| Immigrants | Hong Kong | 100.0 /100 | #7 | Exceptional $131,067 |
| Immigrants | Iran | 100.0 /100 | #8 | Exceptional $130,894 |
| Okinawans | 100.0 /100 | #9 | Exceptional $129,979 |
| Immigrants | Ireland | 100.0 /100 | #10 | Exceptional $127,584 |
| Immigrants | Israel | 100.0 /100 | #11 | Exceptional $127,430 |
| Cypriots | 100.0 /100 | #12 | Exceptional $127,064 |
| Immigrants | Australia | 100.0 /100 | #13 | Exceptional $126,620 |
| Immigrants | South Central Asia | 100.0 /100 | #14 | Exceptional $125,956 |
| Eastern Europeans | 100.0 /100 | #15 | Exceptional $125,546 |
| Immigrants | China | 100.0 /100 | #16 | Exceptional $125,540 |
| Indians (Asian) | 100.0 /100 | #17 | Exceptional $125,312 |
| Immigrants | Eastern Asia | 100.0 /100 | #18 | Exceptional $125,150 |
| Immigrants | Belgium | 100.0 /100 | #19 | Exceptional $123,831 |
| Burmese | 100.0 /100 | #20 | Exceptional $123,369 |