Nicaraguan vs Immigrants from Grenada Per Capita Income
COMPARE
Nicaraguan
Immigrants from Grenada
Per Capita Income
Per Capita Income Comparison
Nicaraguans
Immigrants from Grenada
$39,372
PER CAPITA INCOME
0.8/ 100
METRIC RATING
257th/ 347
METRIC RANK
$41,123
PER CAPITA INCOME
5.5/ 100
METRIC RATING
228th/ 347
METRIC RANK
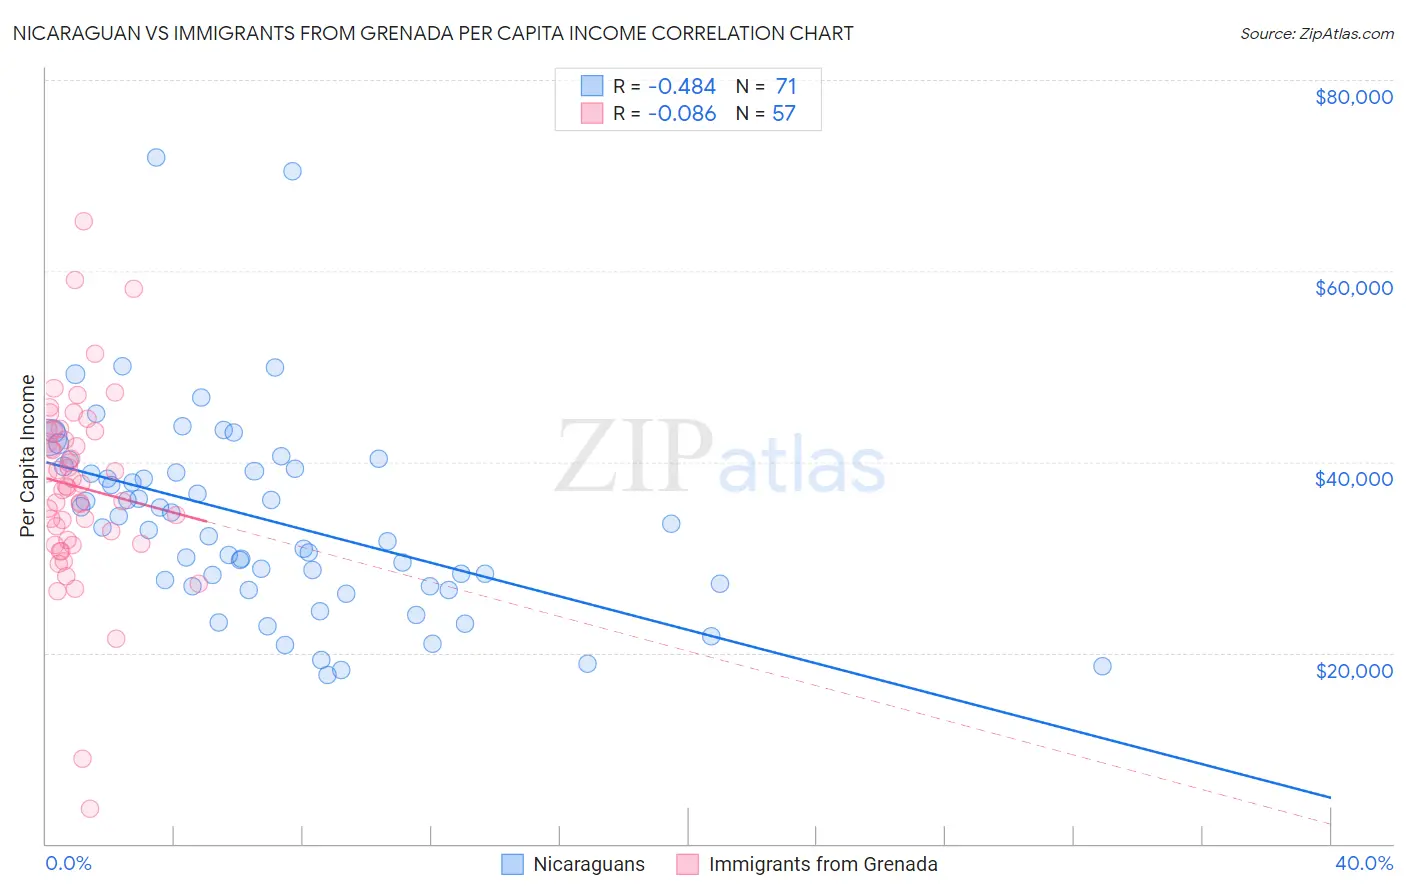
Nicaraguan vs Immigrants from Grenada Per Capita Income Correlation Chart
The statistical analysis conducted on geographies consisting of 285,722,062 people shows a moderate negative correlation between the proportion of Nicaraguans and per capita income in the United States with a correlation coefficient (R) of -0.484 and weighted average of $39,372. Similarly, the statistical analysis conducted on geographies consisting of 67,200,351 people shows a slight negative correlation between the proportion of Immigrants from Grenada and per capita income in the United States with a correlation coefficient (R) of -0.086 and weighted average of $41,123, a difference of 4.4%.
Per Capita Income Correlation Summary
| Measurement | Nicaraguan | Immigrants from Grenada |
| Minimum | $17,623 | $3,645 |
| Maximum | $71,864 | $65,209 |
| Range | $54,241 | $61,564 |
| Mean | $33,908 | $37,400 |
| Median | $33,140 | $37,479 |
| Interquartile 25% (IQ1) | $27,013 | $31,664 |
| Interquartile 75% (IQ3) | $39,273 | $43,240 |
| Interquartile Range (IQR) | $12,260 | $11,576 |
| Standard Deviation (Sample) | $10,352 | $10,138 |
| Standard Deviation (Population) | $10,279 | $10,049 |
Similar Demographics by Per Capita Income
Demographics Similar to Nicaraguans by Per Capita Income
In terms of per capita income, the demographic groups most similar to Nicaraguans are Hawaiian ($39,403, a difference of 0.080%), Jamaican ($39,231, a difference of 0.36%), Immigrants from Middle Africa ($39,529, a difference of 0.40%), Malaysian ($39,194, a difference of 0.46%), and Alaska Native ($39,558, a difference of 0.47%).
| Demographics | Rating | Rank | Per Capita Income |
| Immigrants | Burma/Myanmar | 1.3 /100 | #250 | Tragic $39,827 |
| Samoans | 1.3 /100 | #251 | Tragic $39,826 |
| Immigrants | Azores | 1.0 /100 | #252 | Tragic $39,608 |
| Osage | 1.0 /100 | #253 | Tragic $39,568 |
| Alaska Natives | 1.0 /100 | #254 | Tragic $39,558 |
| Immigrants | Middle Africa | 1.0 /100 | #255 | Tragic $39,529 |
| Hawaiians | 0.8 /100 | #256 | Tragic $39,403 |
| Nicaraguans | 0.8 /100 | #257 | Tragic $39,372 |
| Jamaicans | 0.7 /100 | #258 | Tragic $39,231 |
| Malaysians | 0.7 /100 | #259 | Tragic $39,194 |
| Alaskan Athabascans | 0.6 /100 | #260 | Tragic $39,163 |
| Marshallese | 0.6 /100 | #261 | Tragic $39,108 |
| Iroquois | 0.6 /100 | #262 | Tragic $39,104 |
| Belizeans | 0.6 /100 | #263 | Tragic $39,097 |
| Americans | 0.6 /100 | #264 | Tragic $39,039 |
Demographics Similar to Immigrants from Grenada by Per Capita Income
In terms of per capita income, the demographic groups most similar to Immigrants from Grenada are Immigrants from Ghana ($41,131, a difference of 0.020%), Immigrants from Ecuador ($41,195, a difference of 0.17%), West Indian ($41,217, a difference of 0.23%), Nigerian ($41,026, a difference of 0.24%), and Native Hawaiian ($41,017, a difference of 0.26%).
| Demographics | Rating | Rank | Per Capita Income |
| Immigrants | Trinidad and Tobago | 7.9 /100 | #221 | Tragic $41,476 |
| Immigrants | Iraq | 7.1 /100 | #222 | Tragic $41,365 |
| Immigrants | Cameroon | 6.8 /100 | #223 | Tragic $41,334 |
| Immigrants | St. Vincent and the Grenadines | 6.4 /100 | #224 | Tragic $41,270 |
| West Indians | 6.0 /100 | #225 | Tragic $41,217 |
| Immigrants | Ecuador | 5.9 /100 | #226 | Tragic $41,195 |
| Immigrants | Ghana | 5.5 /100 | #227 | Tragic $41,131 |
| Immigrants | Grenada | 5.5 /100 | #228 | Tragic $41,123 |
| Nigerians | 4.9 /100 | #229 | Tragic $41,026 |
| Native Hawaiians | 4.9 /100 | #230 | Tragic $41,017 |
| Senegalese | 4.8 /100 | #231 | Tragic $41,000 |
| Guyanese | 4.5 /100 | #232 | Tragic $40,949 |
| Delaware | 3.8 /100 | #233 | Tragic $40,778 |
| Immigrants | West Indies | 3.7 /100 | #234 | Tragic $40,763 |
| Immigrants | Guyana | 3.6 /100 | #235 | Tragic $40,742 |