Alsatian vs Immigrants from Grenada Wage/Income Gap
COMPARE
Alsatian
Immigrants from Grenada
Wage/Income Gap
Wage/Income Gap Comparison
Alsatians
Immigrants from Grenada
24.7%
WAGE/INCOME GAP
93.2/ 100
METRIC RATING
130th/ 347
METRIC RANK
16.2%
WAGE/INCOME GAP
100.0/ 100
METRIC RATING
1st/ 347
METRIC RANK
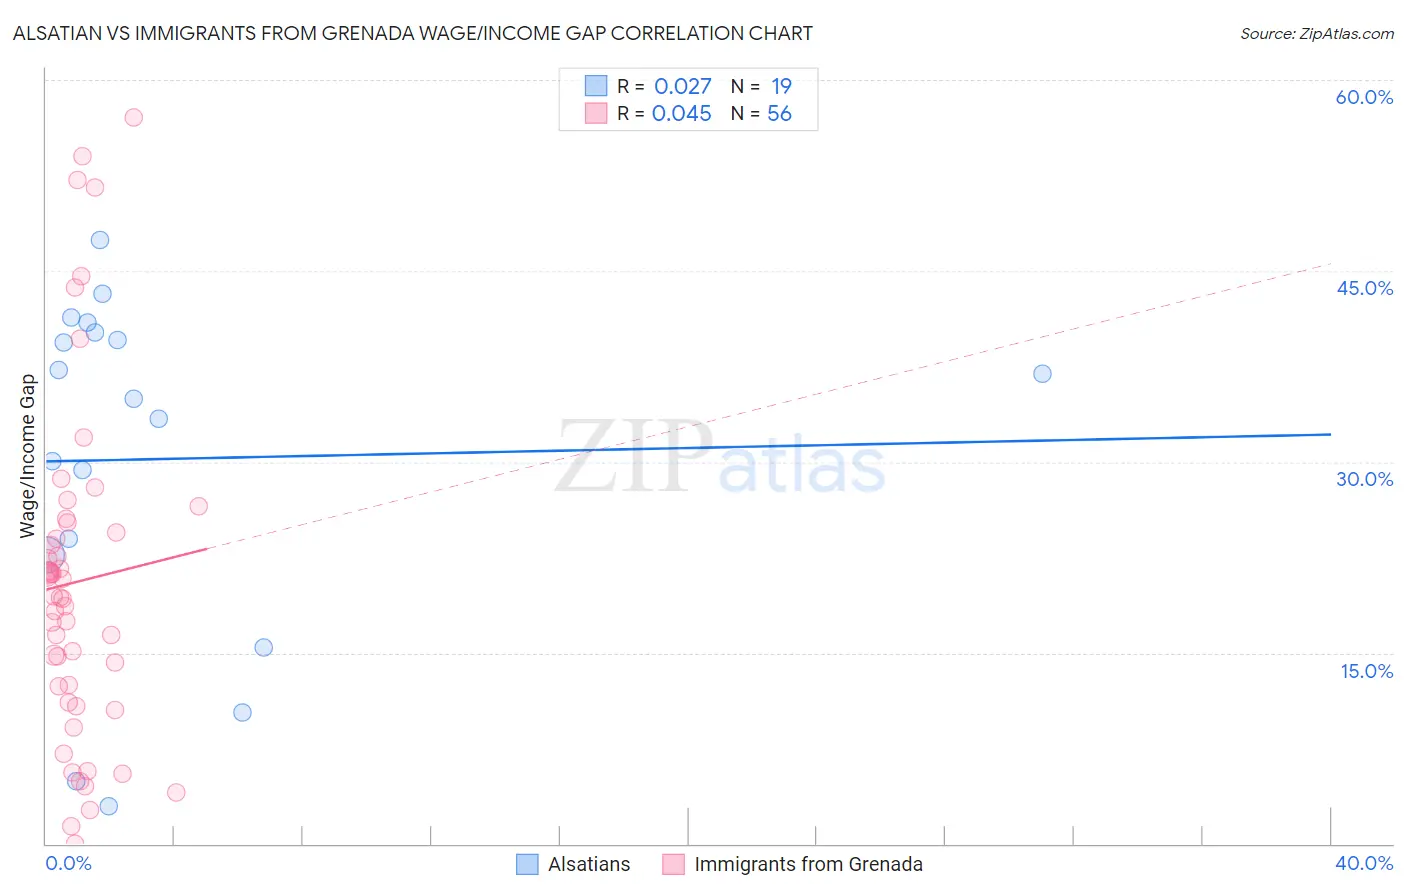
Alsatian vs Immigrants from Grenada Wage/Income Gap Correlation Chart
The statistical analysis conducted on geographies consisting of 82,663,210 people shows no correlation between the proportion of Alsatians and wage/income gap percentage in the United States with a correlation coefficient (R) of 0.027 and weighted average of 24.7%. Similarly, the statistical analysis conducted on geographies consisting of 67,191,325 people shows no correlation between the proportion of Immigrants from Grenada and wage/income gap percentage in the United States with a correlation coefficient (R) of 0.045 and weighted average of 16.2%, a difference of 52.5%.
Wage/Income Gap Correlation Summary
| Measurement | Alsatian | Immigrants from Grenada |
| Minimum | 3.0% | 0.0034% |
| Maximum | 47.4% | 57.0% |
| Range | 44.4% | 57.0% |
| Mean | 30.2% | 20.6% |
| Median | 35.0% | 19.4% |
| Interquartile 25% (IQ1) | 22.7% | 11.7% |
| Interquartile 75% (IQ3) | 40.1% | 24.9% |
| Interquartile Range (IQR) | 17.4% | 13.1% |
| Standard Deviation (Sample) | 13.3% | 13.3% |
| Standard Deviation (Population) | 13.0% | 13.2% |
Similar Demographics by Wage/Income Gap
Demographics Similar to Alsatians by Wage/Income Gap
In terms of wage/income gap, the demographic groups most similar to Alsatians are Yup'ik (24.7%, a difference of 0.020%), Immigrants from Philippines (24.7%, a difference of 0.070%), Immigrants from Central America (24.6%, a difference of 0.080%), German Russian (24.6%, a difference of 0.14%), and Immigrants from Uruguay (24.6%, a difference of 0.15%).
| Demographics | Rating | Rank | Wage/Income Gap |
| Natives/Alaskans | 94.6 /100 | #123 | Exceptional 24.6% |
| Immigrants | South America | 93.9 /100 | #124 | Exceptional 24.6% |
| Spanish Americans | 93.8 /100 | #125 | Exceptional 24.6% |
| Immigrants | Uruguay | 93.8 /100 | #126 | Exceptional 24.6% |
| German Russians | 93.7 /100 | #127 | Exceptional 24.6% |
| Immigrants | Central America | 93.5 /100 | #128 | Exceptional 24.6% |
| Yup'ik | 93.3 /100 | #129 | Exceptional 24.7% |
| Alsatians | 93.2 /100 | #130 | Exceptional 24.7% |
| Immigrants | Philippines | 93.0 /100 | #131 | Exceptional 24.7% |
| Immigrants | Costa Rica | 92.4 /100 | #132 | Exceptional 24.7% |
| Colombians | 92.4 /100 | #133 | Exceptional 24.7% |
| Mexican American Indians | 92.2 /100 | #134 | Exceptional 24.7% |
| South American Indians | 92.0 /100 | #135 | Exceptional 24.7% |
| Armenians | 91.3 /100 | #136 | Exceptional 24.8% |
| Immigrants | South Eastern Asia | 90.9 /100 | #137 | Exceptional 24.8% |
Demographics Similar to Immigrants from Grenada by Wage/Income Gap
In terms of wage/income gap, the demographic groups most similar to Immigrants from Grenada are Immigrants from St. Vincent and the Grenadines (16.4%, a difference of 1.5%), Immigrants from Barbados (17.8%, a difference of 10.3%), British West Indian (18.0%, a difference of 11.4%), Guyanese (18.3%, a difference of 13.2%), and Immigrants from Guyana (18.4%, a difference of 13.5%).
| Demographics | Rating | Rank | Wage/Income Gap |
| Immigrants | Grenada | 100.0 /100 | #1 | Exceptional 16.2% |
| Immigrants | St. Vincent and the Grenadines | 100.0 /100 | #2 | Exceptional 16.4% |
| Immigrants | Barbados | 100.0 /100 | #3 | Exceptional 17.8% |
| British West Indians | 100.0 /100 | #4 | Exceptional 18.0% |
| Guyanese | 100.0 /100 | #5 | Exceptional 18.3% |
| Immigrants | Guyana | 100.0 /100 | #6 | Exceptional 18.4% |
| Puerto Ricans | 100.0 /100 | #7 | Exceptional 18.7% |
| Immigrants | Jamaica | 100.0 /100 | #8 | Exceptional 18.8% |
| Barbadians | 100.0 /100 | #9 | Exceptional 19.0% |
| Crow | 100.0 /100 | #10 | Exceptional 19.1% |
| Immigrants | Haiti | 100.0 /100 | #11 | Exceptional 19.2% |
| Immigrants | West Indies | 100.0 /100 | #12 | Exceptional 19.2% |
| Trinidadians and Tobagonians | 100.0 /100 | #13 | Exceptional 19.3% |
| Immigrants | Trinidad and Tobago | 100.0 /100 | #14 | Exceptional 19.3% |
| West Indians | 100.0 /100 | #15 | Exceptional 19.6% |