Zip Codes with the Highest Percentage of Population with a Degree in Visual and Performing Arts in Aurora, IL
RELATED REPORTS & OPTIONS
Visual and Performing Arts
Aurora
Compare Zip Codes
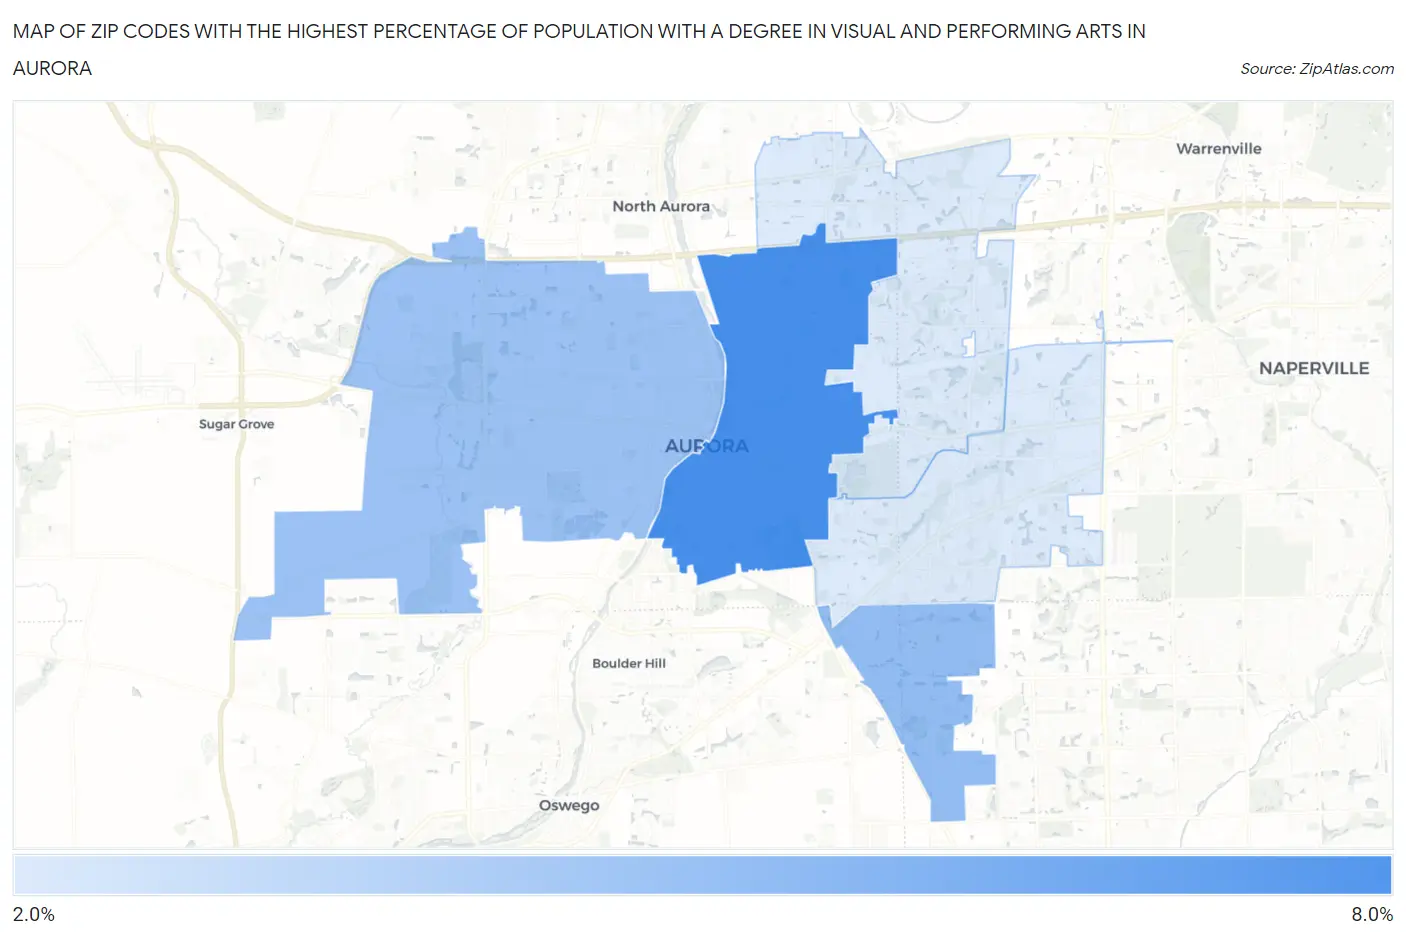
Map of Zip Codes with the Highest Percentage of Population with a Degree in Visual and Performing Arts in Aurora
2.5%
6.2%
Zip Codes with the Highest Percentage of Population with a Degree in Visual and Performing Arts in Aurora, IL
| Zip Code | % Graduates | vs State | vs National | |
| 1. | 60505 | 6.2% | 4.4%(+1.79)#188 | 4.3%(+1.99)#4,550 |
| 2. | 60503 | 4.3% | 4.4%(-0.118)#321 | 4.3%(+0.080)#8,262 |
| 3. | 60506 | 4.1% | 4.4%(-0.335)#352 | 4.3%(-0.137)#8,887 |
| 4. | 60504 | 2.6% | 4.4%(-1.88)#588 | 4.3%(-1.68)#14,366 |
| 5. | 60502 | 2.5% | 4.4%(-1.90)#593 | 4.3%(-1.71)#14,456 |
1
Common Questions
What are the Top 3 Zip Codes with the Highest Percentage of Population with a Degree in Visual and Performing Arts in Aurora, IL?
Top 3 Zip Codes with the Highest Percentage of Population with a Degree in Visual and Performing Arts in Aurora, IL are:
What zip code has the Highest Percentage of Population with a Degree in Visual and Performing Arts in Aurora, IL?
60505 has the Highest Percentage of Population with a Degree in Visual and Performing Arts in Aurora, IL with 6.2%.
What is the Percentage of Population with a Degree in Visual and Performing Arts in Aurora, IL?
Percentage of Population with a Degree in Visual and Performing Arts in Aurora is 3.4%.
What is the Percentage of Population with a Degree in Visual and Performing Arts in Illinois?
Percentage of Population with a Degree in Visual and Performing Arts in Illinois is 4.4%.
What is the Percentage of Population with a Degree in Visual and Performing Arts in the United States?
Percentage of Population with a Degree in Visual and Performing Arts in the United States is 4.3%.