Zip Codes with the Highest Percentage of Population with a Degree in Visual and Performing Arts in Bloomington, IL
RELATED REPORTS & OPTIONS
Visual and Performing Arts
Bloomington
Compare Zip Codes
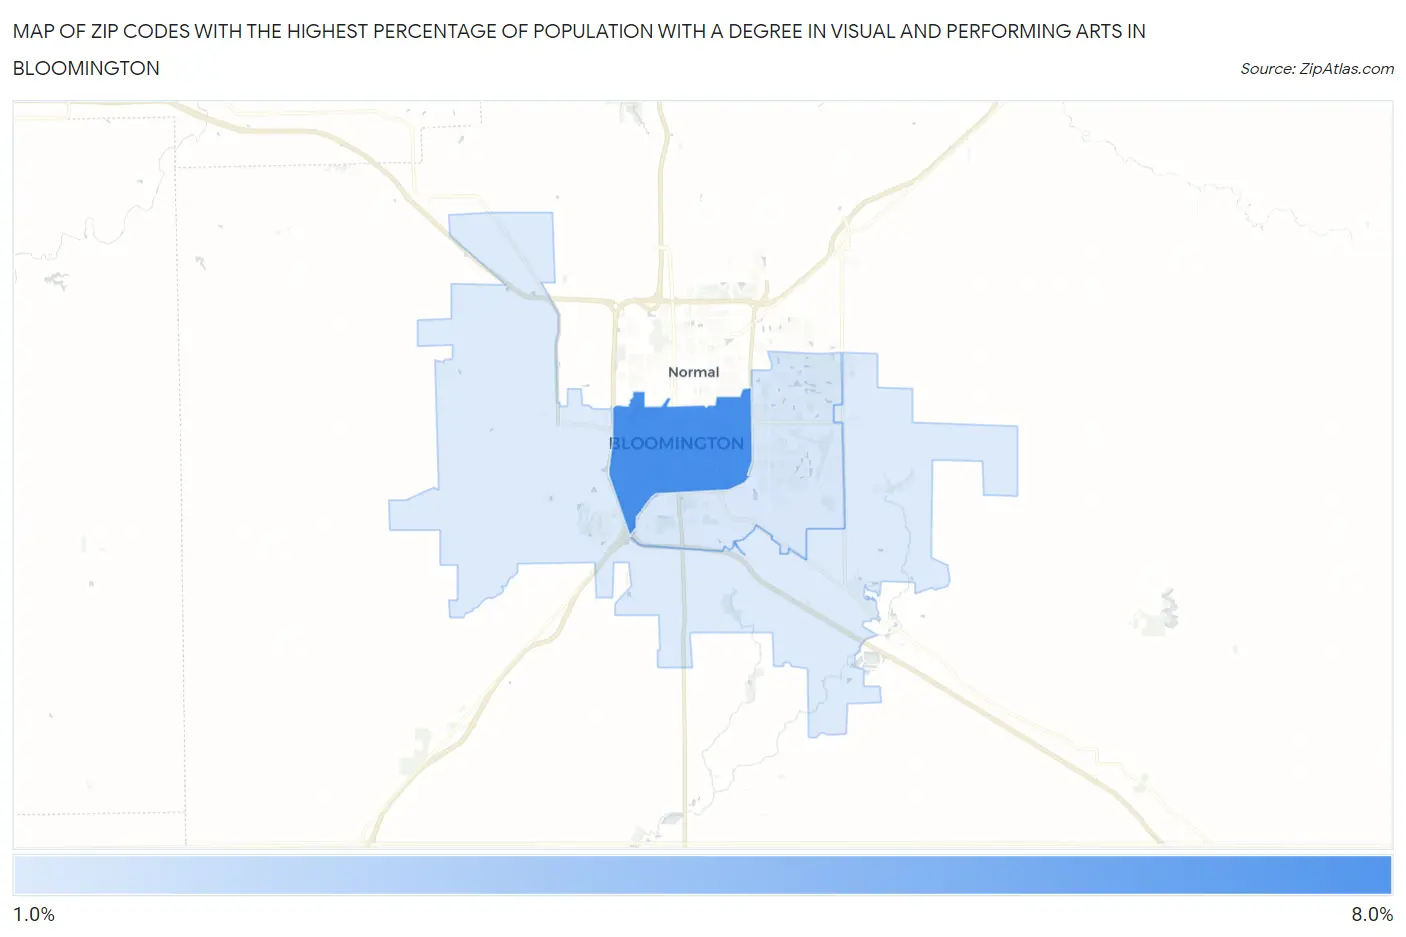
Map of Zip Codes with the Highest Percentage of Population with a Degree in Visual and Performing Arts in Bloomington
1.8%
6.8%
Zip Codes with the Highest Percentage of Population with a Degree in Visual and Performing Arts in Bloomington, IL
| Zip Code | % Graduates | vs State | vs National | |
| 1. | 61701 | 6.8% | 4.4%(+2.39)#148 | 4.3%(+2.59)#3,829 |
| 2. | 61704 | 2.0% | 4.4%(-2.46)#665 | 4.3%(-2.26)#16,474 |
| 3. | 61705 | 1.8% | 4.4%(-2.64)#689 | 4.3%(-2.44)#17,099 |
1
Common Questions
What are the Top Zip Codes with the Highest Percentage of Population with a Degree in Visual and Performing Arts in Bloomington, IL?
Top Zip Codes with the Highest Percentage of Population with a Degree in Visual and Performing Arts in Bloomington, IL are:
What zip code has the Highest Percentage of Population with a Degree in Visual and Performing Arts in Bloomington, IL?
61701 has the Highest Percentage of Population with a Degree in Visual and Performing Arts in Bloomington, IL with 6.8%.
What is the Percentage of Population with a Degree in Visual and Performing Arts in Bloomington, IL?
Percentage of Population with a Degree in Visual and Performing Arts in Bloomington is 3.5%.
What is the Percentage of Population with a Degree in Visual and Performing Arts in Illinois?
Percentage of Population with a Degree in Visual and Performing Arts in Illinois is 4.4%.
What is the Percentage of Population with a Degree in Visual and Performing Arts in the United States?
Percentage of Population with a Degree in Visual and Performing Arts in the United States is 4.3%.