Zip Codes with the Highest Percentage of Population with a Degree in Visual and Performing Arts in Crystal Lake, IL
RELATED REPORTS & OPTIONS
Visual and Performing Arts
Crystal Lake
Compare Zip Codes
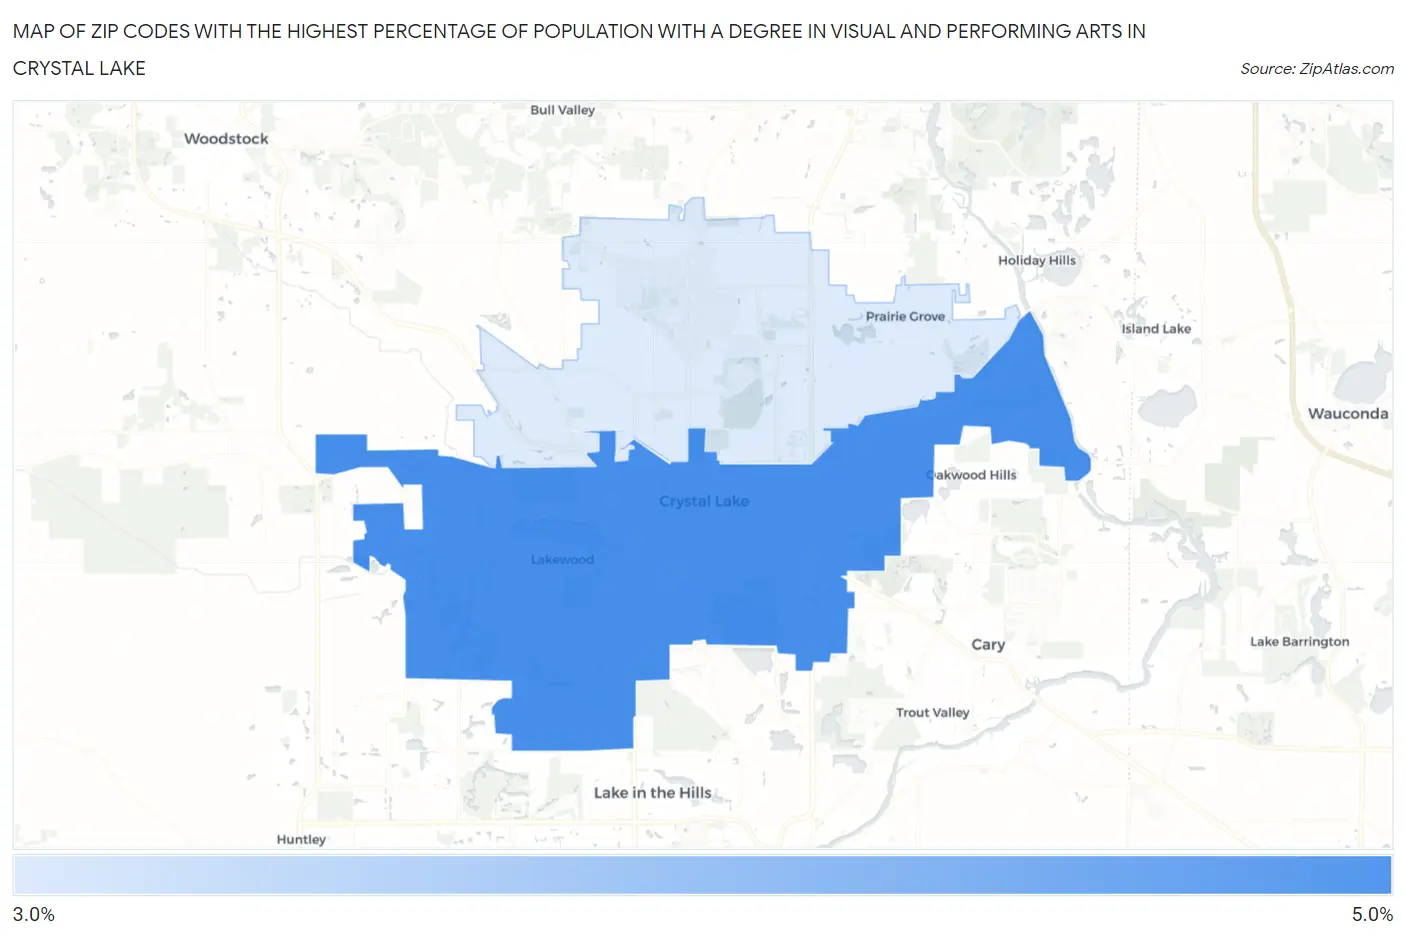
Map of Zip Codes with the Highest Percentage of Population with a Degree in Visual and Performing Arts in Crystal Lake
3.4%
4.6%
Zip Codes with the Highest Percentage of Population with a Degree in Visual and Performing Arts in Crystal Lake, IL
| Zip Code | % Graduates | vs State | vs National | |
| 1. | 60014 | 4.6% | 4.4%(+0.116)#296 | 4.3%(+0.313)#7,631 |
| 2. | 60012 | 3.4% | 4.4%(-1.06)#452 | 4.3%(-0.867)#11,306 |
1
Common Questions
What are the Top Zip Codes with the Highest Percentage of Population with a Degree in Visual and Performing Arts in Crystal Lake, IL?
Top Zip Codes with the Highest Percentage of Population with a Degree in Visual and Performing Arts in Crystal Lake, IL are:
What zip code has the Highest Percentage of Population with a Degree in Visual and Performing Arts in Crystal Lake, IL?
60014 has the Highest Percentage of Population with a Degree in Visual and Performing Arts in Crystal Lake, IL with 4.6%.
What is the Percentage of Population with a Degree in Visual and Performing Arts in Crystal Lake, IL?
Percentage of Population with a Degree in Visual and Performing Arts in Crystal Lake is 4.6%.
What is the Percentage of Population with a Degree in Visual and Performing Arts in Illinois?
Percentage of Population with a Degree in Visual and Performing Arts in Illinois is 4.4%.
What is the Percentage of Population with a Degree in Visual and Performing Arts in the United States?
Percentage of Population with a Degree in Visual and Performing Arts in the United States is 4.3%.