Zip Codes with the Highest Percentage of Population Employed in Administrative & Support Services in Decatur, IL
RELATED REPORTS & OPTIONS
Administrative & Support Services
Decatur
Compare Zip Codes
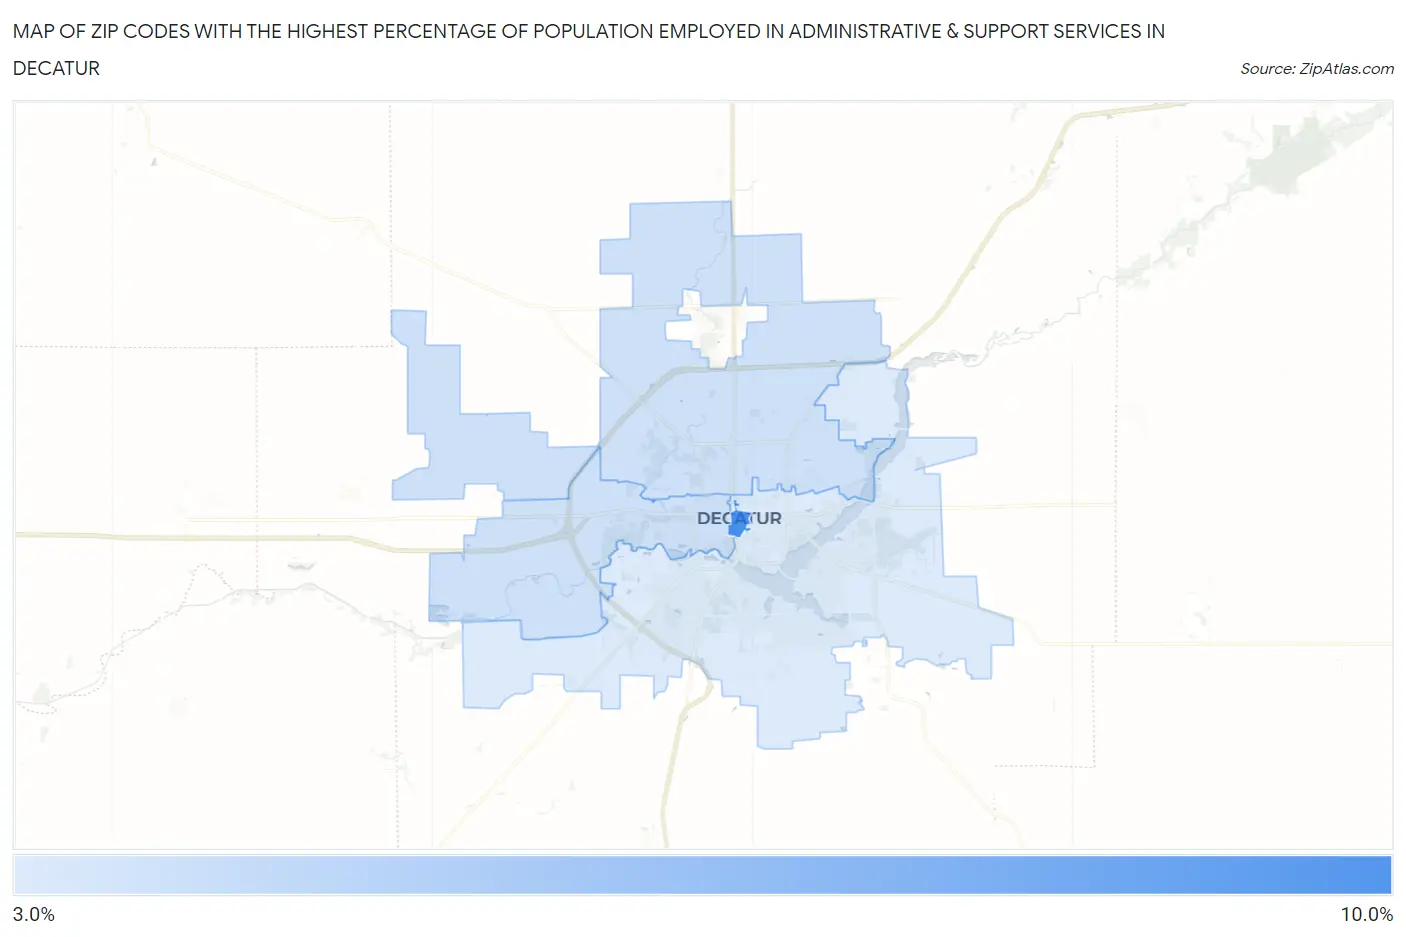
Map of Zip Codes with the Highest Percentage of Population Employed in Administrative & Support Services in Decatur
3.2%
8.8%
Zip Codes with the Highest Percentage of Population Employed in Administrative & Support Services in Decatur, IL
| Zip Code | % Employed | vs State | vs National | |
| 1. | 62523 | 8.8% | 4.0%(+4.77)#61 | 4.1%(+4.64)#1,795 |
| 2. | 62522 | 3.7% | 4.0%(-0.287)#444 | 4.1%(-0.420)#11,867 |
| 3. | 62526 | 3.7% | 4.0%(-0.306)#446 | 4.1%(-0.439)#11,939 |
| 4. | 62521 | 3.2% | 4.0%(-0.772)#558 | 4.1%(-0.904)#14,222 |
1
Common Questions
What are the Top 3 Zip Codes with the Highest Percentage of Population Employed in Administrative & Support Services in Decatur, IL?
Top 3 Zip Codes with the Highest Percentage of Population Employed in Administrative & Support Services in Decatur, IL are:
What zip code has the Highest Percentage of Population Employed in Administrative & Support Services in Decatur, IL?
62523 has the Highest Percentage of Population Employed in Administrative & Support Services in Decatur, IL with 8.8%.
What is the Percentage of Population Employed in Administrative & Support Services in Decatur, IL?
Percentage of Population Employed in Administrative & Support Services in Decatur is 3.6%.
What is the Percentage of Population Employed in Administrative & Support Services in Illinois?
Percentage of Population Employed in Administrative & Support Services in Illinois is 4.0%.
What is the Percentage of Population Employed in Administrative & Support Services in the United States?
Percentage of Population Employed in Administrative & Support Services in the United States is 4.1%.