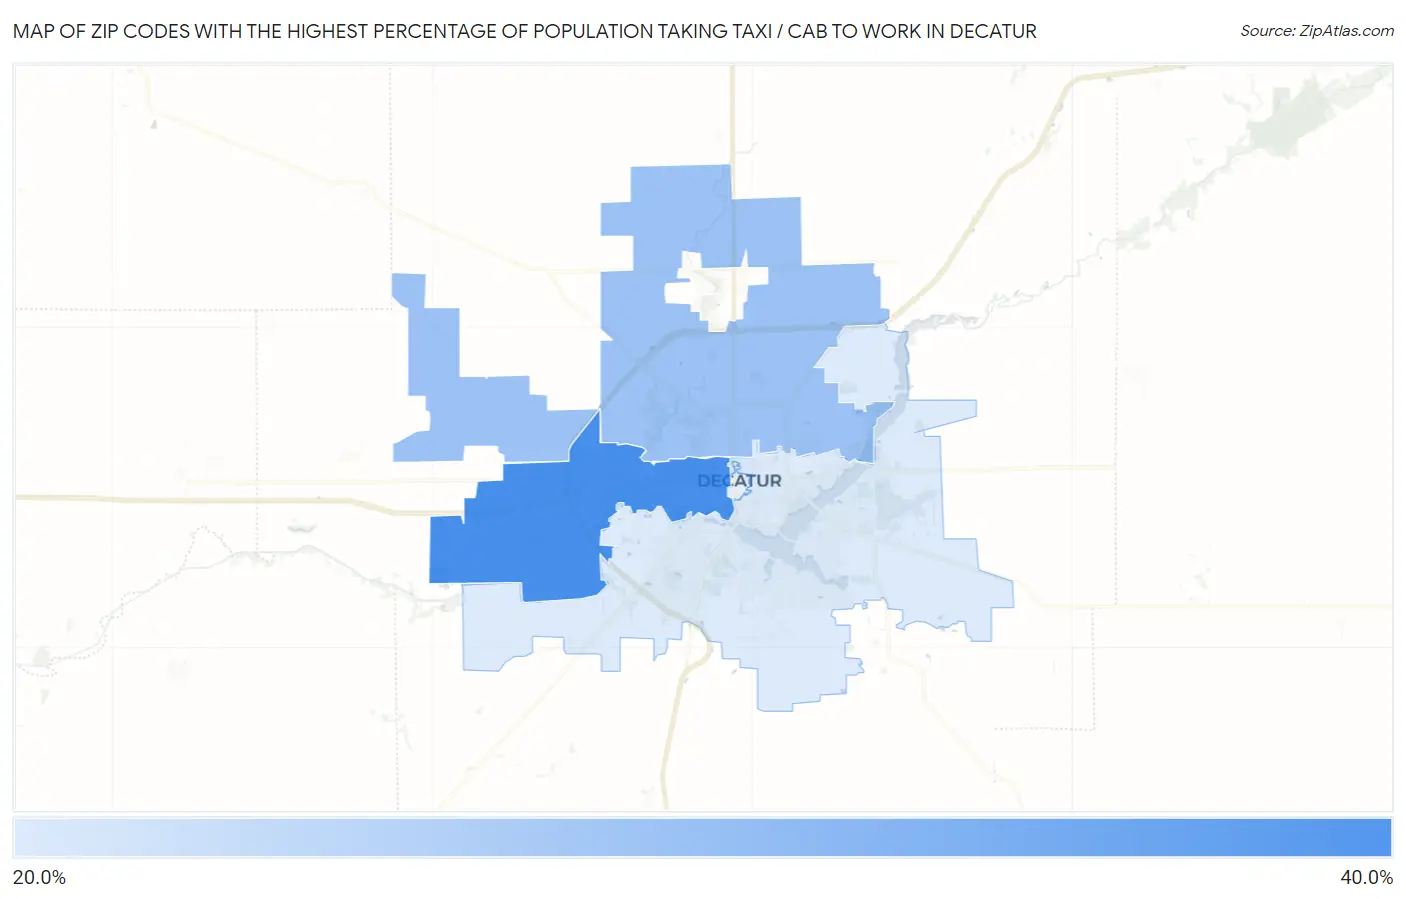
Zip Codes with the Highest Percentage of Population Taking Taxi / Cab to Work in Decatur, IL
RELATED REPORTS & OPTIONS
Taxi / Cab
Decatur
Compare Zip Codes
Map of Zip Codes with the Highest Percentage of Population Taking Taxi / Cab to Work in Decatur
26.1%
33.7%
Zip Codes with the Highest Percentage of Population Taking Taxi / Cab to Work in Decatur, IL
| Zip Code | % Take Taxi / Cab | vs State | vs National | |
| 1. | 62522 | 33.7% | 37.8%(-4.10)#360 | 38.2%(-4.50)#9,490 |
| 2. | 62526 | 29.4% | 37.8%(-8.40)#429 | 38.2%(-8.80)#11,144 |
| 3. | 62521 | 26.1% | 37.8%(-11.7)#461 | 38.2%(-12.1)#12,003 |
1
Common Questions
What are the Top 3 Zip Codes with the Highest Percentage of Population Taking Taxi / Cab to Work in Decatur, IL?
Top 3 Zip Codes with the Highest Percentage of Population Taking Taxi / Cab to Work in Decatur, IL are:
What zip code has the Highest Percentage of Population Taking Taxi / Cab to Work in Decatur, IL?
62522 has the Highest Percentage of Population Taking Taxi / Cab to Work in Decatur, IL with 33.7%.
What is the Percentage of Population Taking Taxi / Cab to Work in Decatur, IL?
Percentage of Population Taking Taxi / Cab to Work in Decatur is 29.4%.
What is the Percentage of Population Taking Taxi / Cab to Work in Illinois?
Percentage of Population Taking Taxi / Cab to Work in Illinois is 37.8%.
What is the Percentage of Population Taking Taxi / Cab to Work in the United States?
Percentage of Population Taking Taxi / Cab to Work in the United States is 38.2%.