Zip Codes with the Highest Percentage of Population Employed in Accommodation & Food Services in Bloomington, IL
RELATED REPORTS & OPTIONS
Accommodation & Food Services
Bloomington
Compare Zip Codes
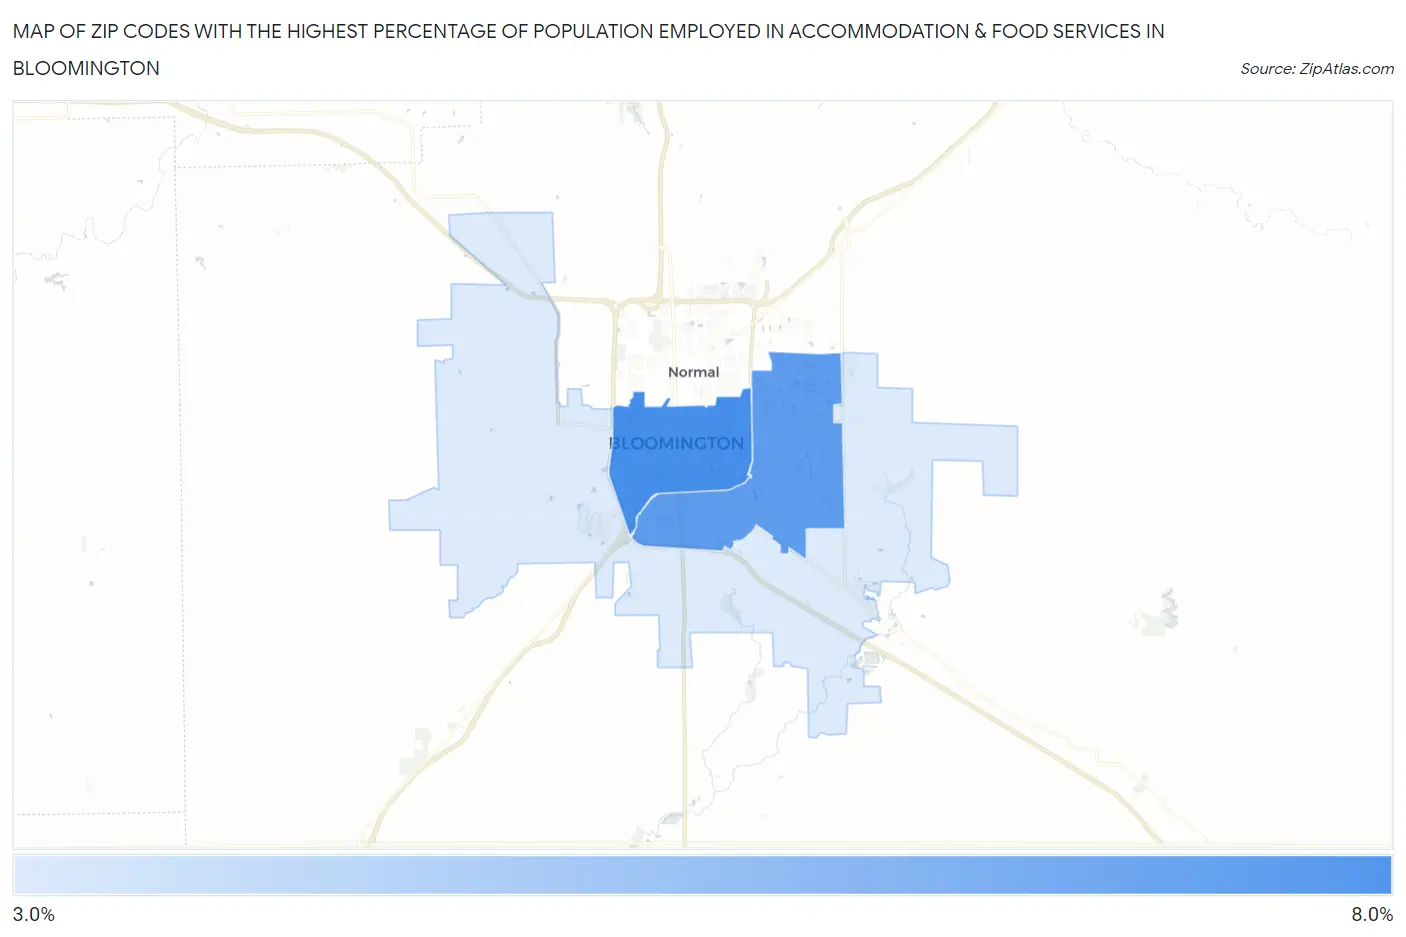
Map of Zip Codes with the Highest Percentage of Population Employed in Accommodation & Food Services in Bloomington
3.2%
7.3%
Zip Codes with the Highest Percentage of Population Employed in Accommodation & Food Services in Bloomington, IL
| Zip Code | % Employed | vs State | vs National | |
| 1. | 61701 | 7.3% | 6.5%(+0.877)#341 | 6.9%(+0.465)#9,389 |
| 2. | 61704 | 6.7% | 6.5%(+0.257)#411 | 6.9%(-0.155)#11,121 |
| 3. | 61705 | 3.2% | 6.5%(-3.23)#958 | 6.9%(-3.64)#22,580 |
1
Common Questions
What are the Top Zip Codes with the Highest Percentage of Population Employed in Accommodation & Food Services in Bloomington, IL?
Top Zip Codes with the Highest Percentage of Population Employed in Accommodation & Food Services in Bloomington, IL are:
What zip code has the Highest Percentage of Population Employed in Accommodation & Food Services in Bloomington, IL?
61701 has the Highest Percentage of Population Employed in Accommodation & Food Services in Bloomington, IL with 7.3%.
What is the Percentage of Population Employed in Accommodation & Food Services in Bloomington, IL?
Percentage of Population Employed in Accommodation & Food Services in Bloomington is 6.7%.
What is the Percentage of Population Employed in Accommodation & Food Services in Illinois?
Percentage of Population Employed in Accommodation & Food Services in Illinois is 6.5%.
What is the Percentage of Population Employed in Accommodation & Food Services in the United States?
Percentage of Population Employed in Accommodation & Food Services in the United States is 6.9%.