Zip Codes with the Highest Percentage of Population Taking Taxi / Cab to Work in Waterloo, IA
RELATED REPORTS & OPTIONS
Taxi / Cab
Waterloo
Compare Zip Codes
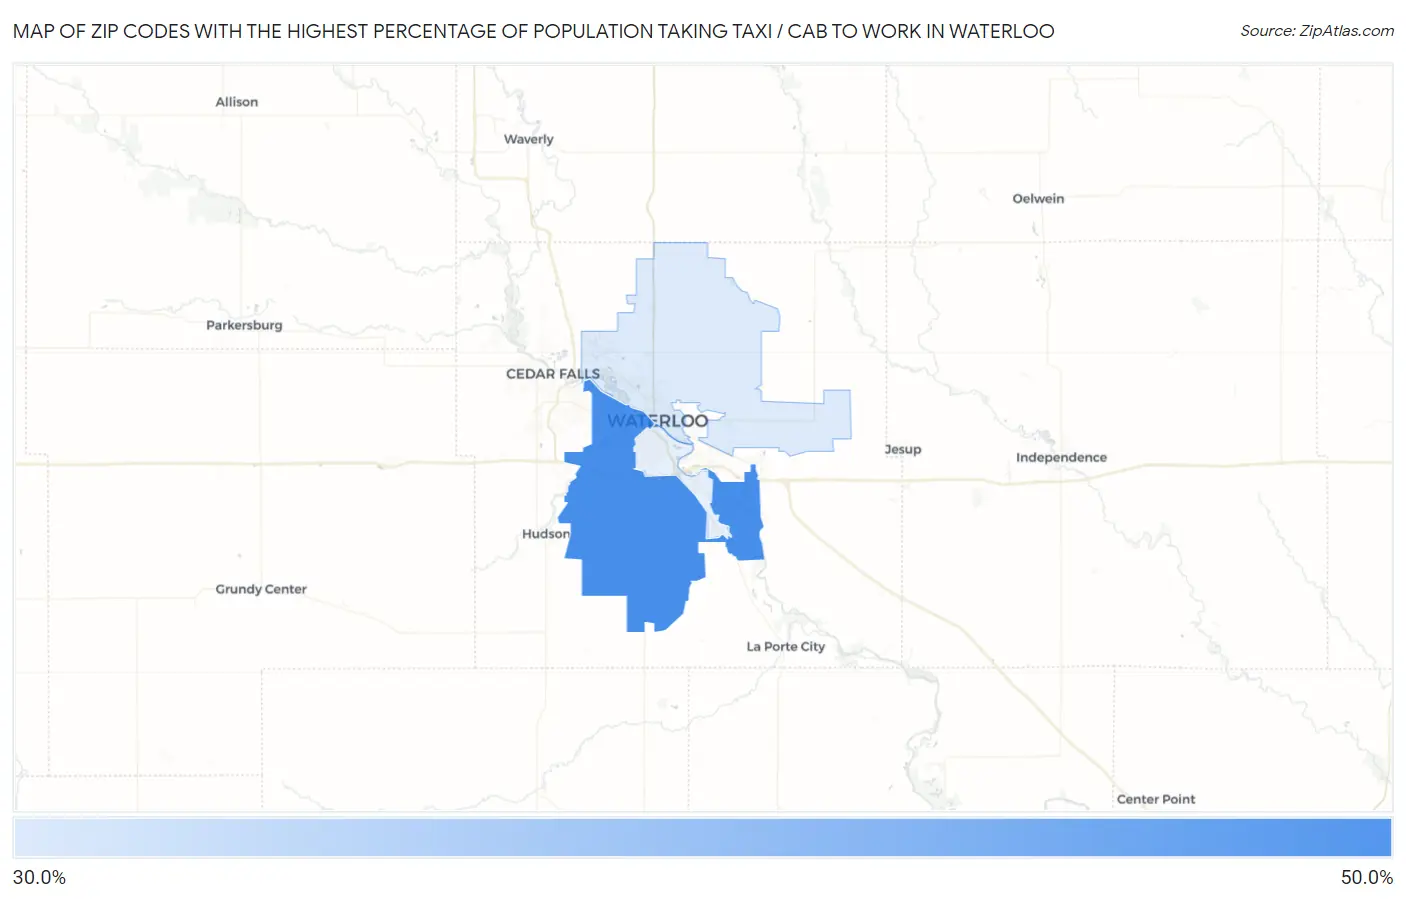
Map of Zip Codes with the Highest Percentage of Population Taking Taxi / Cab to Work in Waterloo
36.8%
40.6%
Zip Codes with the Highest Percentage of Population Taking Taxi / Cab to Work in Waterloo, IA
| Zip Code | % Take Taxi / Cab | vs State | vs National | |
| 1. | 50701 | 40.6% | 38.9%(+1.70)#99 | 38.2%(+2.40)#6,328 |
| 2. | 50703 | 36.8% | 38.9%(-2.10)#122 | 38.2%(-1.40)#8,048 |
1
Common Questions
What are the Top Zip Codes with the Highest Percentage of Population Taking Taxi / Cab to Work in Waterloo, IA?
Top Zip Codes with the Highest Percentage of Population Taking Taxi / Cab to Work in Waterloo, IA are:
What zip code has the Highest Percentage of Population Taking Taxi / Cab to Work in Waterloo, IA?
50701 has the Highest Percentage of Population Taking Taxi / Cab to Work in Waterloo, IA with 40.6%.
What is the Percentage of Population Taking Taxi / Cab to Work in Waterloo, IA?
Percentage of Population Taking Taxi / Cab to Work in Waterloo is 40.0%.
What is the Percentage of Population Taking Taxi / Cab to Work in Iowa?
Percentage of Population Taking Taxi / Cab to Work in Iowa is 38.9%.
What is the Percentage of Population Taking Taxi / Cab to Work in the United States?
Percentage of Population Taking Taxi / Cab to Work in the United States is 38.2%.