Zip Codes with the Highest Percentage of Population Employed in Office & Administration in Waterloo, IA
RELATED REPORTS & OPTIONS
Office & Administration
Waterloo
Compare Zip Codes
Map of Zip Codes with the Highest Percentage of Population Employed in Office & Administration in Waterloo
8.4%
11.2%
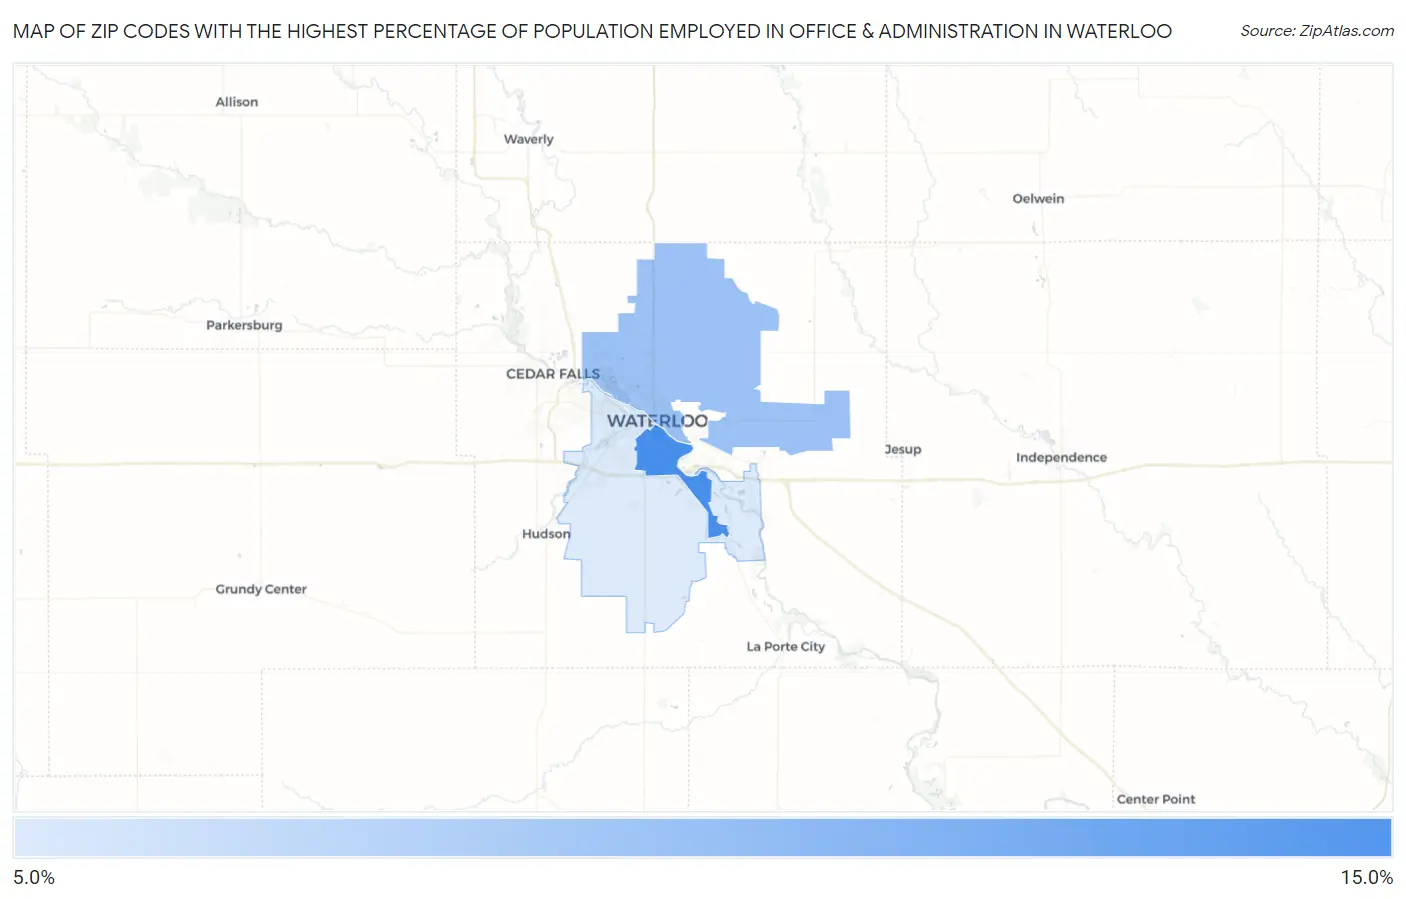
Zip Codes with the Highest Percentage of Population Employed in Office & Administration in Waterloo, IA
| Zip Code | % Employed | vs State | vs National | |
| 1. | 50702 | 11.2% | 10.6%(+0.523)#384 | 10.9%(+0.303)#13,340 |
| 2. | 50703 | 9.6% | 10.6%(-1.02)#516 | 10.9%(-1.24)#18,380 |
| 3. | 50701 | 8.4% | 10.6%(-2.23)#617 | 10.9%(-2.45)#21,929 |
1
Common Questions
What are the Top Zip Codes with the Highest Percentage of Population Employed in Office & Administration in Waterloo, IA?
Top Zip Codes with the Highest Percentage of Population Employed in Office & Administration in Waterloo, IA are:
What zip code has the Highest Percentage of Population Employed in Office & Administration in Waterloo, IA?
50702 has the Highest Percentage of Population Employed in Office & Administration in Waterloo, IA with 11.2%.
What is the Percentage of Population Employed in Office & Administration in Waterloo, IA?
Percentage of Population Employed in Office & Administration in Waterloo is 9.4%.
What is the Percentage of Population Employed in Office & Administration in Iowa?
Percentage of Population Employed in Office & Administration in Iowa is 10.6%.
What is the Percentage of Population Employed in Office & Administration in the United States?
Percentage of Population Employed in Office & Administration in the United States is 10.9%.