Zip Codes with the Highest Percentage of Population Employed in Security & Protection in Waterloo, IA
RELATED REPORTS & OPTIONS
Security & Protection
Waterloo
Compare Zip Codes
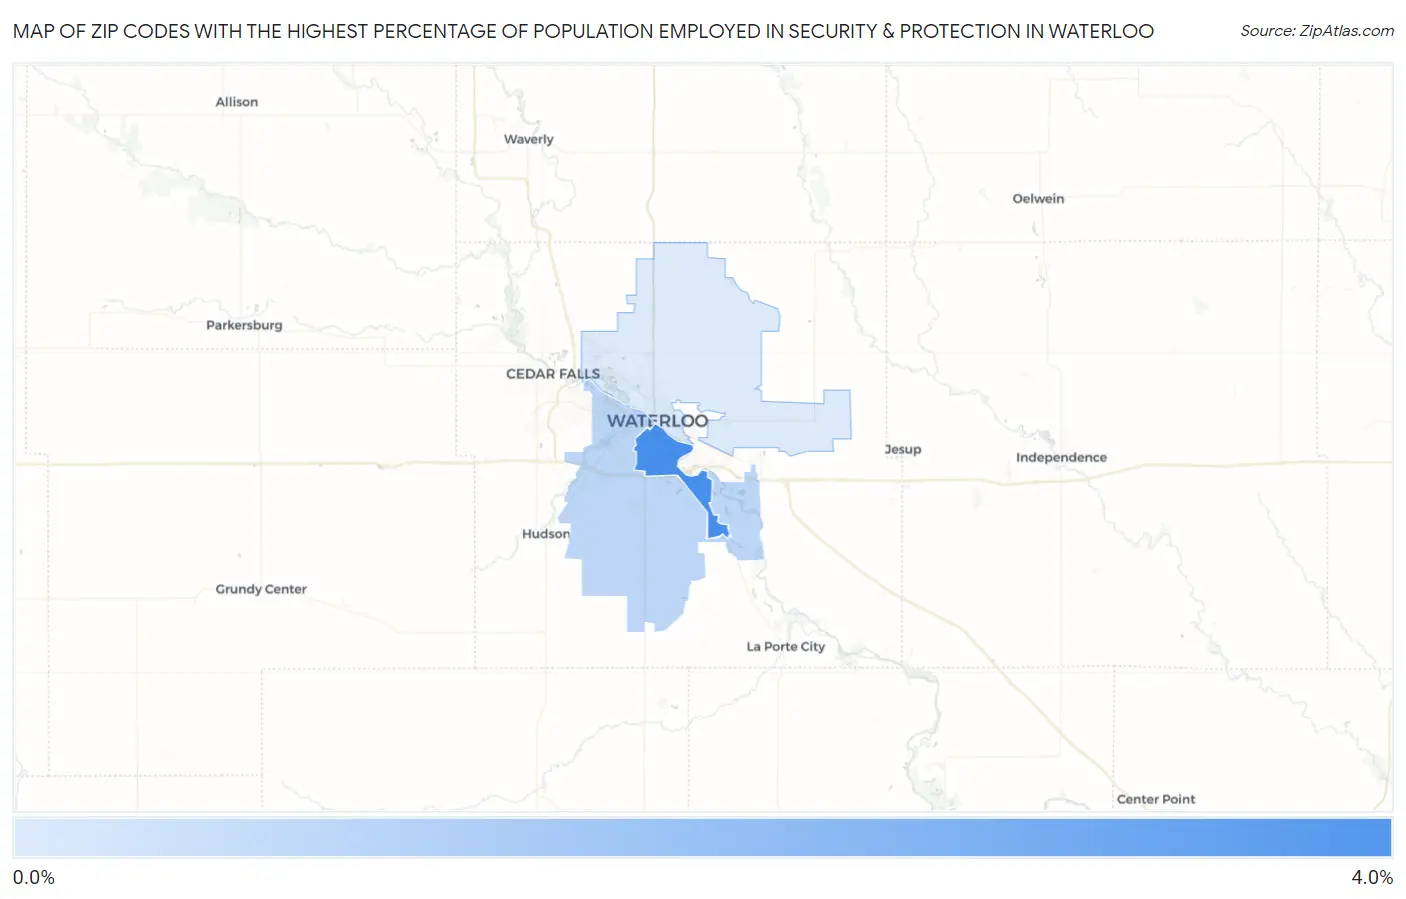
Map of Zip Codes with the Highest Percentage of Population Employed in Security & Protection in Waterloo
0.58%
3.6%
Zip Codes with the Highest Percentage of Population Employed in Security & Protection in Waterloo, IA
| Zip Code | % Employed | vs State | vs National | |
| 1. | 50702 | 3.6% | 1.4%(+2.21)#63 | 2.1%(+1.43)#5,453 |
| 2. | 50701 | 1.2% | 1.4%(-0.159)#335 | 2.1%(-0.935)#18,402 |
| 3. | 50703 | 0.58% | 1.4%(-0.797)#490 | 2.1%(-1.57)#22,802 |
1
Common Questions
What are the Top Zip Codes with the Highest Percentage of Population Employed in Security & Protection in Waterloo, IA?
Top Zip Codes with the Highest Percentage of Population Employed in Security & Protection in Waterloo, IA are:
What zip code has the Highest Percentage of Population Employed in Security & Protection in Waterloo, IA?
50702 has the Highest Percentage of Population Employed in Security & Protection in Waterloo, IA with 3.6%.
What is the Percentage of Population Employed in Security & Protection in Waterloo, IA?
Percentage of Population Employed in Security & Protection in Waterloo is 1.9%.
What is the Percentage of Population Employed in Security & Protection in Iowa?
Percentage of Population Employed in Security & Protection in Iowa is 1.4%.
What is the Percentage of Population Employed in Security & Protection in the United States?
Percentage of Population Employed in Security & Protection in the United States is 2.1%.