Zip Codes with the Highest Percentage of Population Employed in Food Preparation & Serving in Waterloo, IA
RELATED REPORTS & OPTIONS
Food Preparation & Serving
Waterloo
Compare Zip Codes
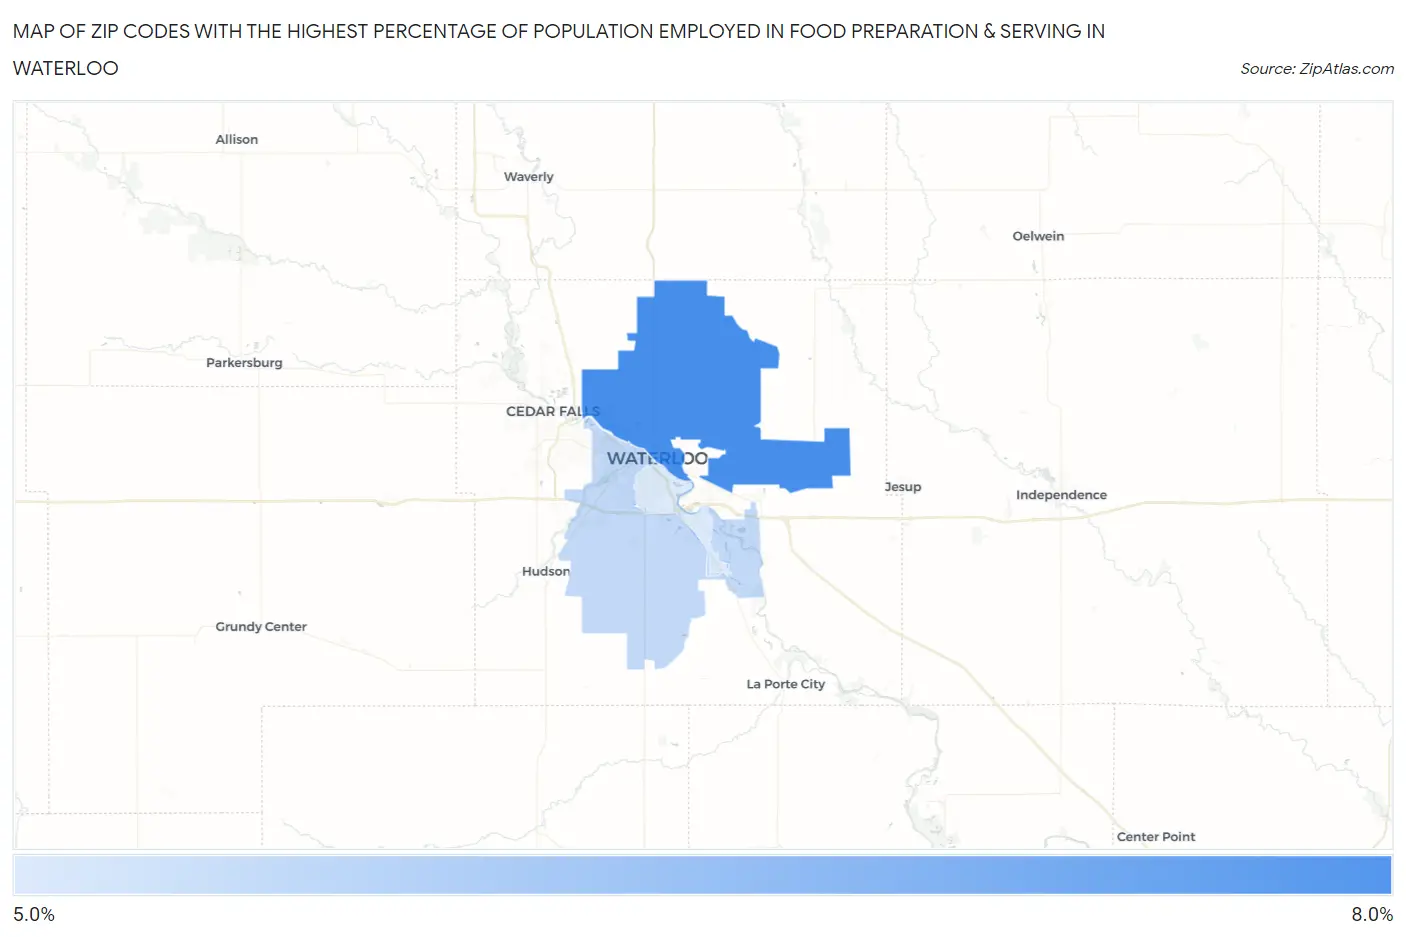
Map of Zip Codes with the Highest Percentage of Population Employed in Food Preparation & Serving in Waterloo
5.3%
7.0%
Zip Codes with the Highest Percentage of Population Employed in Food Preparation & Serving in Waterloo, IA
| Zip Code | % Employed | vs State | vs National | |
| 1. | 50703 | 7.0% | 5.1%(+1.89)#129 | 5.3%(+1.72)#6,561 |
| 2. | 50701 | 5.6% | 5.1%(+0.465)#233 | 5.3%(+0.293)#10,774 |
| 3. | 50702 | 5.3% | 5.1%(+0.156)#267 | 5.3%(-0.017)#11,870 |
1
Common Questions
What are the Top Zip Codes with the Highest Percentage of Population Employed in Food Preparation & Serving in Waterloo, IA?
Top Zip Codes with the Highest Percentage of Population Employed in Food Preparation & Serving in Waterloo, IA are:
What zip code has the Highest Percentage of Population Employed in Food Preparation & Serving in Waterloo, IA?
50703 has the Highest Percentage of Population Employed in Food Preparation & Serving in Waterloo, IA with 7.0%.
What is the Percentage of Population Employed in Food Preparation & Serving in Waterloo, IA?
Percentage of Population Employed in Food Preparation & Serving in Waterloo is 6.0%.
What is the Percentage of Population Employed in Food Preparation & Serving in Iowa?
Percentage of Population Employed in Food Preparation & Serving in Iowa is 5.1%.
What is the Percentage of Population Employed in Food Preparation & Serving in the United States?
Percentage of Population Employed in Food Preparation & Serving in the United States is 5.3%.