Zip Codes with the Highest Percentage of Population Employed in Community & Social Service in Waterloo, IA
RELATED REPORTS & OPTIONS
Community & Social Service
Waterloo
Compare Zip Codes
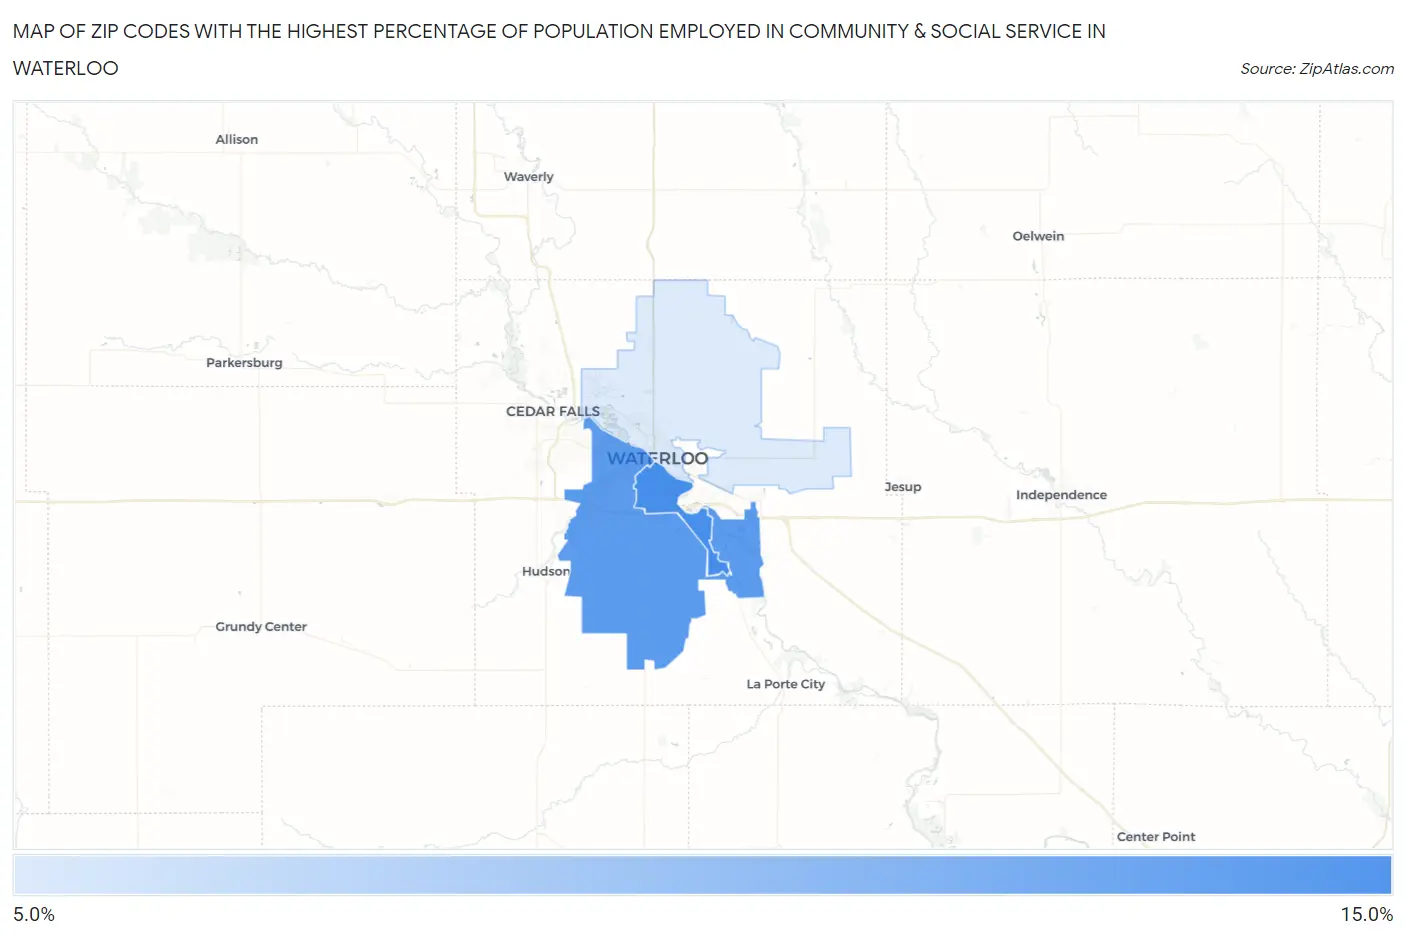
Map of Zip Codes with the Highest Percentage of Population Employed in Community & Social Service in Waterloo
6.7%
10.8%
Zip Codes with the Highest Percentage of Population Employed in Community & Social Service in Waterloo, IA
| Zip Code | % Employed | vs State | vs National | |
| 1. | 50702 | 10.8% | 10.3%(+0.499)#223 | 11.2%(-0.385)#12,058 |
| 2. | 50701 | 10.3% | 10.3%(-0.051)#258 | 11.2%(-0.935)#13,414 |
| 3. | 50703 | 6.7% | 10.3%(-3.65)#575 | 11.2%(-4.53)#22,852 |
1
Common Questions
What are the Top Zip Codes with the Highest Percentage of Population Employed in Community & Social Service in Waterloo, IA?
Top Zip Codes with the Highest Percentage of Population Employed in Community & Social Service in Waterloo, IA are:
What zip code has the Highest Percentage of Population Employed in Community & Social Service in Waterloo, IA?
50702 has the Highest Percentage of Population Employed in Community & Social Service in Waterloo, IA with 10.8%.
What is the Percentage of Population Employed in Community & Social Service in Waterloo, IA?
Percentage of Population Employed in Community & Social Service in Waterloo is 9.5%.
What is the Percentage of Population Employed in Community & Social Service in Iowa?
Percentage of Population Employed in Community & Social Service in Iowa is 10.3%.
What is the Percentage of Population Employed in Community & Social Service in the United States?
Percentage of Population Employed in Community & Social Service in the United States is 11.2%.