Laie, HI Map & Demographics
Laie Map
Laie Overview
$24,420
PER CAPITA INCOME
$118,750
AVG FAMILY INCOME
$108,965
AVG HOUSEHOLD INCOME
64.4%
WAGE / INCOME GAP [ % ]
35.6¢/ $1
WAGE / INCOME GAP [ $ ]
0.37
INEQUALITY / GINI INDEX
5,411
TOTAL POPULATION
2,524
MALE POPULATION
2,887
FEMALE POPULATION
87.43
MALES / 100 FEMALES
114.38
FEMALES / 100 MALES
23.7
MEDIAN AGE
4.6
AVG FAMILY SIZE
4.2
AVG HOUSEHOLD SIZE
3,011
LABOR FORCE [ PEOPLE ]
68.8%
PERCENT IN LABOR FORCE
9.0%
UNEMPLOYMENT RATE
Laie Zip Codes
Laie Area Codes
Income in Laie
Income Overview in Laie
Per Capita Income in Laie is $24,420, while median incomes of families and households are $118,750 and $108,965 respectively.
| Characteristic | Number | Measure |
| Per Capita Income | 5,411 | $24,420 |
| Median Family Income | 771 | $118,750 |
| Mean Family Income | 771 | $134,600 |
| Median Household Income | 1,017 | $108,965 |
| Mean Household Income | 1,017 | $116,501 |
| Income Deficit | 771 | $0 |
| Wage / Income Gap (%) | 5,411 | 64.39% |
| Wage / Income Gap ($) | 5,411 | 35.61¢ per $1 |
| Gini / Inequality Index | 5,411 | 0.37 |
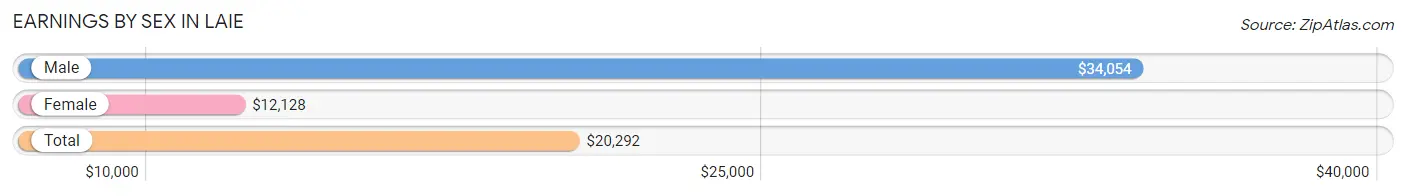
Earnings by Sex in Laie
Average Earnings in Laie are $20,292, $34,054 for men and $12,128 for women, a difference of 64.4%.
| Sex | Number | Average Earnings |
| Male | 1,467 (45.7%) | $34,054 |
| Female | 1,743 (54.3%) | $12,128 |
| Total | 3,210 (100.0%) | $20,292 |
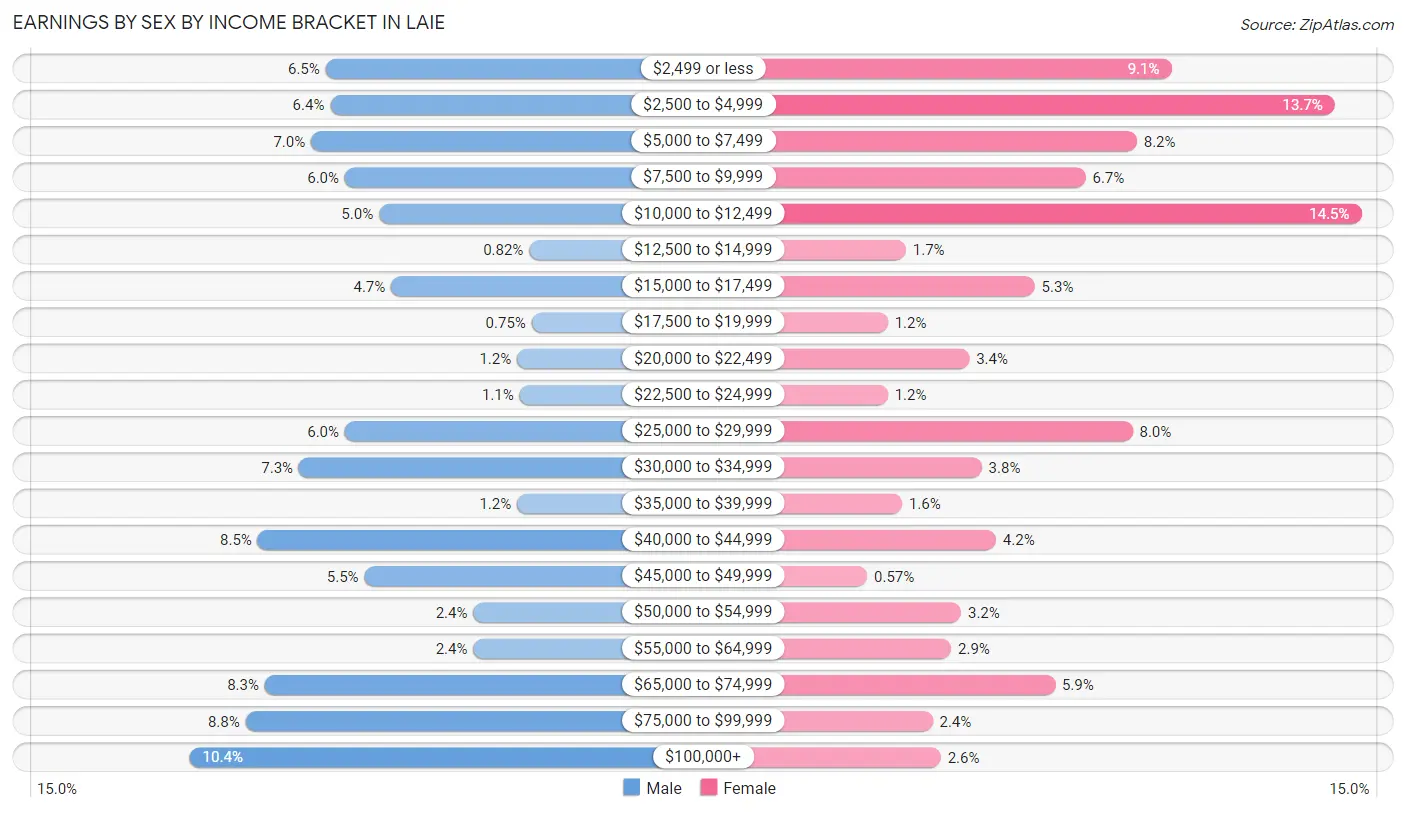
Earnings by Sex by Income Bracket in Laie
The most common earnings brackets in Laie are $100,000+ for men (152 | 10.4%) and $10,000 to $12,499 for women (252 | 14.5%).
| Income | Male | Female |
| $2,499 or less | 96 (6.5%) | 159 (9.1%) |
| $2,500 to $4,999 | 94 (6.4%) | 239 (13.7%) |
| $5,000 to $7,499 | 102 (7.0%) | 142 (8.2%) |
| $7,500 to $9,999 | 88 (6.0%) | 117 (6.7%) |
| $10,000 to $12,499 | 74 (5.0%) | 252 (14.5%) |
| $12,500 to $14,999 | 12 (0.8%) | 29 (1.7%) |
| $15,000 to $17,499 | 69 (4.7%) | 92 (5.3%) |
| $17,500 to $19,999 | 11 (0.7%) | 20 (1.1%) |
| $20,000 to $22,499 | 17 (1.2%) | 60 (3.4%) |
| $22,500 to $24,999 | 16 (1.1%) | 20 (1.1%) |
| $25,000 to $29,999 | 88 (6.0%) | 140 (8.0%) |
| $30,000 to $34,999 | 107 (7.3%) | 66 (3.8%) |
| $35,000 to $39,999 | 17 (1.2%) | 27 (1.5%) |
| $40,000 to $44,999 | 124 (8.5%) | 73 (4.2%) |
| $45,000 to $49,999 | 80 (5.4%) | 10 (0.6%) |
| $50,000 to $54,999 | 35 (2.4%) | 56 (3.2%) |
| $55,000 to $64,999 | 35 (2.4%) | 51 (2.9%) |
| $65,000 to $74,999 | 121 (8.3%) | 102 (5.9%) |
| $75,000 to $99,999 | 129 (8.8%) | 42 (2.4%) |
| $100,000+ | 152 (10.4%) | 46 (2.6%) |
| Total | 1,467 (100.0%) | 1,743 (100.0%) |
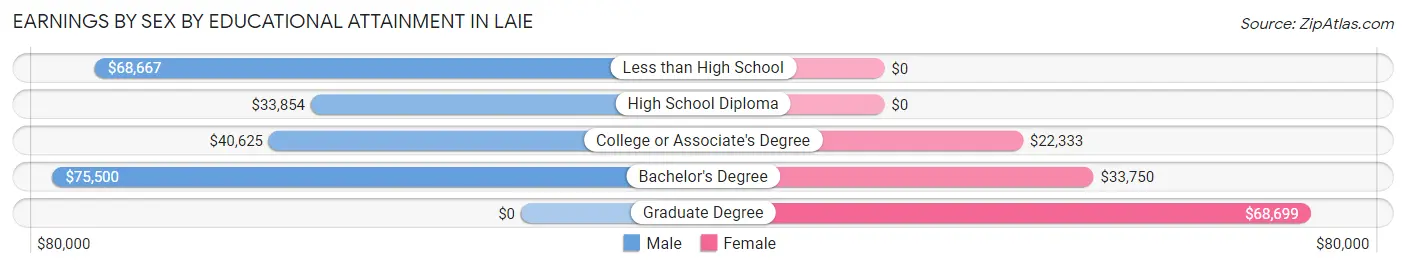
Earnings by Sex by Educational Attainment in Laie
Average earnings in Laie are $44,722 for men and $34,956 for women, a difference of 21.8%. Men with an educational attainment of bachelor's degree enjoy the highest average annual earnings of $75,500, while those with high school diploma education earn the least with $33,854. Women with an educational attainment of graduate degree earn the most with the average annual earnings of $68,699, while those with college or associate's degree education have the smallest earnings of $22,333.
| Educational Attainment | Male Income | Female Income |
| Less than High School | $68,667 | $0 |
| High School Diploma | $33,854 | $0 |
| College or Associate's Degree | $40,625 | $22,333 |
| Bachelor's Degree | $75,500 | $33,750 |
| Graduate Degree | - | - |
| Total | $44,722 | $34,956 |
Family Income in Laie
Family Income Brackets in Laie
According to the Laie family income data, there are 260 families falling into the $100,000 to $149,999 income range, which is the most common income bracket and makes up 33.7% of all families.
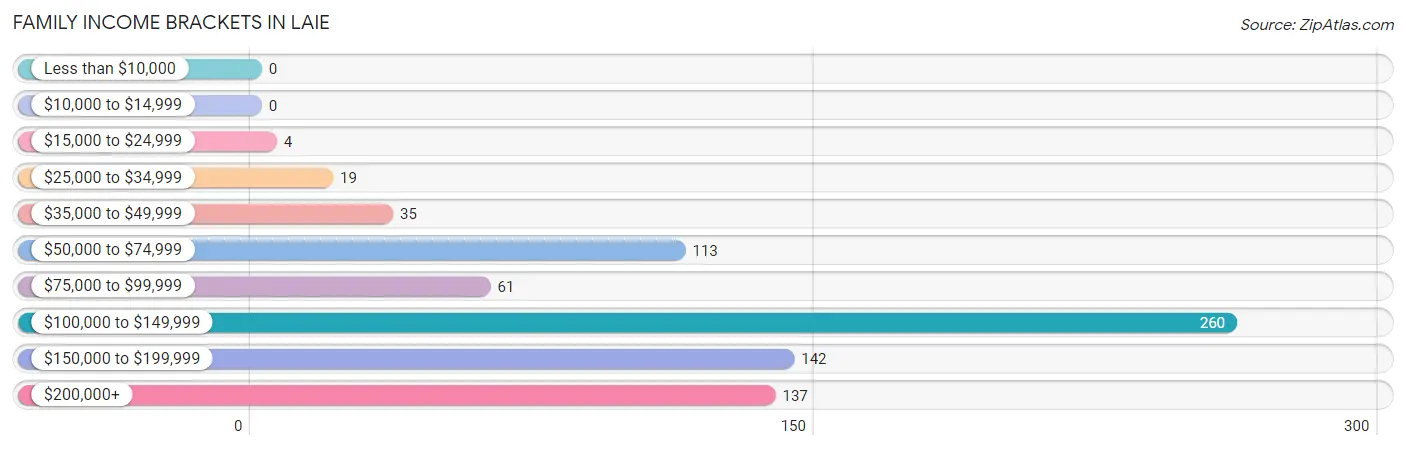
| Income Bracket | # Families | % Families |
| Less than $10,000 | 0 | 0.0% |
| $10,000 to $14,999 | 0 | 0.0% |
| $15,000 to $24,999 | 4 | 0.5% |
| $25,000 to $34,999 | 19 | 2.5% |
| $35,000 to $49,999 | 35 | 4.5% |
| $50,000 to $74,999 | 113 | 14.7% |
| $75,000 to $99,999 | 61 | 7.9% |
| $100,000 to $149,999 | 260 | 33.7% |
| $150,000 to $199,999 | 142 | 18.4% |
| $200,000+ | 137 | 17.8% |
Family Income by Famaliy Size in Laie
5-person families (125 | 16.2%) account for the highest median family income in Laie with $153,442 per family, while 3-person families (134 | 17.4%) have the highest median income of $37,083 per family member.
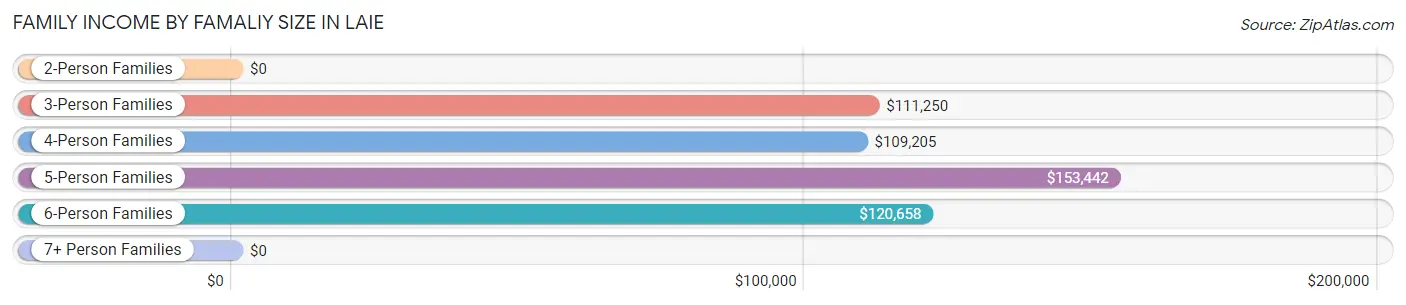
| Income Bracket | # Families | Median Income |
| 2-Person Families | 134 (17.4%) | $0 |
| 3-Person Families | 134 (17.4%) | $111,250 |
| 4-Person Families | 143 (18.5%) | $109,205 |
| 5-Person Families | 125 (16.2%) | $153,442 |
| 6-Person Families | 104 (13.5%) | $120,658 |
| 7+ Person Families | 131 (17.0%) | $0 |
| Total | 771 (100.0%) | $118,750 |
Family Income by Number of Earners in Laie
The median family income in Laie is $118,750, with families comprising 3+ earners (288) having the highest median family income of $153,072, while families with no earners (29) have the lowest median family income of $68,295, accounting for 37.3% and 3.8% of families, respectively.
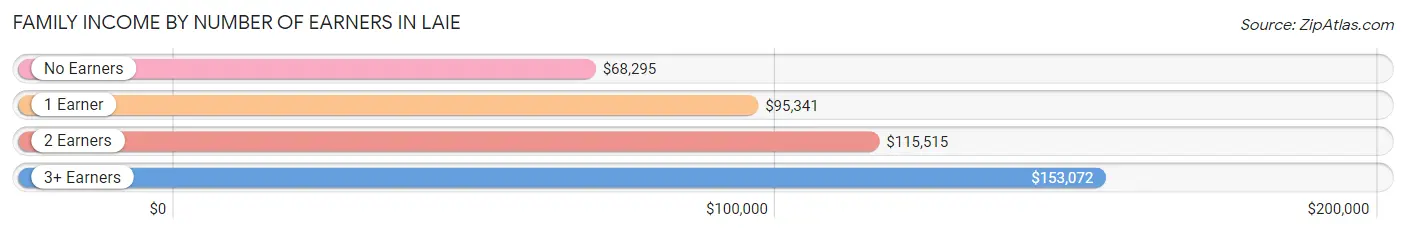
| Number of Earners | # Families | Median Income |
| No Earners | 29 (3.8%) | $68,295 |
| 1 Earner | 213 (27.6%) | $95,341 |
| 2 Earners | 241 (31.3%) | $115,515 |
| 3+ Earners | 288 (37.3%) | $153,072 |
| Total | 771 (100.0%) | $118,750 |
Household Income in Laie
Household Income Brackets in Laie
With 286 households falling in the category, the $100,000 to $149,999 income range is the most frequent in Laie, accounting for 28.1% of all households. In contrast, only 19 households (1.9%) fall into the $25,000 to $34,999 income bracket, making it the least populous group.
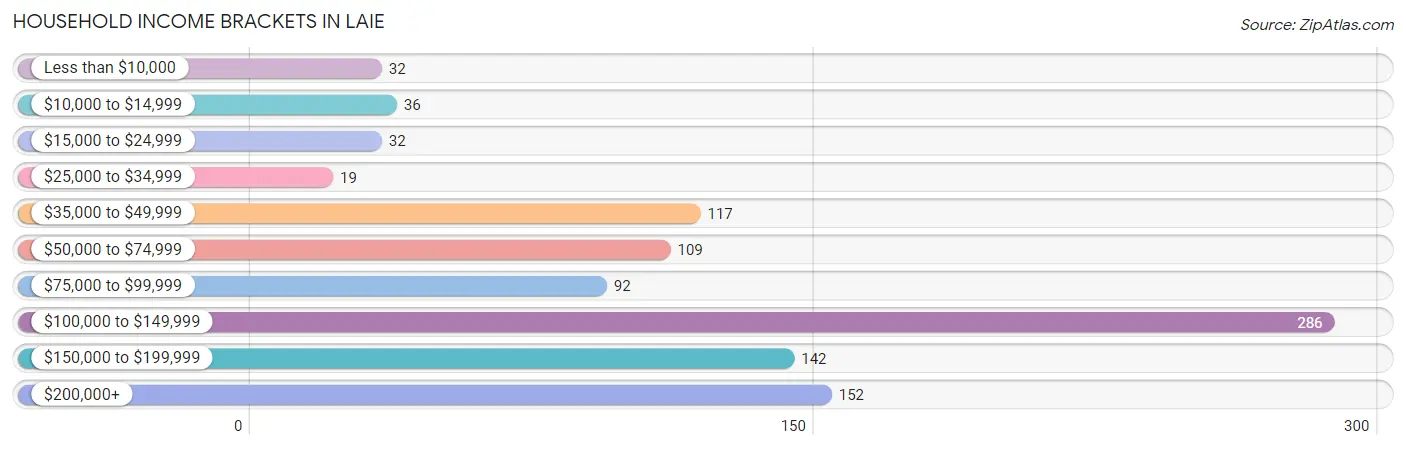
| Income Bracket | # Households | % Households |
| Less than $10,000 | 32 | 3.1% |
| $10,000 to $14,999 | 36 | 3.5% |
| $15,000 to $24,999 | 32 | 3.1% |
| $25,000 to $34,999 | 19 | 1.9% |
| $35,000 to $49,999 | 117 | 11.5% |
| $50,000 to $74,999 | 109 | 10.7% |
| $75,000 to $99,999 | 92 | 9.0% |
| $100,000 to $149,999 | 286 | 28.1% |
| $150,000 to $199,999 | 142 | 14.0% |
| $200,000+ | 152 | 14.9% |
Household Income by Householder Age in Laie
The median household income in Laie is $108,965, with the highest median household income of $132,083 found in the 45 to 64 years age bracket for the primary householder. A total of 324 households (31.9%) fall into this category. Meanwhile, the 15 to 24 years age bracket for the primary householder has the lowest median household income of $49,052, with 173 households (17.0%) in this group.
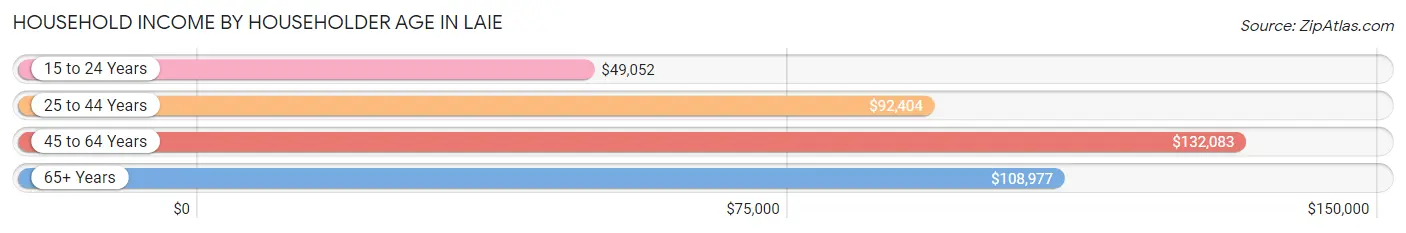
| Income Bracket | # Households | Median Income |
| 15 to 24 Years | 173 (17.0%) | $49,052 |
| 25 to 44 Years | 279 (27.4%) | $92,404 |
| 45 to 64 Years | 324 (31.9%) | $132,083 |
| 65+ Years | 241 (23.7%) | $108,977 |
| Total | 1,017 (100.0%) | $108,965 |
Poverty in Laie
Income Below Poverty by Sex and Age in Laie
With 3.1% poverty level for males and 17.4% for females among the residents of Laie, under 5 year old males and 5 year old females are the most vulnerable to poverty, with 16 males (15.8%) and 17 females (100.0%) in their respective age groups living below the poverty level.
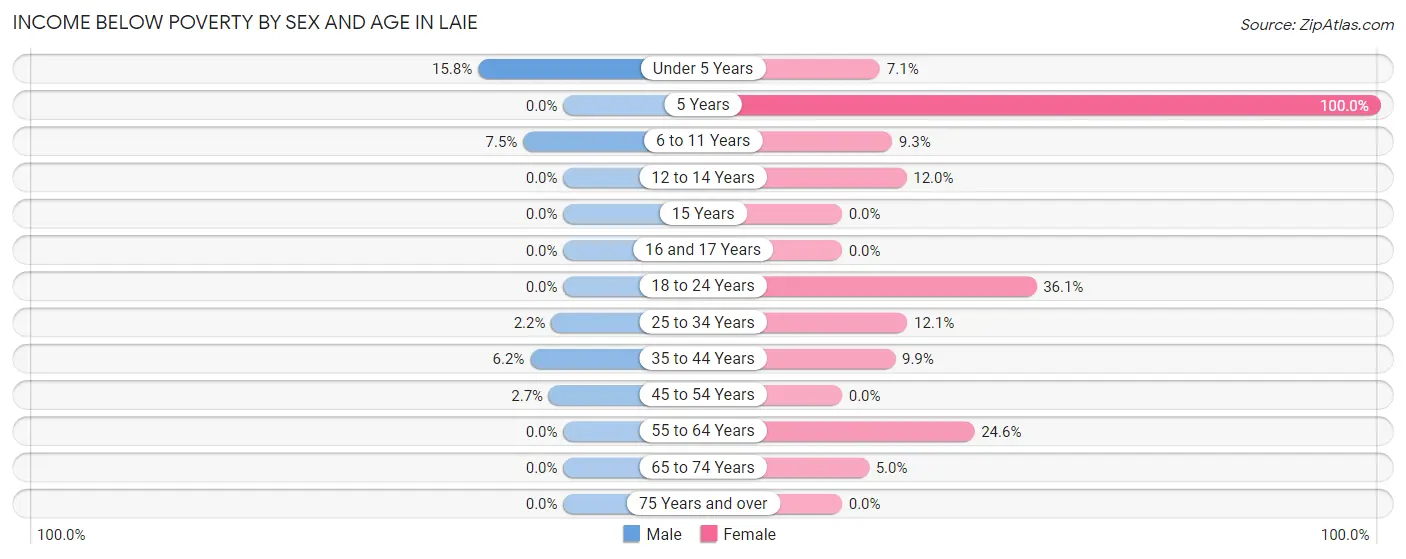
| Age Bracket | Male | Female |
| Under 5 Years | 16 (15.8%) | 7 (7.1%) |
| 5 Years | 0 (0.0%) | 17 (100.0%) |
| 6 to 11 Years | 14 (7.4%) | 16 (9.3%) |
| 12 to 14 Years | 0 (0.0%) | 17 (12.0%) |
| 15 Years | 0 (0.0%) | 0 (0.0%) |
| 16 and 17 Years | 0 (0.0%) | 0 (0.0%) |
| 18 to 24 Years | 0 (0.0%) | 228 (36.1%) |
| 25 to 34 Years | 7 (2.2%) | 29 (12.1%) |
| 35 to 44 Years | 16 (6.1%) | 25 (9.9%) |
| 45 to 54 Years | 6 (2.7%) | 0 (0.0%) |
| 55 to 64 Years | 0 (0.0%) | 44 (24.6%) |
| 65 to 74 Years | 0 (0.0%) | 10 (5.0%) |
| 75 Years and over | 0 (0.0%) | 0 (0.0%) |
| Total | 59 (3.1%) | 393 (17.4%) |
Income Above Poverty by Sex and Age in Laie
According to the poverty statistics in Laie, males aged 5 years and females aged 15 years are the age groups that are most secure financially, with 100.0% of males and 100.0% of females in these age groups living above the poverty line.
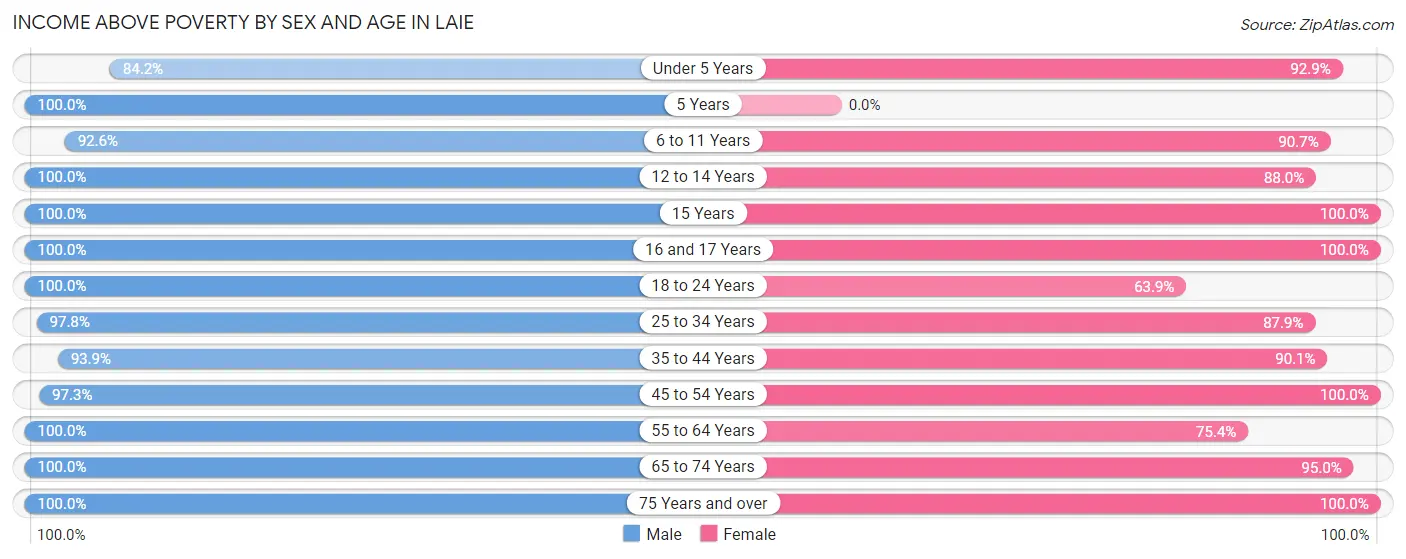
| Age Bracket | Male | Female |
| Under 5 Years | 85 (84.2%) | 92 (92.9%) |
| 5 Years | 31 (100.0%) | 0 (0.0%) |
| 6 to 11 Years | 174 (92.5%) | 156 (90.7%) |
| 12 to 14 Years | 139 (100.0%) | 125 (88.0%) |
| 15 Years | 48 (100.0%) | 26 (100.0%) |
| 16 and 17 Years | 130 (100.0%) | 66 (100.0%) |
| 18 to 24 Years | 167 (100.0%) | 404 (63.9%) |
| 25 to 34 Years | 305 (97.8%) | 210 (87.9%) |
| 35 to 44 Years | 244 (93.9%) | 228 (90.1%) |
| 45 to 54 Years | 218 (97.3%) | 199 (100.0%) |
| 55 to 64 Years | 127 (100.0%) | 135 (75.4%) |
| 65 to 74 Years | 154 (100.0%) | 190 (95.0%) |
| 75 Years and over | 17 (100.0%) | 31 (100.0%) |
| Total | 1,839 (96.9%) | 1,862 (82.6%) |
Income Below Poverty Among Married-Couple Families in Laie
The poverty statistics for married-couple families in Laie show that 2.8% or 19 of the total 676 families live below the poverty line. Families with 5 or more children have the highest poverty rate of 41.2%, comprising of 14 families. On the other hand, families with no children have the lowest poverty rate of 0.0%, which includes 0 families.
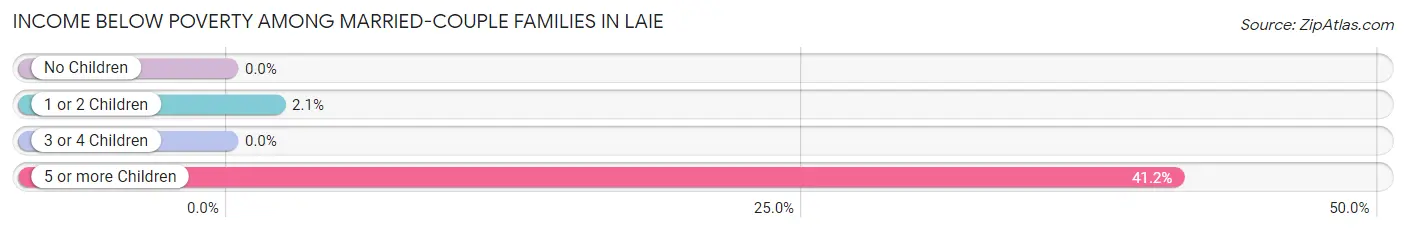
| Children | Above Poverty | Below Poverty |
| No Children | 229 (100.0%) | 0 (0.0%) |
| 1 or 2 Children | 239 (98.0%) | 5 (2.1%) |
| 3 or 4 Children | 169 (100.0%) | 0 (0.0%) |
| 5 or more Children | 20 (58.8%) | 14 (41.2%) |
| Total | 657 (97.2%) | 19 (2.8%) |
Income Below Poverty Among Single-Parent Households in Laie
| Children | Single Father | Single Mother |
| No Children | 0 (0.0%) | 0 (0.0%) |
| 1 or 2 Children | 0 (0.0%) | 0 (0.0%) |
| 3 or 4 Children | 0 (0.0%) | 0 (0.0%) |
| 5 or more Children | 0 (0.0%) | 0 (0.0%) |
| Total | 0 (0.0%) | 0 (0.0%) |
Income Below Poverty Among Married-Couple vs Single-Parent Households in Laie
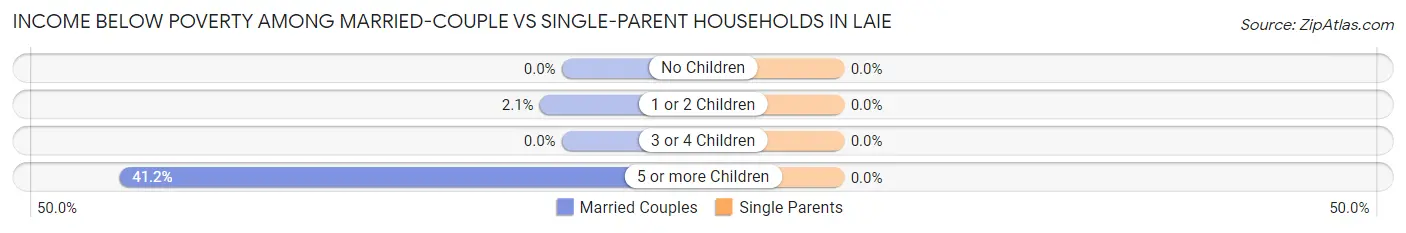
| Children | Married-Couple Families | Single-Parent Households |
| No Children | 0 (0.0%) | 0 (0.0%) |
| 1 or 2 Children | 5 (2.1%) | 0 (0.0%) |
| 3 or 4 Children | 0 (0.0%) | 0 (0.0%) |
| 5 or more Children | 14 (41.2%) | 0 (0.0%) |
| Total | 19 (2.8%) | 0 (0.0%) |
Race in Laie
The most populous races in Laie are Hawaiian / Pacific (1,691 | 31.2%), White / Caucasian (1,569 | 29.0%), and Two or more Races (1,423 | 26.3%).
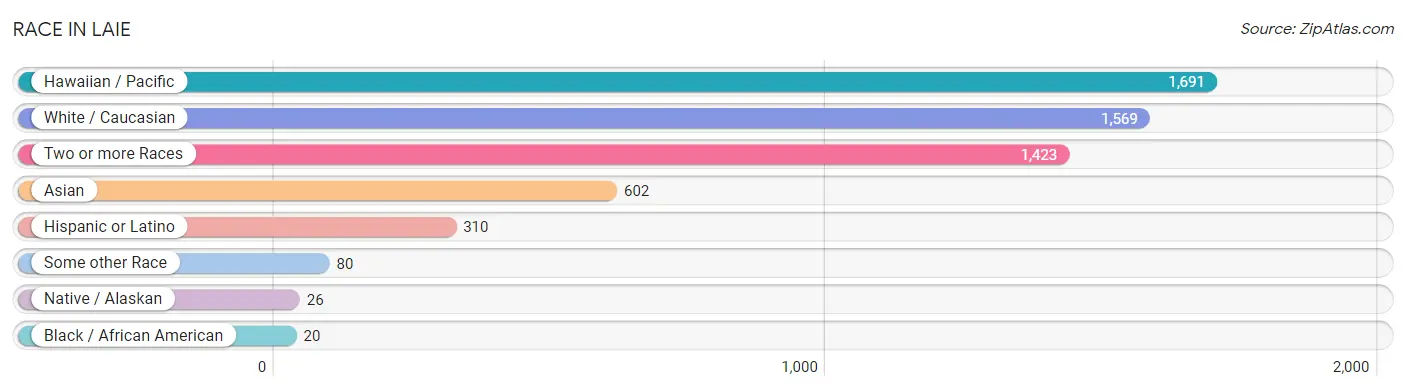
| Race | # Population | % Population |
| Asian | 602 | 11.1% |
| Black / African American | 20 | 0.4% |
| Hawaiian / Pacific | 1,691 | 31.2% |
| Hispanic or Latino | 310 | 5.7% |
| Native / Alaskan | 26 | 0.5% |
| White / Caucasian | 1,569 | 29.0% |
| Two or more Races | 1,423 | 26.3% |
| Some other Race | 80 | 1.5% |
| Total | 5,411 | 100.0% |
Ancestry in Laie
The most populous ancestries reported in Laie are Samoan (1,191 | 22.0%), Native Hawaiian (1,176 | 21.7%), Tongan (940 | 17.4%), Indian (Asian) (546 | 10.1%), and English (500 | 9.2%), together accounting for 80.4% of all Laie residents.
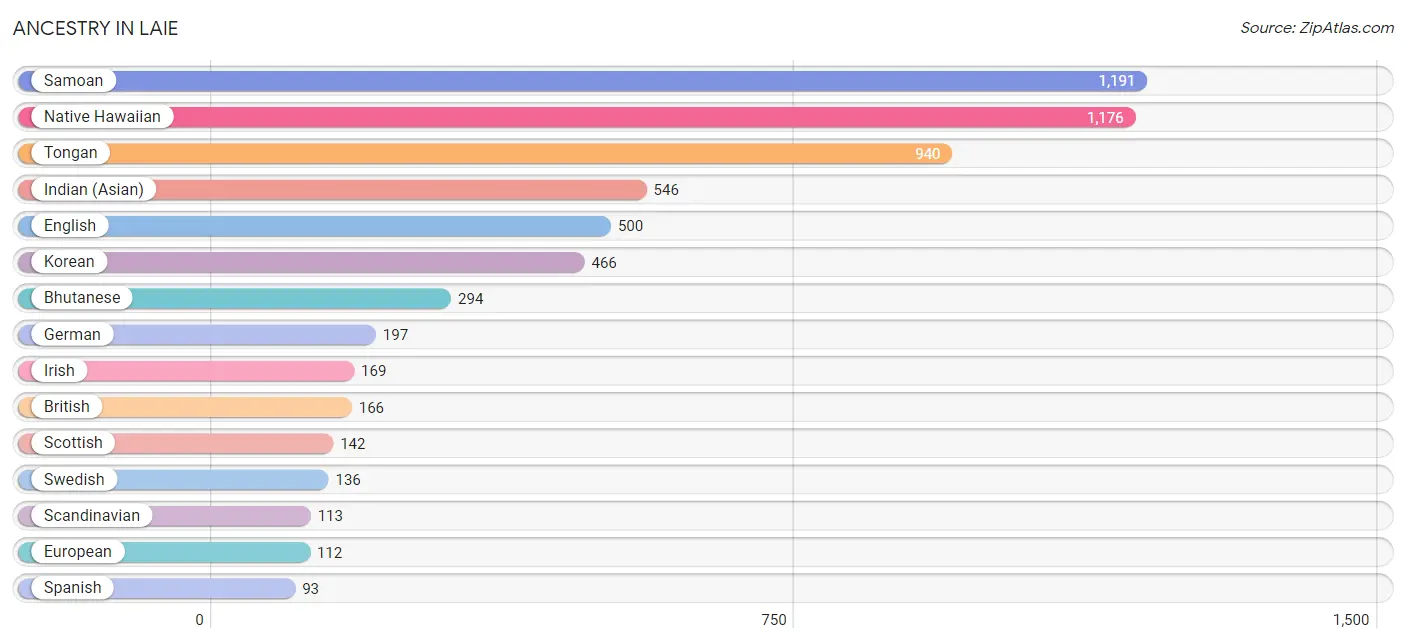
| Ancestry | # Population | % Population |
| Afghan | 2 | 0.0% |
| African | 9 | 0.2% |
| American | 21 | 0.4% |
| Arab | 2 | 0.0% |
| Australian | 4 | 0.1% |
| Bhutanese | 294 | 5.4% |
| British | 166 | 3.1% |
| Burmese | 59 | 1.1% |
| Cambodian | 10 | 0.2% |
| Central American | 19 | 0.4% |
| Central American Indian | 6 | 0.1% |
| Chilean | 20 | 0.4% |
| Chinese | 1 | 0.0% |
| Chippewa | 14 | 0.3% |
| Croatian | 5 | 0.1% |
| Danish | 67 | 1.2% |
| Dutch | 3 | 0.1% |
| English | 500 | 9.2% |
| European | 112 | 2.1% |
| French | 37 | 0.7% |
| German | 197 | 3.6% |
| Guamanian / Chamorro | 4 | 0.1% |
| Guatemalan | 4 | 0.1% |
| Indian (Asian) | 546 | 10.1% |
| Indonesian | 6 | 0.1% |
| Iranian | 44 | 0.8% |
| Irish | 169 | 3.1% |
| Italian | 72 | 1.3% |
| Korean | 466 | 8.6% |
| Laotian | 44 | 0.8% |
| Latvian | 14 | 0.3% |
| Lebanese | 2 | 0.0% |
| Lithuanian | 14 | 0.3% |
| Mexican | 61 | 1.1% |
| Mongolian | 11 | 0.2% |
| Native Hawaiian | 1,176 | 21.7% |
| New Zealander | 39 | 0.7% |
| Northern European | 5 | 0.1% |
| Norwegian | 34 | 0.6% |
| Paiute | 3 | 0.1% |
| Pakistani | 9 | 0.2% |
| Panamanian | 15 | 0.3% |
| Polish | 4 | 0.1% |
| Portuguese | 24 | 0.4% |
| Puerto Rican | 31 | 0.6% |
| Samoan | 1,191 | 22.0% |
| Scandinavian | 113 | 2.1% |
| Scotch-Irish | 74 | 1.4% |
| Scottish | 142 | 2.6% |
| South American | 20 | 0.4% |
| Spaniard | 23 | 0.4% |
| Spanish | 93 | 1.7% |
| Sri Lankan | 7 | 0.1% |
| Subsaharan African | 9 | 0.2% |
| Swedish | 136 | 2.5% |
| Swiss | 41 | 0.8% |
| Thai | 26 | 0.5% |
| Tongan | 940 | 17.4% |
| Welsh | 3 | 0.1% | View All 59 Rows |
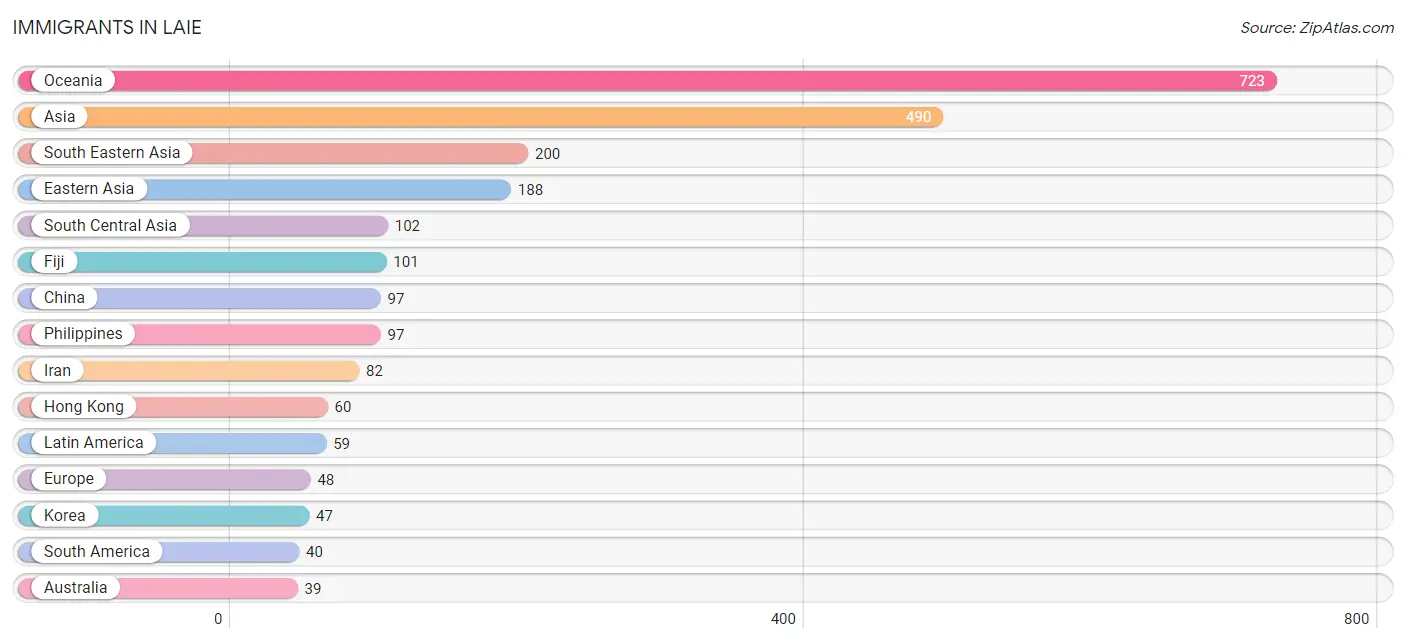
Immigrants in Laie
The most numerous immigrant groups reported in Laie came from Oceania (723 | 13.4%), Asia (490 | 9.1%), South Eastern Asia (200 | 3.7%), Eastern Asia (188 | 3.5%), and South Central Asia (102 | 1.9%), together accounting for 31.5% of all Laie residents.
| Immigration Origin | # Population | % Population |
| Afghanistan | 2 | 0.0% |
| Africa | 14 | 0.3% |
| Asia | 490 | 9.1% |
| Australia | 39 | 0.7% |
| Brazil | 20 | 0.4% |
| Canada | 19 | 0.4% |
| Central America | 19 | 0.4% |
| Chile | 20 | 0.4% |
| China | 97 | 1.8% |
| Eastern Asia | 188 | 3.5% |
| Eastern Europe | 1 | 0.0% |
| England | 26 | 0.5% |
| Europe | 48 | 0.9% |
| Fiji | 101 | 1.9% |
| Germany | 18 | 0.3% |
| Guatemala | 4 | 0.1% |
| Hong Kong | 60 | 1.1% |
| India | 16 | 0.3% |
| Indonesia | 37 | 0.7% |
| Iran | 82 | 1.5% |
| Japan | 37 | 0.7% |
| Korea | 47 | 0.9% |
| Latin America | 59 | 1.1% |
| Malaysia | 30 | 0.5% |
| Mexico | 15 | 0.3% |
| Northern Europe | 26 | 0.5% |
| Oceania | 723 | 13.4% |
| Pakistan | 2 | 0.0% |
| Philippines | 97 | 1.8% |
| Singapore | 4 | 0.1% |
| South Africa | 14 | 0.3% |
| South America | 40 | 0.7% |
| South Central Asia | 102 | 1.9% |
| South Eastern Asia | 200 | 3.7% |
| Switzerland | 3 | 0.1% |
| Taiwan | 20 | 0.4% |
| Thailand | 9 | 0.2% |
| Ukraine | 1 | 0.0% |
| Vietnam | 18 | 0.3% |
| Western Europe | 21 | 0.4% | View All 40 Rows |
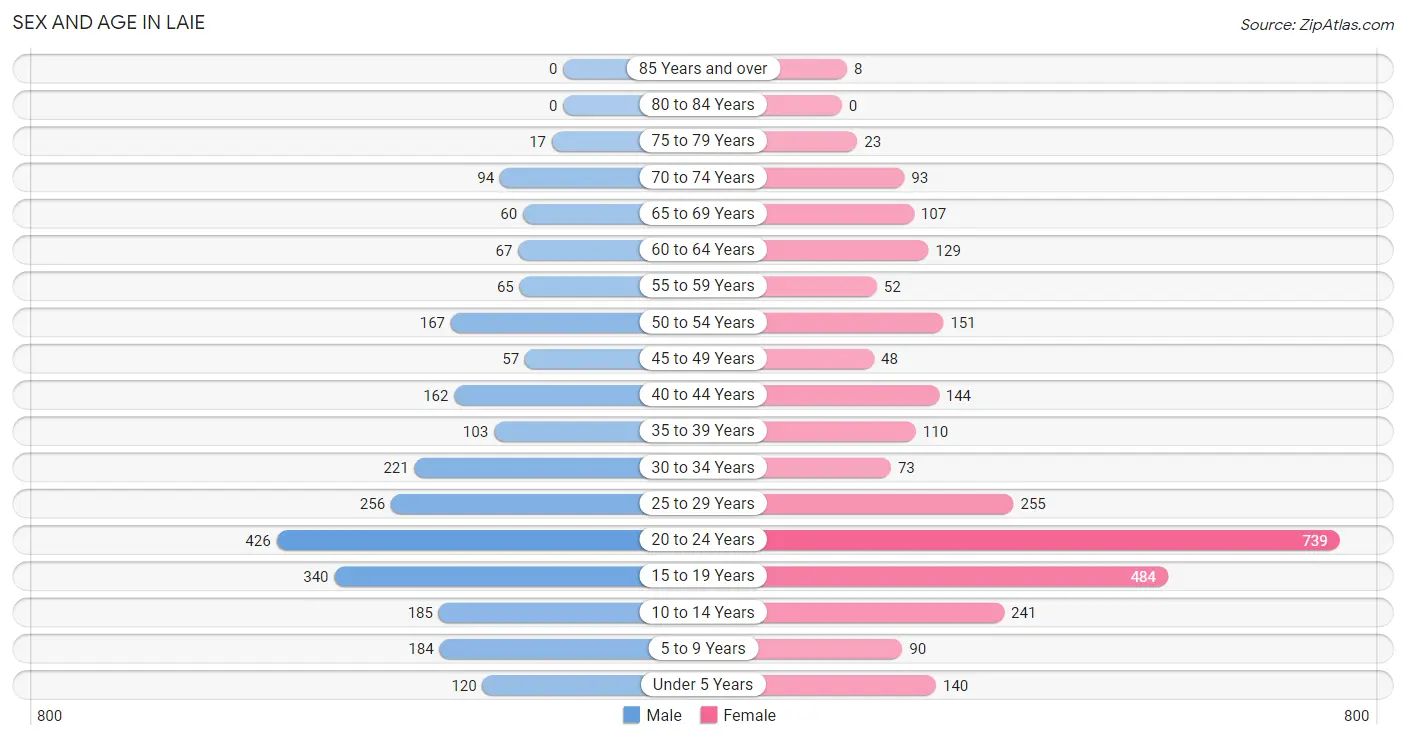
Sex and Age in Laie
Sex and Age in Laie
The most populous age groups in Laie are 20 to 24 Years (426 | 16.9%) for men and 20 to 24 Years (739 | 25.6%) for women.
| Age Bracket | Male | Female |
| Under 5 Years | 120 (4.8%) | 140 (4.9%) |
| 5 to 9 Years | 184 (7.3%) | 90 (3.1%) |
| 10 to 14 Years | 185 (7.3%) | 241 (8.4%) |
| 15 to 19 Years | 340 (13.5%) | 484 (16.8%) |
| 20 to 24 Years | 426 (16.9%) | 739 (25.6%) |
| 25 to 29 Years | 256 (10.1%) | 255 (8.8%) |
| 30 to 34 Years | 221 (8.8%) | 73 (2.5%) |
| 35 to 39 Years | 103 (4.1%) | 110 (3.8%) |
| 40 to 44 Years | 162 (6.4%) | 144 (5.0%) |
| 45 to 49 Years | 57 (2.3%) | 48 (1.7%) |
| 50 to 54 Years | 167 (6.6%) | 151 (5.2%) |
| 55 to 59 Years | 65 (2.6%) | 52 (1.8%) |
| 60 to 64 Years | 67 (2.6%) | 129 (4.5%) |
| 65 to 69 Years | 60 (2.4%) | 107 (3.7%) |
| 70 to 74 Years | 94 (3.7%) | 93 (3.2%) |
| 75 to 79 Years | 17 (0.7%) | 23 (0.8%) |
| 80 to 84 Years | 0 (0.0%) | 0 (0.0%) |
| 85 Years and over | 0 (0.0%) | 8 (0.3%) |
| Total | 2,524 (100.0%) | 2,887 (100.0%) |
Families and Households in Laie
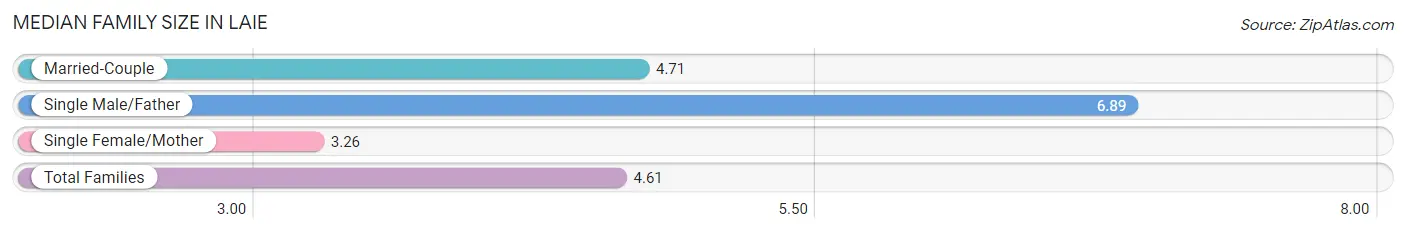
Median Family Size in Laie
The median family size in Laie is 4.61 persons per family, with single male/father families (18 | 2.3%) accounting for the largest median family size of 6.89 persons per family. On the other hand, single female/mother families (77 | 10.0%) represent the smallest median family size with 3.26 persons per family.
| Family Type | # Families | Family Size |
| Married-Couple | 676 (87.7%) | 4.71 |
| Single Male/Father | 18 (2.3%) | 6.89 |
| Single Female/Mother | 77 (10.0%) | 3.26 |
| Total Families | 771 (100.0%) | 4.61 |
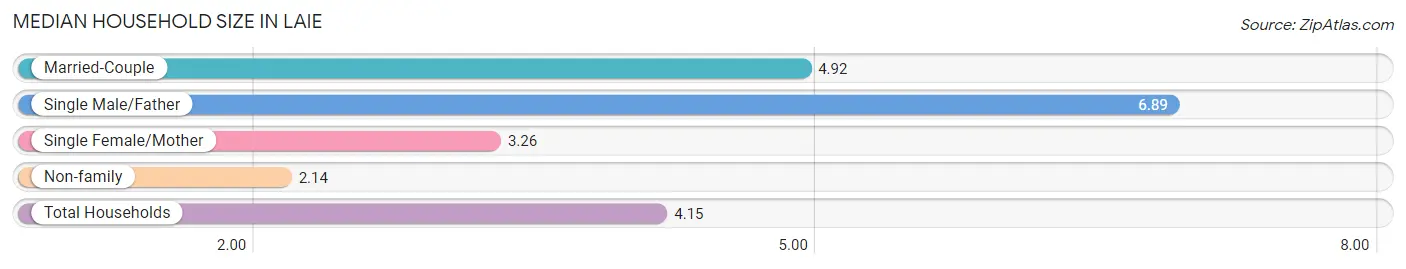
Median Household Size in Laie
The median household size in Laie is 4.15 persons per household, with single male/father households (18 | 1.8%) accounting for the largest median household size of 6.89 persons per household. non-family households (246 | 24.2%) represent the smallest median household size with 2.14 persons per household.
| Household Type | # Households | Household Size |
| Married-Couple | 676 (66.5%) | 4.92 |
| Single Male/Father | 18 (1.8%) | 6.89 |
| Single Female/Mother | 77 (7.6%) | 3.26 |
| Non-family | 246 (24.2%) | 2.14 |
| Total Households | 1,017 (100.0%) | 4.15 |
Household Size by Marriage Status in Laie
Out of a total of 1,017 households in Laie, 771 (75.8%) are family households, while 246 (24.2%) are nonfamily households. The most numerous type of family households are 7+ person households, comprising 145, and the most common type of nonfamily households are 1-person households, comprising 99.
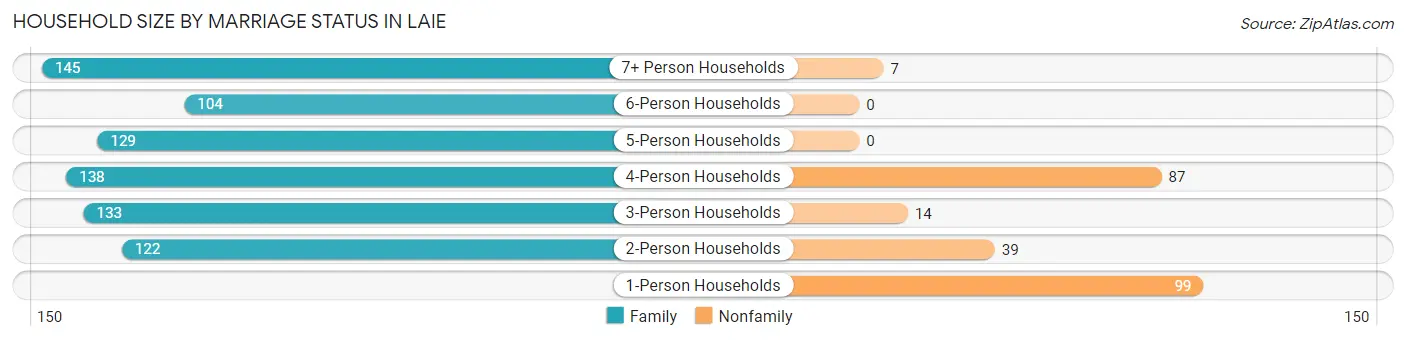
| Household Size | Family Households | Nonfamily Households |
| 1-Person Households | - | 99 (9.7%) |
| 2-Person Households | 122 (12.0%) | 39 (3.8%) |
| 3-Person Households | 133 (13.1%) | 14 (1.4%) |
| 4-Person Households | 138 (13.6%) | 87 (8.6%) |
| 5-Person Households | 129 (12.7%) | 0 (0.0%) |
| 6-Person Households | 104 (10.2%) | 0 (0.0%) |
| 7+ Person Households | 145 (14.3%) | 7 (0.7%) |
| Total | 771 (75.8%) | 246 (24.2%) |
Female Fertility in Laie
Fertility by Age in Laie
Average fertility rate in Laie is 23.0 births per 1,000 women. Women in the age bracket of 35 to 50 years have the highest fertility rate with 90.0 births per 1,000 women. Women in the age bracket of 35 to 50 years acount for 77.3% of all women with births.
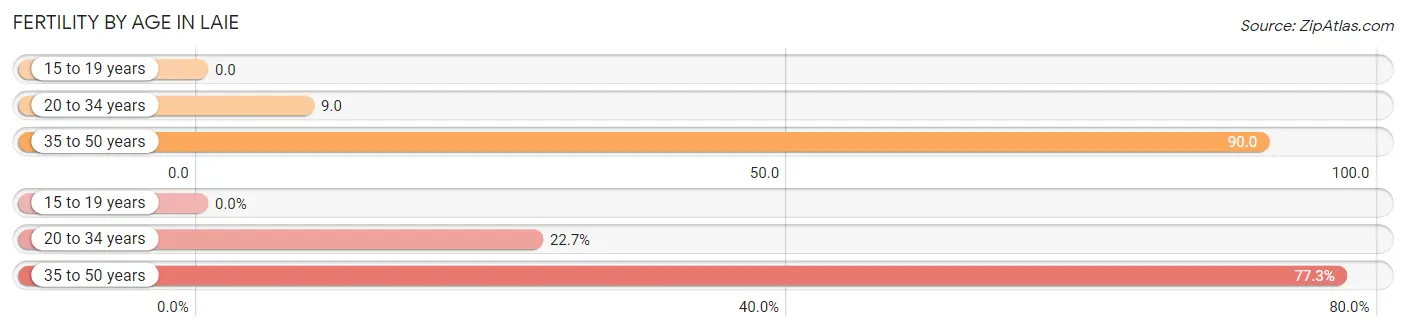
| Age Bracket | Women with Births | Births / 1,000 Women |
| 15 to 19 years | 0 (0.0%) | 0.0 |
| 20 to 34 years | 10 (22.7%) | 9.0 |
| 35 to 50 years | 34 (77.3%) | 90.0 |
| Total | 44 (100.0%) | 23.0 |
Fertility by Age by Marriage Status in Laie
68.2% of women with births (44) in Laie are married. The highest percentage of unmarried women with births falls into 35 to 50 years age bracket with 41.2% of them unmarried at the time of birth, while the lowest percentage of unmarried women with births belong to 20 to 34 years age bracket with 0.0% of them unmarried.
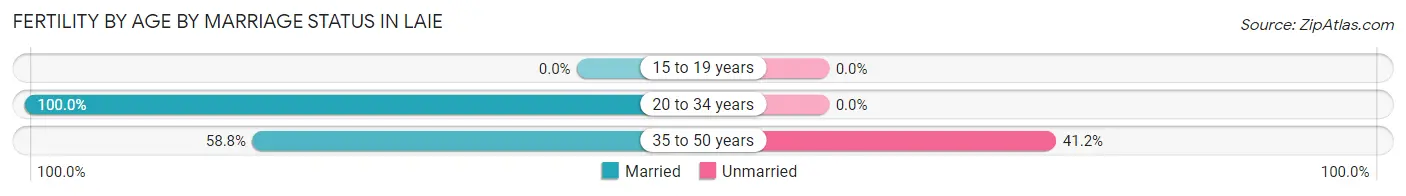
| Age Bracket | Married | Unmarried |
| 15 to 19 years | 0 (0.0%) | 0 (0.0%) |
| 20 to 34 years | 10 (100.0%) | 0 (0.0%) |
| 35 to 50 years | 20 (58.8%) | 14 (41.2%) |
| Total | 30 (68.2%) | 14 (31.8%) |
Fertility by Education in Laie
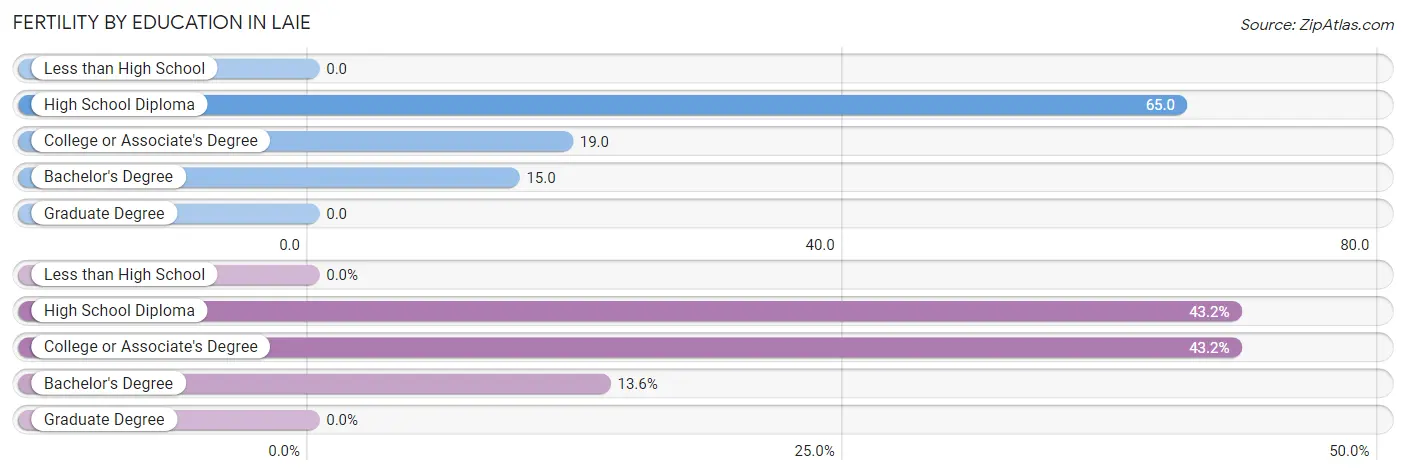
| Educational Attainment | Women with Births | Births / 1,000 Women |
| Less than High School | 0 (0.0%) | 0.0 |
| High School Diploma | 19 (43.2%) | 65.0 |
| College or Associate's Degree | 19 (43.2%) | 19.0 |
| Bachelor's Degree | 6 (13.6%) | 15.0 |
| Graduate Degree | 0 (0.0%) | 0.0 |
| Total | 44 (100.0%) | 23.0 |
Fertility by Education by Marriage Status in Laie
31.8% of women with births in Laie are unmarried. Women with the educational attainment of high school diploma are most likely to be married with 100.0% of them married at childbirth, while women with the educational attainment of college or associate's degree are least likely to be married with 73.7% of them unmarried at childbirth.
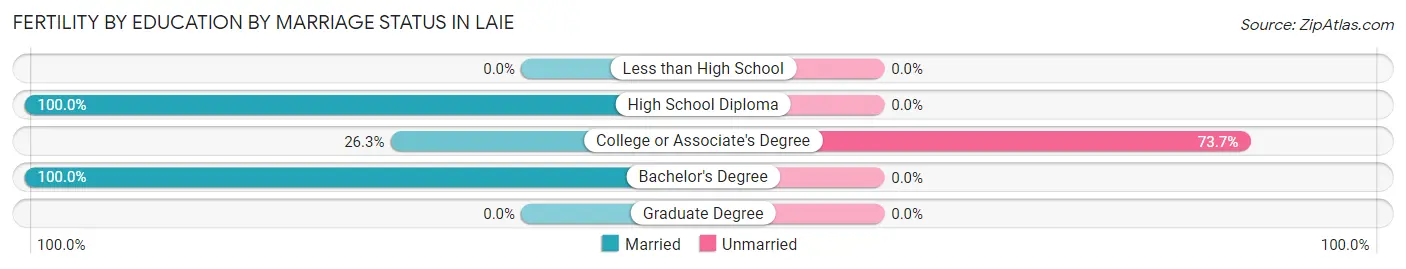
| Educational Attainment | Married | Unmarried |
| Less than High School | 0 (0.0%) | 0 (0.0%) |
| High School Diploma | 19 (100.0%) | 0 (0.0%) |
| College or Associate's Degree | 5 (26.3%) | 14 (73.7%) |
| Bachelor's Degree | 6 (100.0%) | 0 (0.0%) |
| Graduate Degree | 0 (0.0%) | 0 (0.0%) |
| Total | 30 (68.2%) | 14 (31.8%) |
Employment Characteristics in Laie
Employment by Class of Employer in Laie
Among the 2,675 employed individuals in Laie, private company employees (1,273 | 47.6%), not-for-profit organizations (737 | 27.6%), and state government employees (398 | 14.9%) make up the most common classes of employment.
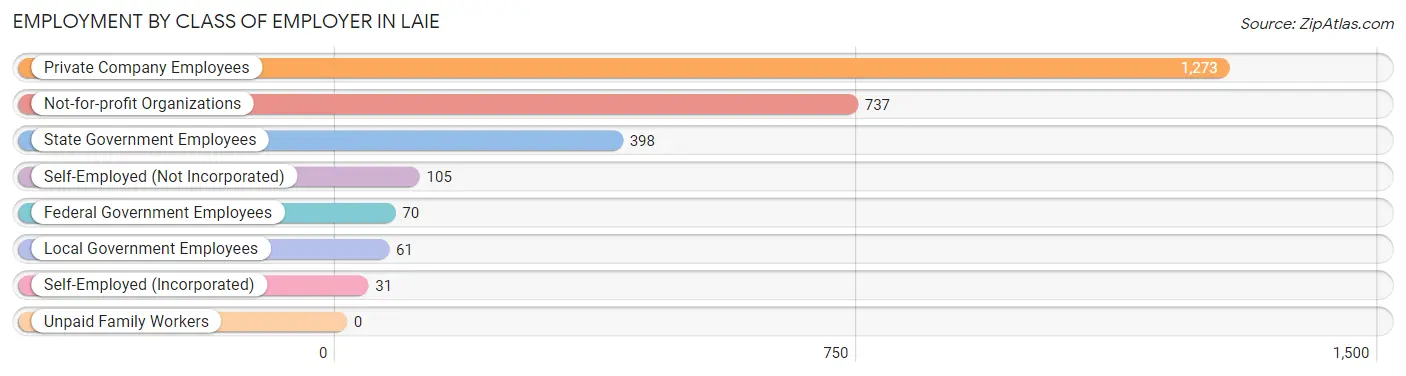
| Employer Class | # Employees | % Employees |
| Private Company Employees | 1,273 | 47.6% |
| Self-Employed (Incorporated) | 31 | 1.2% |
| Self-Employed (Not Incorporated) | 105 | 3.9% |
| Not-for-profit Organizations | 737 | 27.6% |
| Local Government Employees | 61 | 2.3% |
| State Government Employees | 398 | 14.9% |
| Federal Government Employees | 70 | 2.6% |
| Unpaid Family Workers | 0 | 0.0% |
| Total | 2,675 | 100.0% |
Employment Status by Age in Laie
According to the labor force statistics for Laie, out of the total population over 16 years of age (4,377), 68.8% or 3,011 individuals are in the labor force, with 9.0% or 271 of them unemployed. The age group with the highest labor force participation rate is 45 to 54 years, with 91.5% or 387 individuals in the labor force. Within the labor force, the 20 to 24 years age range has the highest percentage of unemployed individuals, with 17.3% or 151 of them being unemployed.
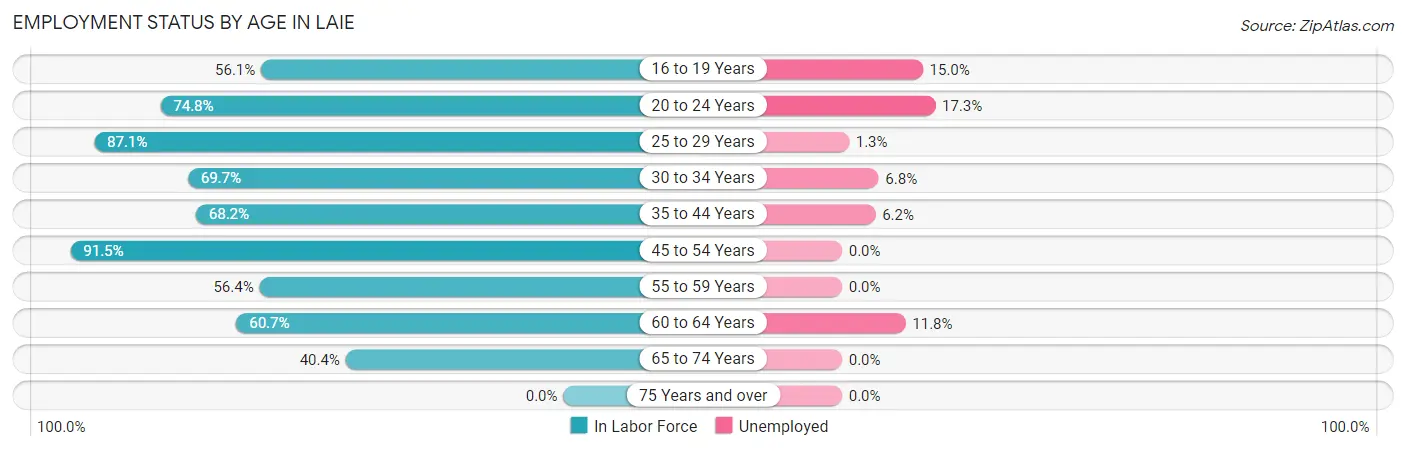
| Age Bracket | In Labor Force | Unemployed |
| 16 to 19 Years | 421 (56.1%) | 63 (15.0%) |
| 20 to 24 Years | 871 (74.8%) | 151 (17.3%) |
| 25 to 29 Years | 445 (87.1%) | 6 (1.3%) |
| 30 to 34 Years | 205 (69.7%) | 14 (6.8%) |
| 35 to 44 Years | 354 (68.2%) | 22 (6.2%) |
| 45 to 54 Years | 387 (91.5%) | 0 (0.0%) |
| 55 to 59 Years | 66 (56.4%) | 0 (0.0%) |
| 60 to 64 Years | 119 (60.7%) | 14 (11.8%) |
| 65 to 74 Years | 143 (40.4%) | 0 (0.0%) |
| 75 Years and over | 0 (0.0%) | 0 (0.0%) |
| Total | 3,011 (68.8%) | 271 (9.0%) |
Employment Status by Educational Attainment in Laie
According to labor force statistics for Laie, 76.5% of individuals (1,576) out of the total population between 25 and 64 years of age (2,060) are in the labor force, with 3.6% or 57 of them being unemployed. The group with the highest labor force participation rate are those with the educational attainment of bachelor's degree or higher, with 84.6% or 691 individuals in the labor force. Within the labor force, individuals with high school diploma education have the highest percentage of unemployment, with 6.0% or 16 of them being unemployed.
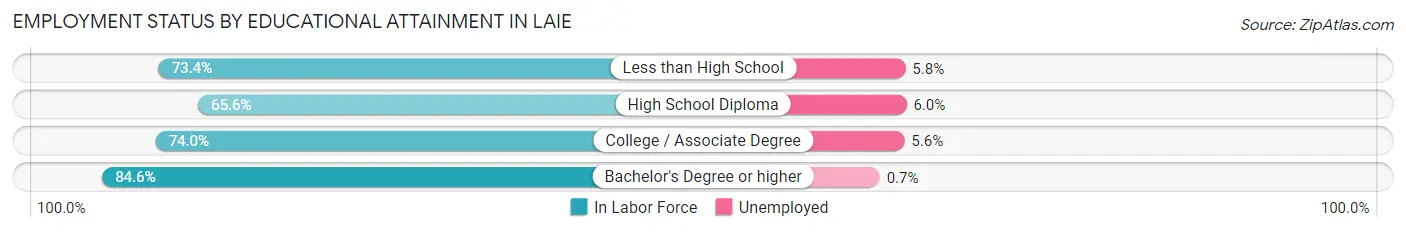
| Educational Attainment | In Labor Force | Unemployed |
| Less than High School | 69 (73.4%) | 5 (5.8%) |
| High School Diploma | 267 (65.6%) | 24 (6.0%) |
| College / Associate Degree | 549 (74.0%) | 42 (5.6%) |
| Bachelor's Degree or higher | 691 (84.6%) | 6 (0.7%) |
| Total | 1,576 (76.5%) | 74 (3.6%) |
Employment Occupations by Sex in Laie
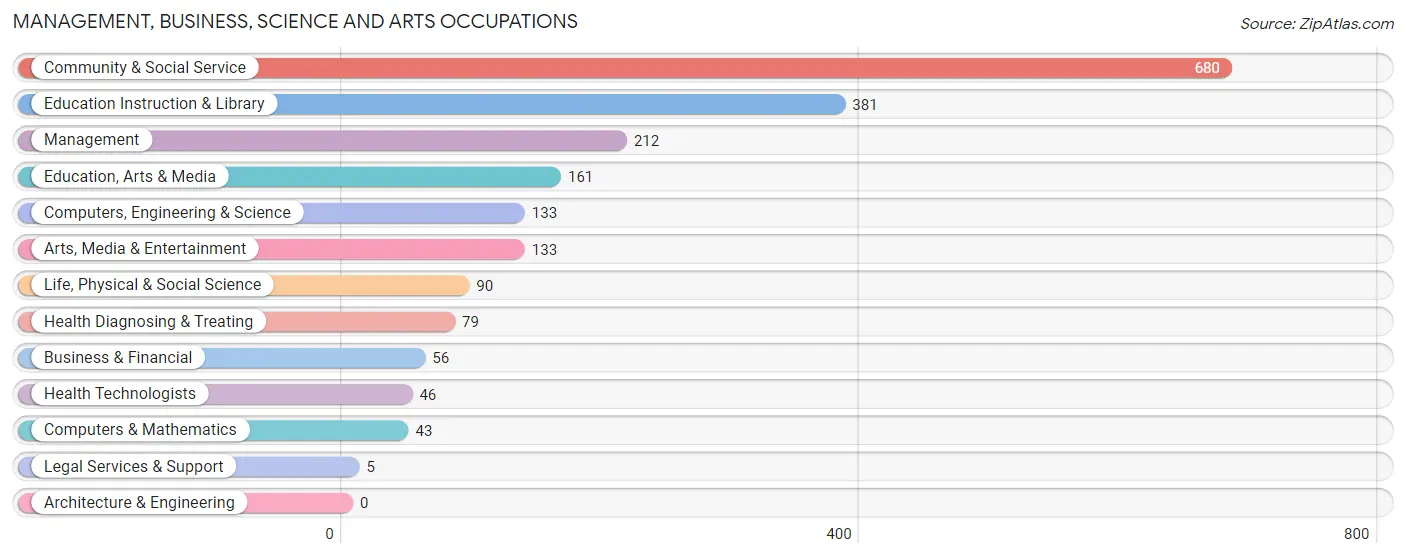
Management, Business, Science and Arts Occupations
The most common Management, Business, Science and Arts occupations in Laie are Community & Social Service (680 | 24.8%), Education Instruction & Library (381 | 13.9%), Management (212 | 7.7%), Education, Arts & Media (161 | 5.9%), and Computers, Engineering & Science (133 | 4.9%).
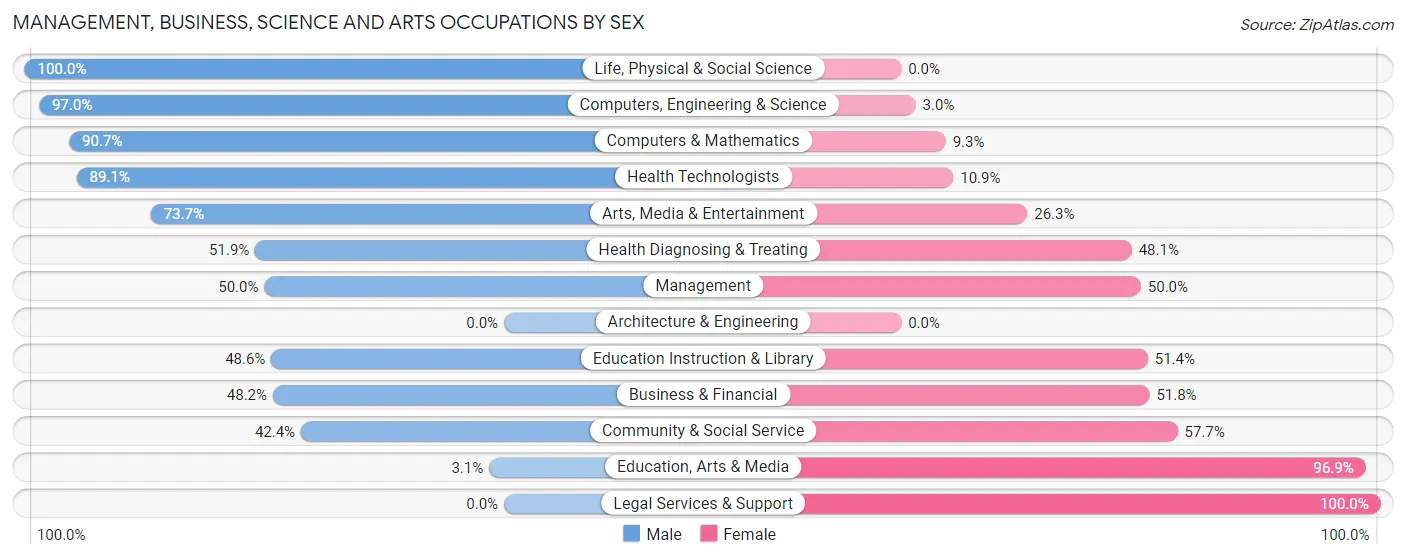
Management, Business, Science and Arts Occupations by Sex
Within the Management, Business, Science and Arts occupations in Laie, the most male-oriented occupations are Life, Physical & Social Science (100.0%), Computers, Engineering & Science (97.0%), and Computers & Mathematics (90.7%), while the most female-oriented occupations are Legal Services & Support (100.0%), Education, Arts & Media (96.9%), and Community & Social Service (57.7%).
| Occupation | Male | Female |
| Management | 106 (50.0%) | 106 (50.0%) |
| Business & Financial | 27 (48.2%) | 29 (51.8%) |
| Computers, Engineering & Science | 129 (97.0%) | 4 (3.0%) |
| Computers & Mathematics | 39 (90.7%) | 4 (9.3%) |
| Architecture & Engineering | 0 (0.0%) | 0 (0.0%) |
| Life, Physical & Social Science | 90 (100.0%) | 0 (0.0%) |
| Community & Social Service | 288 (42.3%) | 392 (57.7%) |
| Education, Arts & Media | 5 (3.1%) | 156 (96.9%) |
| Legal Services & Support | 0 (0.0%) | 5 (100.0%) |
| Education Instruction & Library | 185 (48.6%) | 196 (51.4%) |
| Arts, Media & Entertainment | 98 (73.7%) | 35 (26.3%) |
| Health Diagnosing & Treating | 41 (51.9%) | 38 (48.1%) |
| Health Technologists | 41 (89.1%) | 5 (10.9%) |
| Total (Category) | 591 (50.9%) | 569 (49.0%) |
| Total (Overall) | 1,297 (47.4%) | 1,439 (52.6%) |
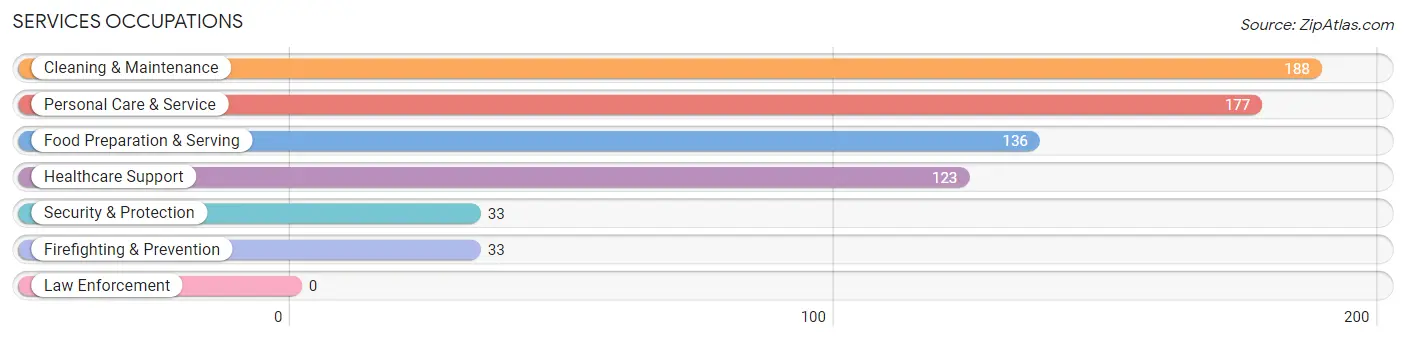
Services Occupations
The most common Services occupations in Laie are Cleaning & Maintenance (188 | 6.9%), Personal Care & Service (177 | 6.5%), Food Preparation & Serving (136 | 5.0%), Healthcare Support (123 | 4.5%), and Security & Protection (33 | 1.2%).
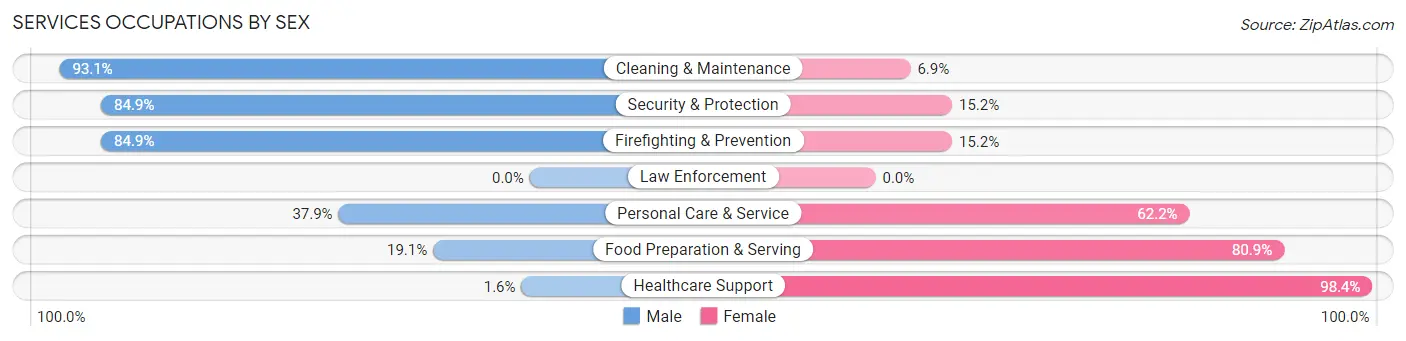
Services Occupations by Sex
Within the Services occupations in Laie, the most male-oriented occupations are Cleaning & Maintenance (93.1%), Security & Protection (84.9%), and Firefighting & Prevention (84.9%), while the most female-oriented occupations are Healthcare Support (98.4%), Food Preparation & Serving (80.9%), and Personal Care & Service (62.2%).
| Occupation | Male | Female |
| Healthcare Support | 2 (1.6%) | 121 (98.4%) |
| Security & Protection | 28 (84.9%) | 5 (15.1%) |
| Firefighting & Prevention | 28 (84.9%) | 5 (15.1%) |
| Law Enforcement | 0 (0.0%) | 0 (0.0%) |
| Food Preparation & Serving | 26 (19.1%) | 110 (80.9%) |
| Cleaning & Maintenance | 175 (93.1%) | 13 (6.9%) |
| Personal Care & Service | 67 (37.9%) | 110 (62.2%) |
| Total (Category) | 298 (45.4%) | 359 (54.6%) |
| Total (Overall) | 1,297 (47.4%) | 1,439 (52.6%) |
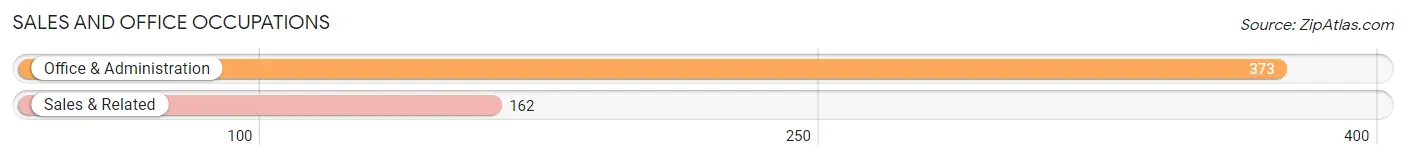
Sales and Office Occupations
The most common Sales and Office occupations in Laie are Office & Administration (373 | 13.6%), and Sales & Related (162 | 5.9%).
Sales and Office Occupations by Sex
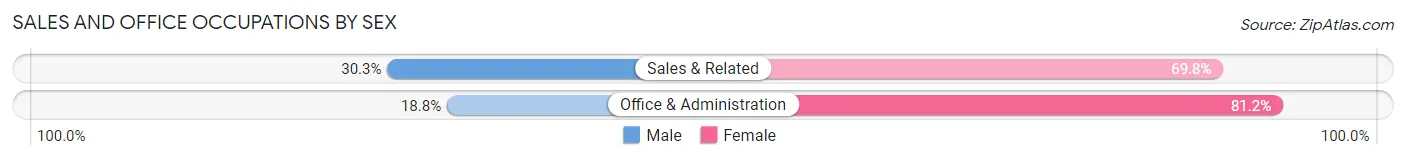
| Occupation | Male | Female |
| Sales & Related | 49 (30.2%) | 113 (69.8%) |
| Office & Administration | 70 (18.8%) | 303 (81.2%) |
| Total (Category) | 119 (22.2%) | 416 (77.8%) |
| Total (Overall) | 1,297 (47.4%) | 1,439 (52.6%) |
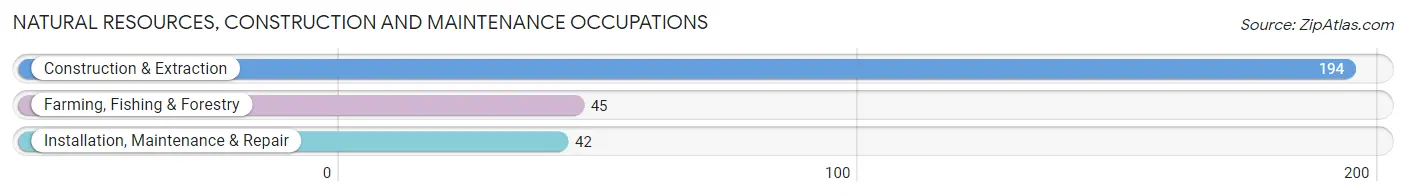
Natural Resources, Construction and Maintenance Occupations
The most common Natural Resources, Construction and Maintenance occupations in Laie are Construction & Extraction (194 | 7.1%), Farming, Fishing & Forestry (45 | 1.6%), and Installation, Maintenance & Repair (42 | 1.5%).
Natural Resources, Construction and Maintenance Occupations by Sex
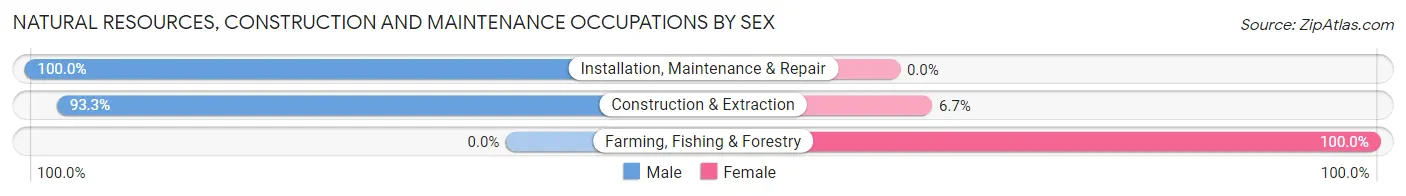
| Occupation | Male | Female |
| Farming, Fishing & Forestry | 0 (0.0%) | 45 (100.0%) |
| Construction & Extraction | 181 (93.3%) | 13 (6.7%) |
| Installation, Maintenance & Repair | 42 (100.0%) | 0 (0.0%) |
| Total (Category) | 223 (79.4%) | 58 (20.6%) |
| Total (Overall) | 1,297 (47.4%) | 1,439 (52.6%) |
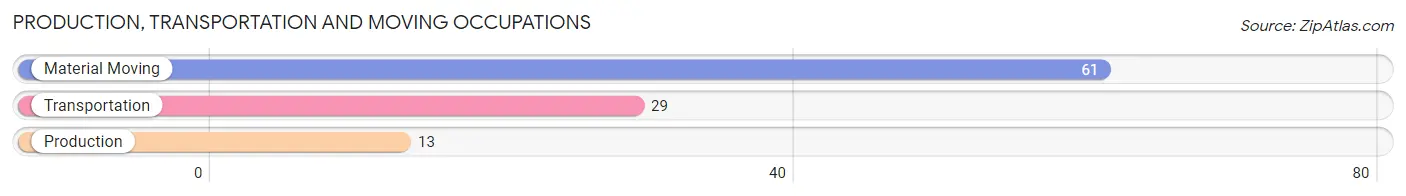
Production, Transportation and Moving Occupations
The most common Production, Transportation and Moving occupations in Laie are Material Moving (61 | 2.2%), Transportation (29 | 1.1%), and Production (13 | 0.5%).
Production, Transportation and Moving Occupations by Sex
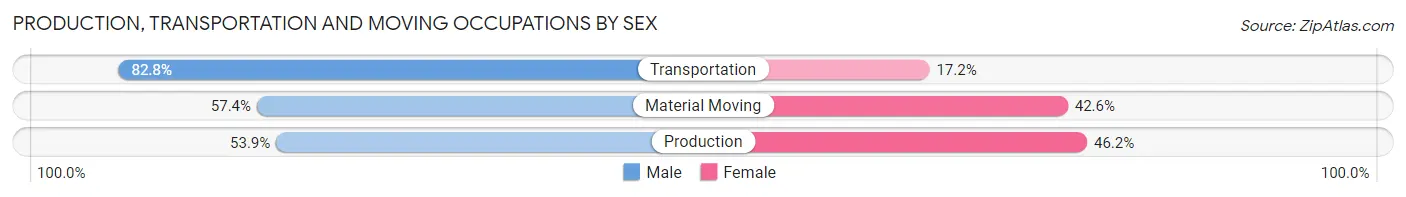
| Occupation | Male | Female |
| Production | 7 (53.8%) | 6 (46.2%) |
| Transportation | 24 (82.8%) | 5 (17.2%) |
| Material Moving | 35 (57.4%) | 26 (42.6%) |
| Total (Category) | 66 (64.1%) | 37 (35.9%) |
| Total (Overall) | 1,297 (47.4%) | 1,439 (52.6%) |
Employment Industries by Sex in Laie
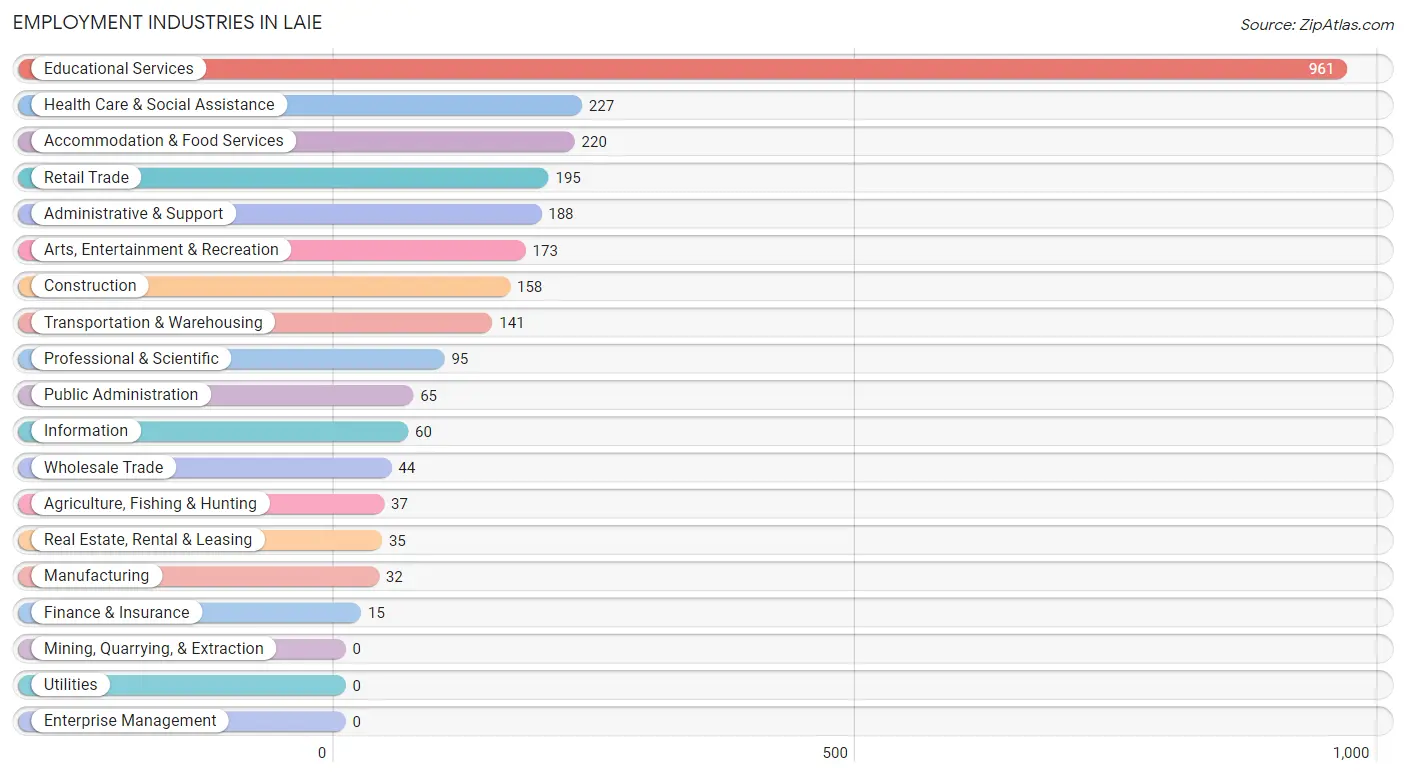
Employment Industries in Laie
The major employment industries in Laie include Educational Services (961 | 35.1%), Health Care & Social Assistance (227 | 8.3%), Accommodation & Food Services (220 | 8.0%), Retail Trade (195 | 7.1%), and Administrative & Support (188 | 6.9%).
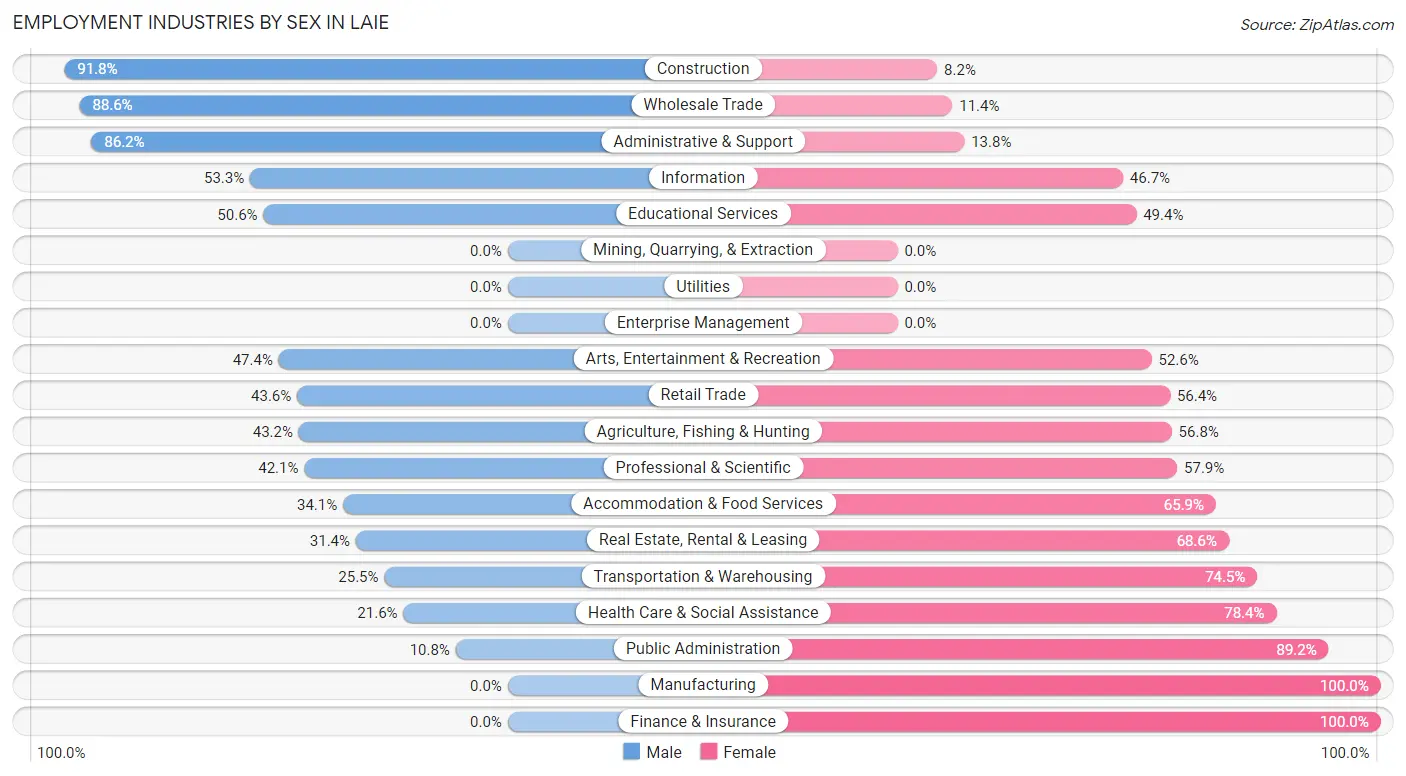
Employment Industries by Sex in Laie
The Laie industries that see more men than women are Construction (91.8%), Wholesale Trade (88.6%), and Administrative & Support (86.2%), whereas the industries that tend to have a higher number of women are Manufacturing (100.0%), Finance & Insurance (100.0%), and Public Administration (89.2%).
| Industry | Male | Female |
| Agriculture, Fishing & Hunting | 16 (43.2%) | 21 (56.8%) |
| Mining, Quarrying, & Extraction | 0 (0.0%) | 0 (0.0%) |
| Construction | 145 (91.8%) | 13 (8.2%) |
| Manufacturing | 0 (0.0%) | 32 (100.0%) |
| Wholesale Trade | 39 (88.6%) | 5 (11.4%) |
| Retail Trade | 85 (43.6%) | 110 (56.4%) |
| Transportation & Warehousing | 36 (25.5%) | 105 (74.5%) |
| Utilities | 0 (0.0%) | 0 (0.0%) |
| Information | 32 (53.3%) | 28 (46.7%) |
| Finance & Insurance | 0 (0.0%) | 15 (100.0%) |
| Real Estate, Rental & Leasing | 11 (31.4%) | 24 (68.6%) |
| Professional & Scientific | 40 (42.1%) | 55 (57.9%) |
| Enterprise Management | 0 (0.0%) | 0 (0.0%) |
| Administrative & Support | 162 (86.2%) | 26 (13.8%) |
| Educational Services | 486 (50.6%) | 475 (49.4%) |
| Health Care & Social Assistance | 49 (21.6%) | 178 (78.4%) |
| Arts, Entertainment & Recreation | 82 (47.4%) | 91 (52.6%) |
| Accommodation & Food Services | 75 (34.1%) | 145 (65.9%) |
| Public Administration | 7 (10.8%) | 58 (89.2%) |
| Total | 1,297 (47.4%) | 1,439 (52.6%) |
Education in Laie
School Enrollment in Laie
The most common levels of schooling among the 2,805 students in Laie are college / undergraduate (1,697 | 60.5%), high school (351 | 12.5%), and middle school (328 | 11.7%).
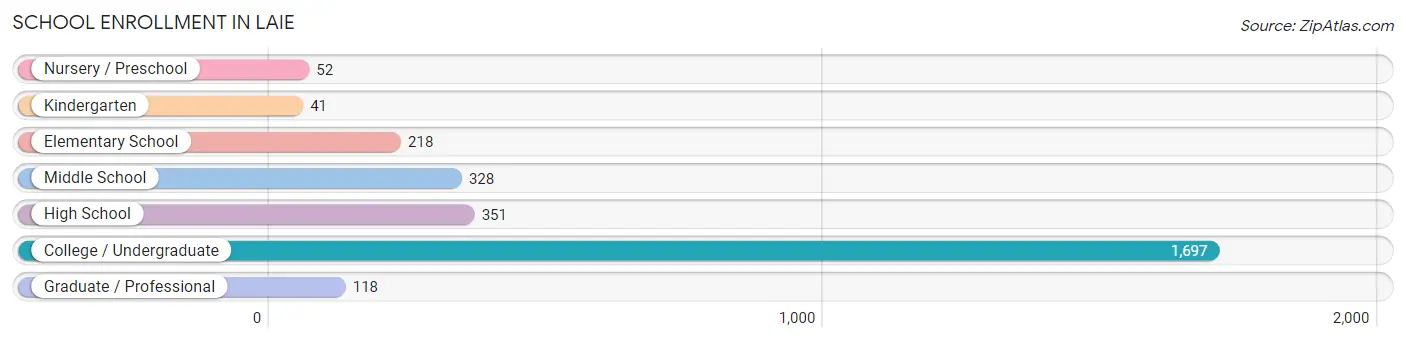
| School Level | # Students | % Students |
| Nursery / Preschool | 52 | 1.8% |
| Kindergarten | 41 | 1.5% |
| Elementary School | 218 | 7.8% |
| Middle School | 328 | 11.7% |
| High School | 351 | 12.5% |
| College / Undergraduate | 1,697 | 60.5% |
| Graduate / Professional | 118 | 4.2% |
| Total | 2,805 | 100.0% |
School Enrollment by Age by Funding Source in Laie
Out of a total of 2,805 students who are enrolled in schools in Laie, 1,408 (50.2%) attend a private institution, while the remaining 1,397 (49.8%) are enrolled in public schools. The age group of 20 to 24 year olds has the highest likelihood of being enrolled in private schools, with 727 (77.6% in the age bracket) enrolled. Conversely, the age group of 5 to 9 year old has the lowest likelihood of being enrolled in a private school, with 258 (100.0% in the age bracket) attending a public institution.
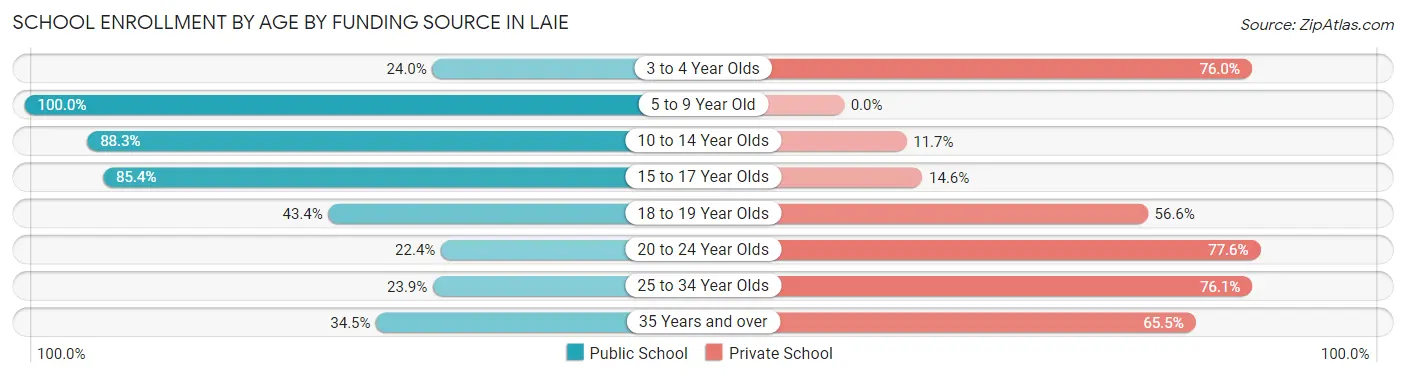
| Age Bracket | Public School | Private School |
| 3 to 4 Year Olds | 6 (24.0%) | 19 (76.0%) |
| 5 to 9 Year Old | 258 (100.0%) | 0 (0.0%) |
| 10 to 14 Year Olds | 371 (88.3%) | 49 (11.7%) |
| 15 to 17 Year Olds | 228 (85.4%) | 39 (14.6%) |
| 18 to 19 Year Olds | 223 (43.4%) | 291 (56.6%) |
| 20 to 24 Year Olds | 210 (22.4%) | 727 (77.6%) |
| 25 to 34 Year Olds | 71 (23.9%) | 226 (76.1%) |
| 35 Years and over | 30 (34.5%) | 57 (65.5%) |
| Total | 1,397 (49.8%) | 1,408 (50.2%) |
Educational Attainment by Field of Study in Laie
Arts & humanities (198 | 19.5%), business (154 | 15.2%), education (141 | 13.9%), social sciences (92 | 9.1%), and literature & languages (60 | 5.9%) are the most common fields of study among 1,015 individuals in Laie who have obtained a bachelor's degree or higher.
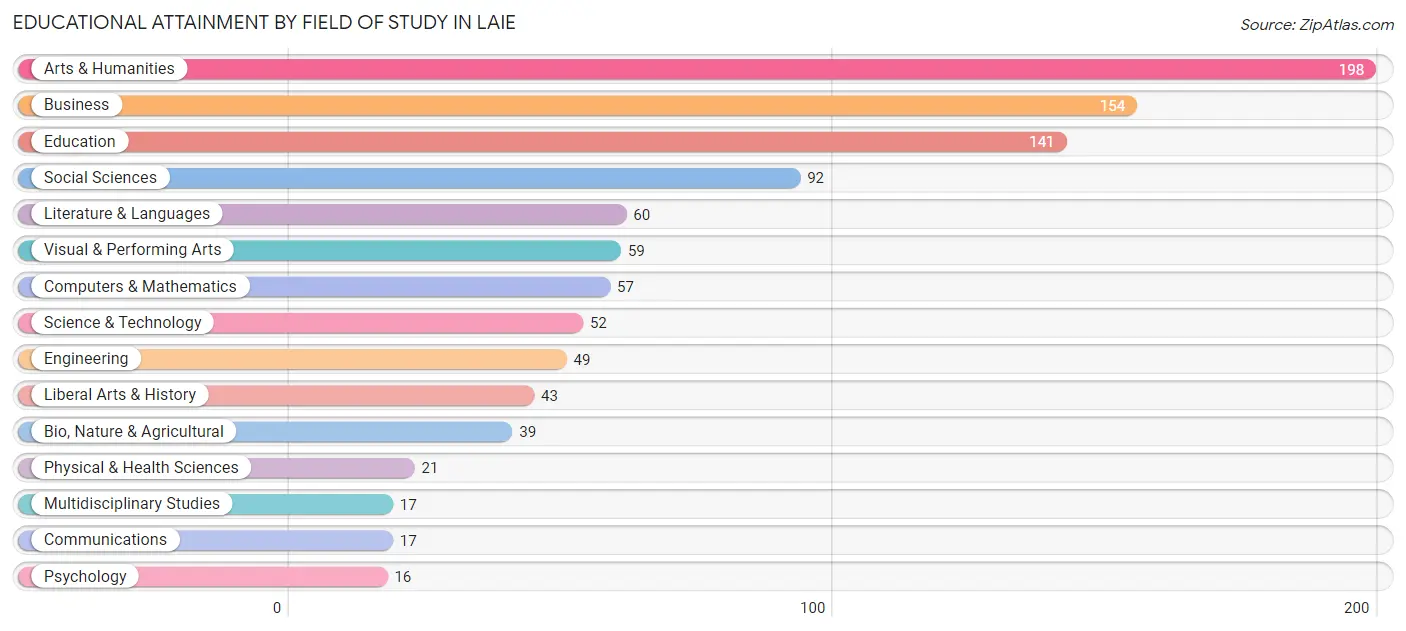
| Field of Study | # Graduates | % Graduates |
| Computers & Mathematics | 57 | 5.6% |
| Bio, Nature & Agricultural | 39 | 3.8% |
| Physical & Health Sciences | 21 | 2.1% |
| Psychology | 16 | 1.6% |
| Social Sciences | 92 | 9.1% |
| Engineering | 49 | 4.8% |
| Multidisciplinary Studies | 17 | 1.7% |
| Science & Technology | 52 | 5.1% |
| Business | 154 | 15.2% |
| Education | 141 | 13.9% |
| Literature & Languages | 60 | 5.9% |
| Liberal Arts & History | 43 | 4.2% |
| Visual & Performing Arts | 59 | 5.8% |
| Communications | 17 | 1.7% |
| Arts & Humanities | 198 | 19.5% |
| Total | 1,015 | 100.0% |
Transportation & Commute in Laie
Vehicle Availability by Sex in Laie
The most prevalent vehicle ownership categories in Laie are males with 2 vehicles (264, accounting for 28.5%) and females with 2 vehicles (204, making up 26.1%).
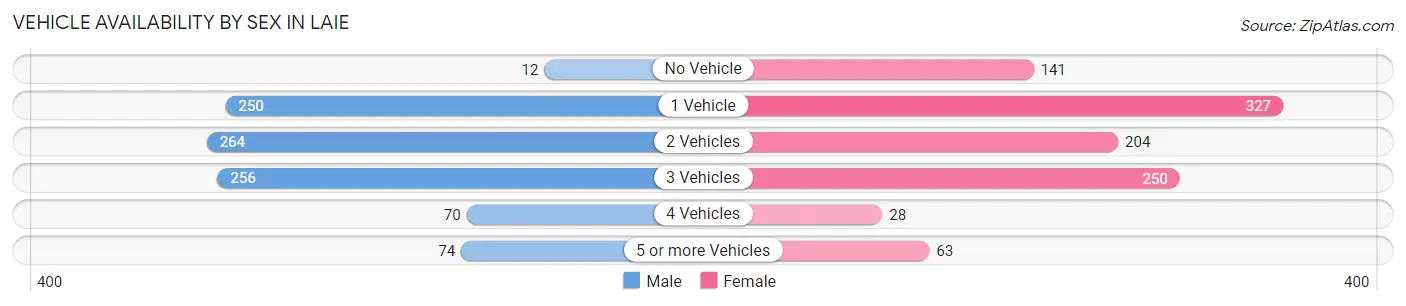
| Vehicles Available | Male | Female |
| No Vehicle | 12 (1.3%) | 141 (13.9%) |
| 1 Vehicle | 250 (27.0%) | 327 (32.3%) |
| 2 Vehicles | 264 (28.5%) | 204 (20.1%) |
| 3 Vehicles | 256 (27.7%) | 250 (24.7%) |
| 4 Vehicles | 70 (7.6%) | 28 (2.8%) |
| 5 or more Vehicles | 74 (8.0%) | 63 (6.2%) |
| Total | 926 (100.0%) | 1,013 (100.0%) |
Commute Time in Laie
The most frequently occuring commute durations in Laie are 10 to 14 minutes (594 commuters, 26.2%), 5 to 9 minutes (580 commuters, 25.6%), and 60 to 89 minutes (357 commuters, 15.7%).
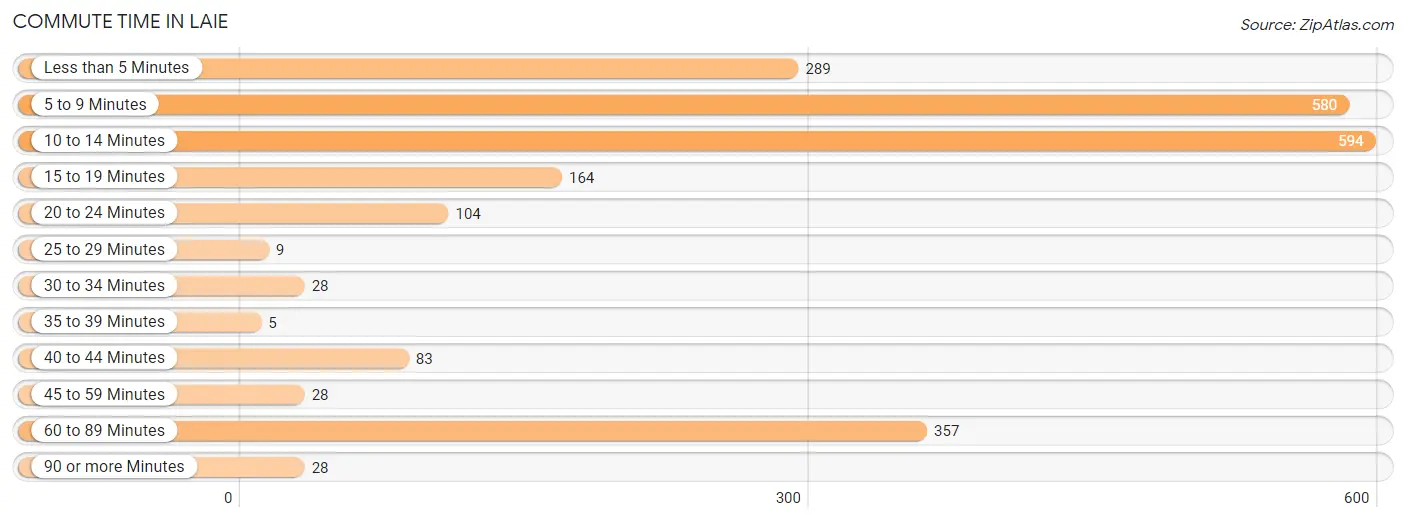
| Commute Time | # Commuters | % Commuters |
| Less than 5 Minutes | 289 | 12.7% |
| 5 to 9 Minutes | 580 | 25.6% |
| 10 to 14 Minutes | 594 | 26.2% |
| 15 to 19 Minutes | 164 | 7.2% |
| 20 to 24 Minutes | 104 | 4.6% |
| 25 to 29 Minutes | 9 | 0.4% |
| 30 to 34 Minutes | 28 | 1.2% |
| 35 to 39 Minutes | 5 | 0.2% |
| 40 to 44 Minutes | 83 | 3.7% |
| 45 to 59 Minutes | 28 | 1.2% |
| 60 to 89 Minutes | 357 | 15.7% |
| 90 or more Minutes | 28 | 1.2% |
Commute Time by Sex in Laie
The most common commute times in Laie are 5 to 9 minutes (267 commuters, 25.2%) for males and 10 to 14 minutes (408 commuters, 33.8%) for females.
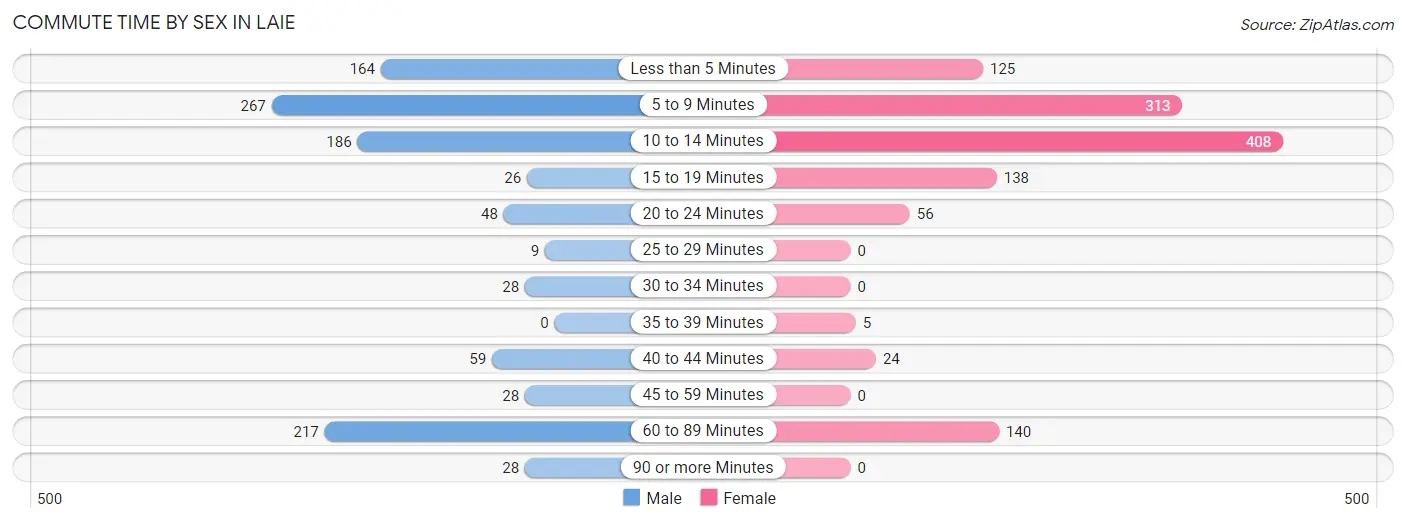
| Commute Time | Male | Female |
| Less than 5 Minutes | 164 (15.5%) | 125 (10.3%) |
| 5 to 9 Minutes | 267 (25.2%) | 313 (25.9%) |
| 10 to 14 Minutes | 186 (17.5%) | 408 (33.8%) |
| 15 to 19 Minutes | 26 (2.5%) | 138 (11.4%) |
| 20 to 24 Minutes | 48 (4.5%) | 56 (4.6%) |
| 25 to 29 Minutes | 9 (0.9%) | 0 (0.0%) |
| 30 to 34 Minutes | 28 (2.6%) | 0 (0.0%) |
| 35 to 39 Minutes | 0 (0.0%) | 5 (0.4%) |
| 40 to 44 Minutes | 59 (5.6%) | 24 (2.0%) |
| 45 to 59 Minutes | 28 (2.6%) | 0 (0.0%) |
| 60 to 89 Minutes | 217 (20.5%) | 140 (11.6%) |
| 90 or more Minutes | 28 (2.6%) | 0 (0.0%) |
Time of Departure to Work by Sex in Laie
The most frequent times of departure to work in Laie are 12:00 AM to 4:59 AM (173, 16.3%) for males and 7:00 AM to 7:29 AM (198, 16.4%) for females.
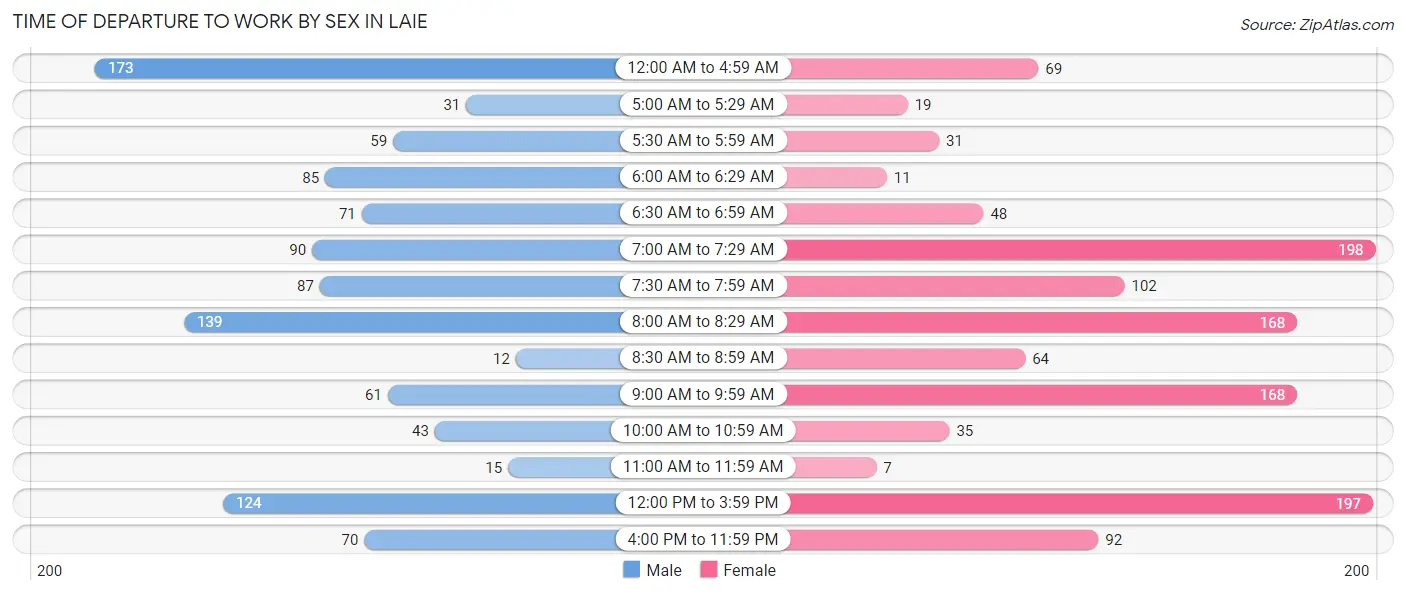
| Time of Departure | Male | Female |
| 12:00 AM to 4:59 AM | 173 (16.3%) | 69 (5.7%) |
| 5:00 AM to 5:29 AM | 31 (2.9%) | 19 (1.6%) |
| 5:30 AM to 5:59 AM | 59 (5.6%) | 31 (2.6%) |
| 6:00 AM to 6:29 AM | 85 (8.0%) | 11 (0.9%) |
| 6:30 AM to 6:59 AM | 71 (6.7%) | 48 (4.0%) |
| 7:00 AM to 7:29 AM | 90 (8.5%) | 198 (16.4%) |
| 7:30 AM to 7:59 AM | 87 (8.2%) | 102 (8.4%) |
| 8:00 AM to 8:29 AM | 139 (13.1%) | 168 (13.9%) |
| 8:30 AM to 8:59 AM | 12 (1.1%) | 64 (5.3%) |
| 9:00 AM to 9:59 AM | 61 (5.8%) | 168 (13.9%) |
| 10:00 AM to 10:59 AM | 43 (4.1%) | 35 (2.9%) |
| 11:00 AM to 11:59 AM | 15 (1.4%) | 7 (0.6%) |
| 12:00 PM to 3:59 PM | 124 (11.7%) | 197 (16.3%) |
| 4:00 PM to 11:59 PM | 70 (6.6%) | 92 (7.6%) |
| Total | 1,060 (100.0%) | 1,209 (100.0%) |
Housing Occupancy in Laie
Occupancy by Ownership in Laie
Of the total 1,017 dwellings in Laie, owner-occupied units account for 372 (36.6%), while renter-occupied units make up 645 (63.4%).
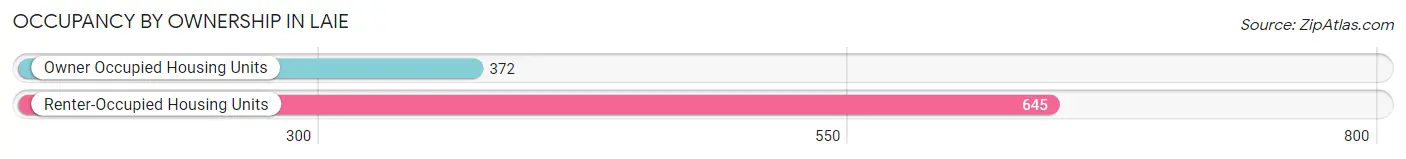
| Occupancy | # Housing Units | % Housing Units |
| Owner Occupied Housing Units | 372 | 36.6% |
| Renter-Occupied Housing Units | 645 | 63.4% |
| Total Occupied Housing Units | 1,017 | 100.0% |
Occupancy by Household Size in Laie
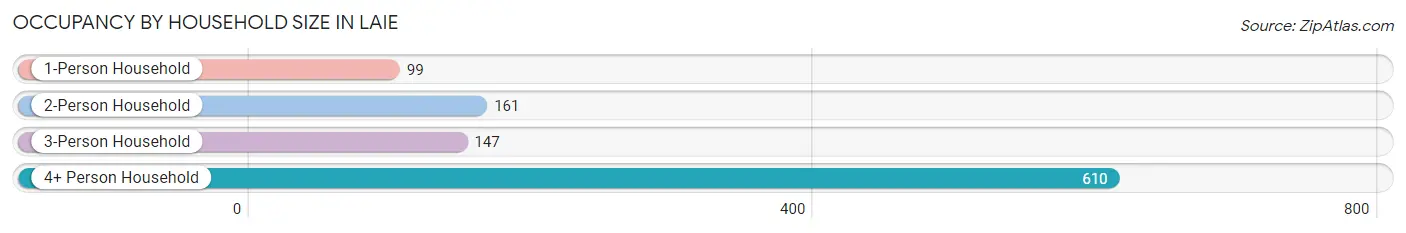
| Household Size | # Housing Units | % Housing Units |
| 1-Person Household | 99 | 9.7% |
| 2-Person Household | 161 | 15.8% |
| 3-Person Household | 147 | 14.4% |
| 4+ Person Household | 610 | 60.0% |
| Total Housing Units | 1,017 | 100.0% |
Occupancy by Ownership by Household Size in Laie
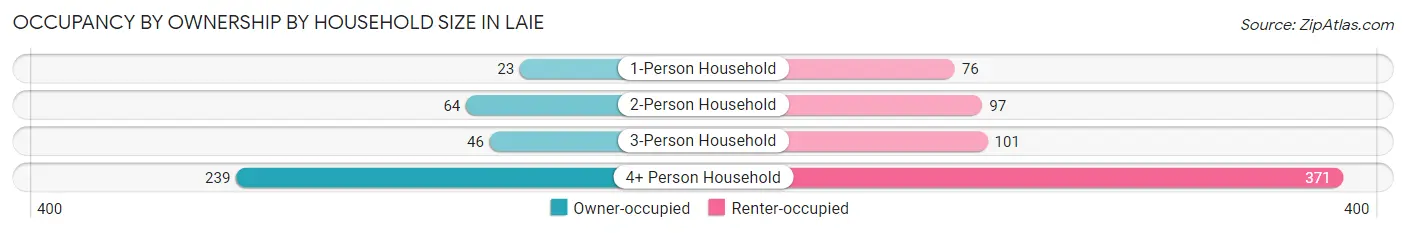
| Household Size | Owner-occupied | Renter-occupied |
| 1-Person Household | 23 (23.2%) | 76 (76.8%) |
| 2-Person Household | 64 (39.8%) | 97 (60.3%) |
| 3-Person Household | 46 (31.3%) | 101 (68.7%) |
| 4+ Person Household | 239 (39.2%) | 371 (60.8%) |
| Total Housing Units | 372 (36.6%) | 645 (63.4%) |
Occupancy by Educational Attainment in Laie
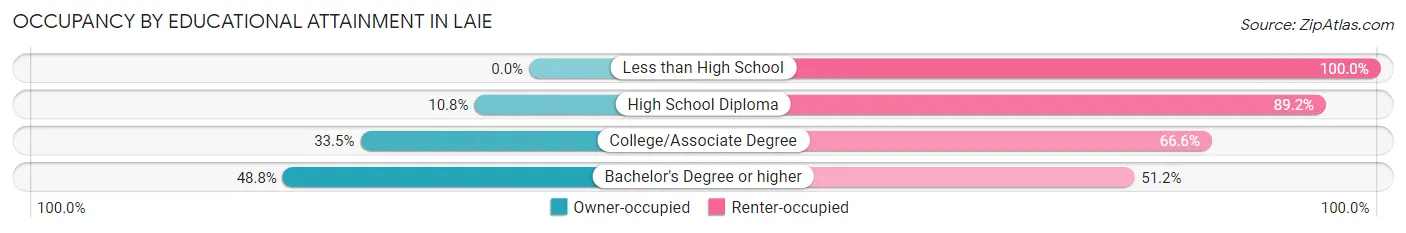
| Household Size | Owner-occupied | Renter-occupied |
| Less than High School | 0 (0.0%) | 4 (100.0%) |
| High School Diploma | 22 (10.8%) | 181 (89.2%) |
| College/Associate Degree | 99 (33.5%) | 197 (66.5%) |
| Bachelor's Degree or higher | 251 (48.8%) | 263 (51.2%) |
Occupancy by Age of Householder in Laie
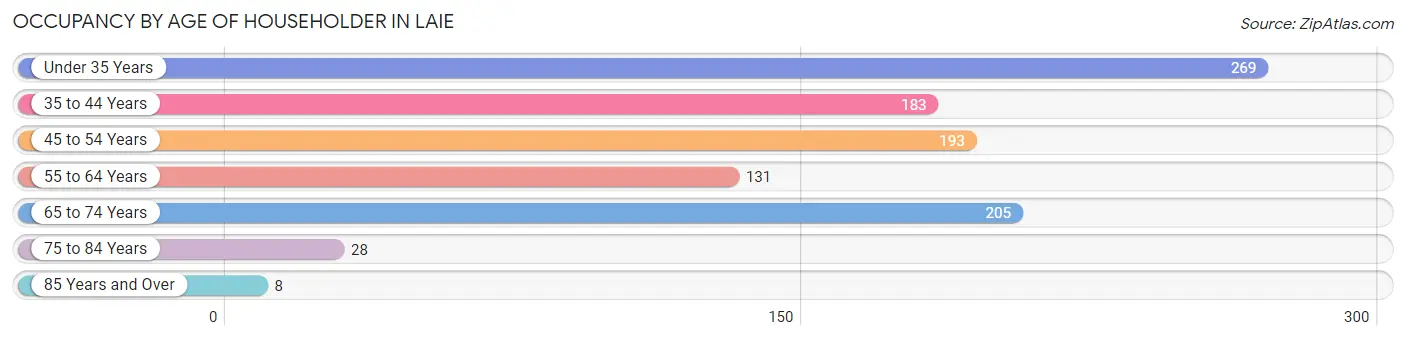
| Age Bracket | # Households | % Households |
| Under 35 Years | 269 | 26.5% |
| 35 to 44 Years | 183 | 18.0% |
| 45 to 54 Years | 193 | 19.0% |
| 55 to 64 Years | 131 | 12.9% |
| 65 to 74 Years | 205 | 20.2% |
| 75 to 84 Years | 28 | 2.8% |
| 85 Years and Over | 8 | 0.8% |
| Total | 1,017 | 100.0% |
Housing Finances in Laie
Median Income by Occupancy in Laie
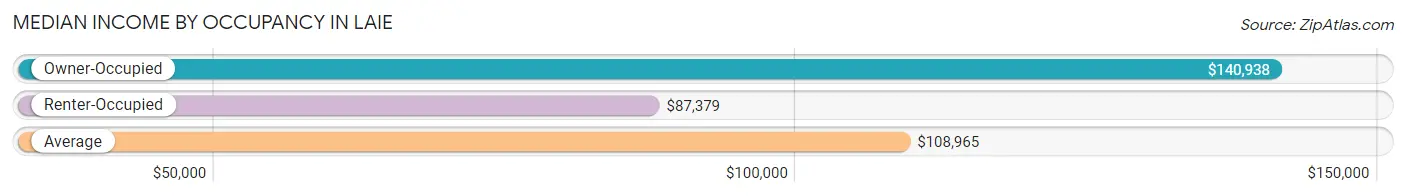
| Occupancy Type | # Households | Median Income |
| Owner-Occupied | 372 (36.6%) | $140,938 |
| Renter-Occupied | 645 (63.4%) | $87,379 |
| Average | 1,017 (100.0%) | $108,965 |
Occupancy by Householder Income Bracket in Laie
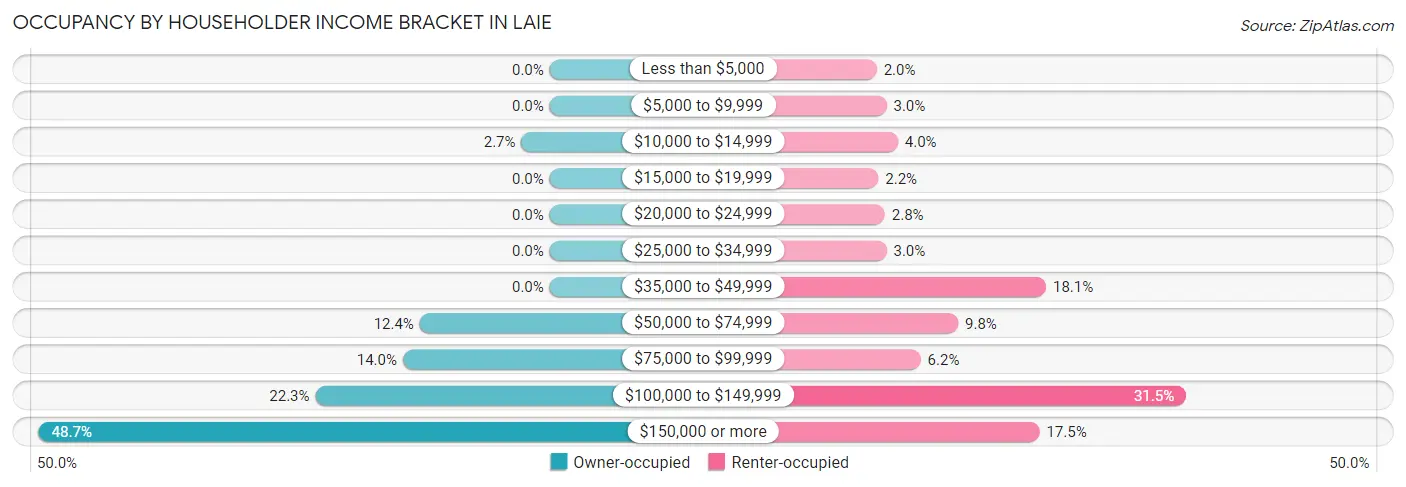
| Income Bracket | Owner-occupied | Renter-occupied |
| Less than $5,000 | 0 (0.0%) | 13 (2.0%) |
| $5,000 to $9,999 | 0 (0.0%) | 19 (2.9%) |
| $10,000 to $14,999 | 10 (2.7%) | 26 (4.0%) |
| $15,000 to $19,999 | 0 (0.0%) | 14 (2.2%) |
| $20,000 to $24,999 | 0 (0.0%) | 18 (2.8%) |
| $25,000 to $34,999 | 0 (0.0%) | 19 (2.9%) |
| $35,000 to $49,999 | 0 (0.0%) | 117 (18.1%) |
| $50,000 to $74,999 | 46 (12.4%) | 63 (9.8%) |
| $75,000 to $99,999 | 52 (14.0%) | 40 (6.2%) |
| $100,000 to $149,999 | 83 (22.3%) | 203 (31.5%) |
| $150,000 or more | 181 (48.7%) | 113 (17.5%) |
| Total | 372 (100.0%) | 645 (100.0%) |
Monthly Housing Cost Tiers in Laie
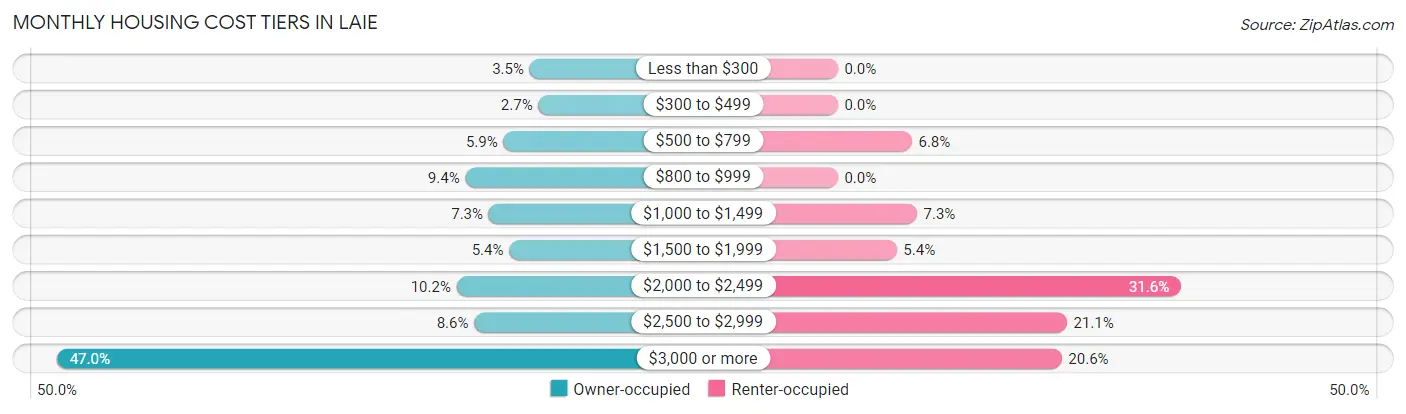
| Monthly Cost | Owner-occupied | Renter-occupied |
| Less than $300 | 13 (3.5%) | 0 (0.0%) |
| $300 to $499 | 10 (2.7%) | 0 (0.0%) |
| $500 to $799 | 22 (5.9%) | 44 (6.8%) |
| $800 to $999 | 35 (9.4%) | 0 (0.0%) |
| $1,000 to $1,499 | 27 (7.3%) | 47 (7.3%) |
| $1,500 to $1,999 | 20 (5.4%) | 35 (5.4%) |
| $2,000 to $2,499 | 38 (10.2%) | 204 (31.6%) |
| $2,500 to $2,999 | 32 (8.6%) | 136 (21.1%) |
| $3,000 or more | 175 (47.0%) | 133 (20.6%) |
| Total | 372 (100.0%) | 645 (100.0%) |
Physical Housing Characteristics in Laie
Housing Structures in Laie
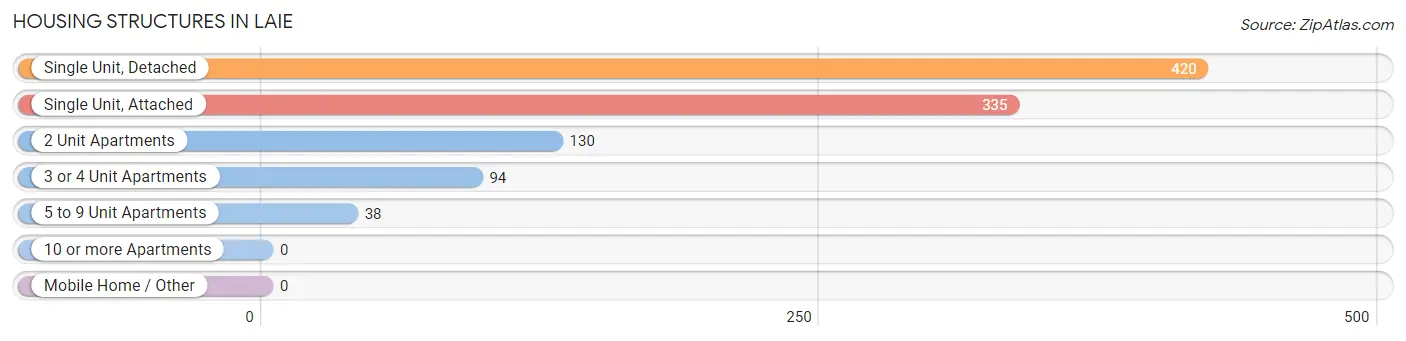
| Structure Type | # Housing Units | % Housing Units |
| Single Unit, Detached | 420 | 41.3% |
| Single Unit, Attached | 335 | 32.9% |
| 2 Unit Apartments | 130 | 12.8% |
| 3 or 4 Unit Apartments | 94 | 9.2% |
| 5 to 9 Unit Apartments | 38 | 3.7% |
| 10 or more Apartments | 0 | 0.0% |
| Mobile Home / Other | 0 | 0.0% |
| Total | 1,017 | 100.0% |
Housing Structures by Occupancy in Laie
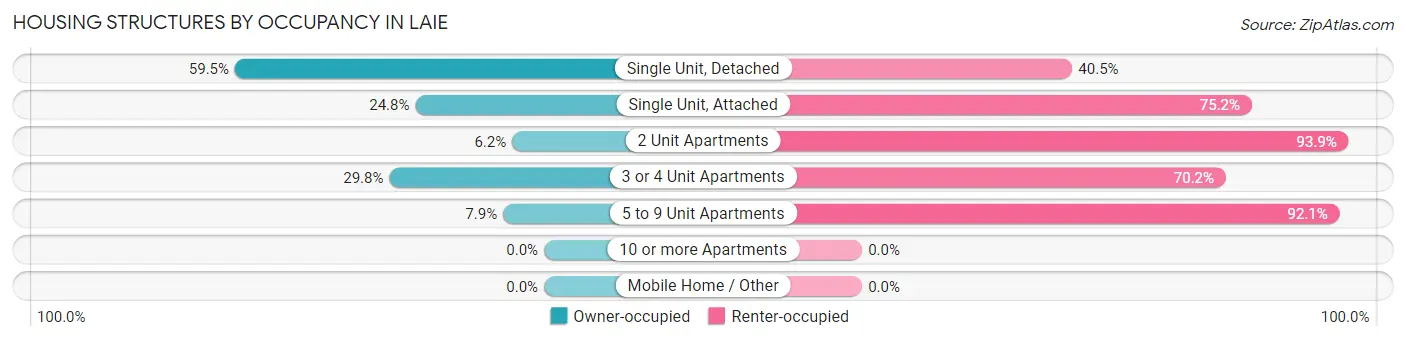
| Structure Type | Owner-occupied | Renter-occupied |
| Single Unit, Detached | 250 (59.5%) | 170 (40.5%) |
| Single Unit, Attached | 83 (24.8%) | 252 (75.2%) |
| 2 Unit Apartments | 8 (6.1%) | 122 (93.9%) |
| 3 or 4 Unit Apartments | 28 (29.8%) | 66 (70.2%) |
| 5 to 9 Unit Apartments | 3 (7.9%) | 35 (92.1%) |
| 10 or more Apartments | 0 (0.0%) | 0 (0.0%) |
| Mobile Home / Other | 0 (0.0%) | 0 (0.0%) |
| Total | 372 (36.6%) | 645 (63.4%) |
Housing Structures by Number of Rooms in Laie
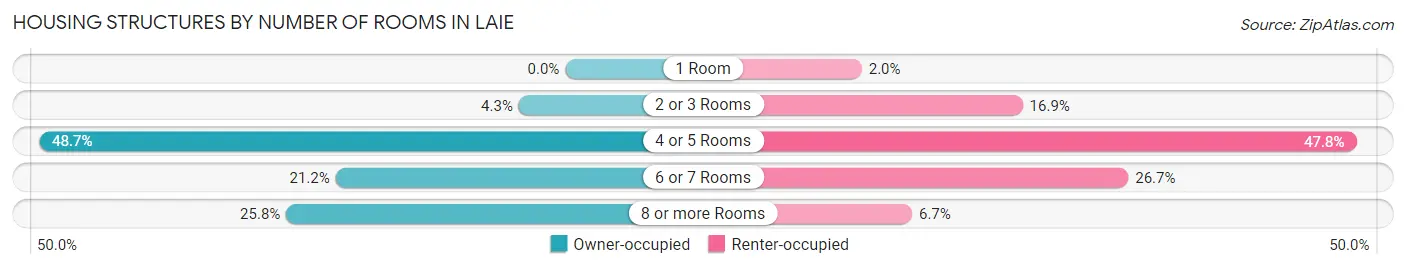
| Number of Rooms | Owner-occupied | Renter-occupied |
| 1 Room | 0 (0.0%) | 13 (2.0%) |
| 2 or 3 Rooms | 16 (4.3%) | 109 (16.9%) |
| 4 or 5 Rooms | 181 (48.7%) | 308 (47.7%) |
| 6 or 7 Rooms | 79 (21.2%) | 172 (26.7%) |
| 8 or more Rooms | 96 (25.8%) | 43 (6.7%) |
| Total | 372 (100.0%) | 645 (100.0%) |
Housing Structure by Heating Type in Laie
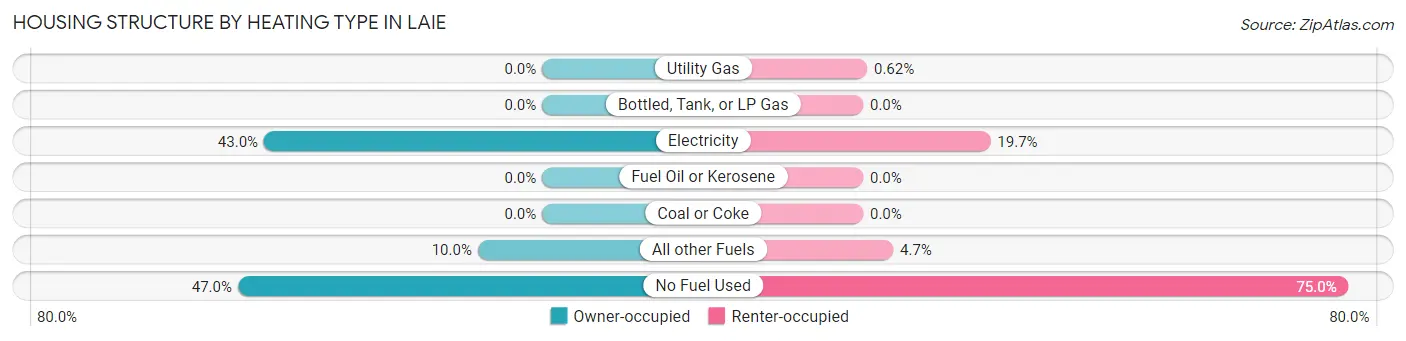
| Heating Type | Owner-occupied | Renter-occupied |
| Utility Gas | 0 (0.0%) | 4 (0.6%) |
| Bottled, Tank, or LP Gas | 0 (0.0%) | 0 (0.0%) |
| Electricity | 160 (43.0%) | 127 (19.7%) |
| Fuel Oil or Kerosene | 0 (0.0%) | 0 (0.0%) |
| Coal or Coke | 0 (0.0%) | 0 (0.0%) |
| All other Fuels | 37 (10.0%) | 30 (4.6%) |
| No Fuel Used | 175 (47.0%) | 484 (75.0%) |
| Total | 372 (100.0%) | 645 (100.0%) |
Household Vehicle Usage in Laie
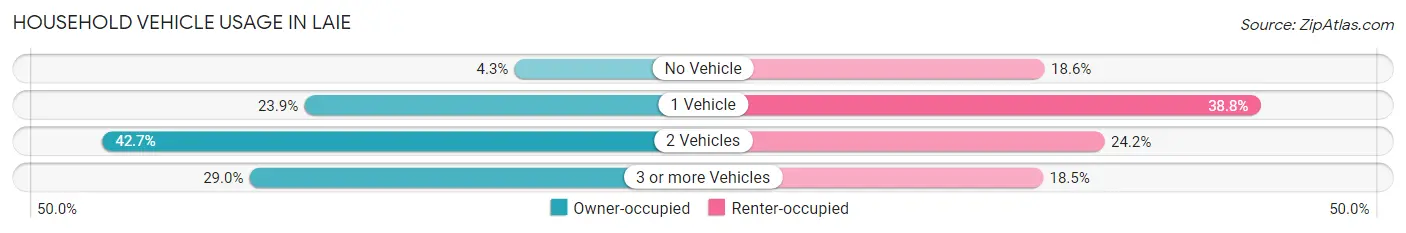
| Vehicles per Household | Owner-occupied | Renter-occupied |
| No Vehicle | 16 (4.3%) | 120 (18.6%) |
| 1 Vehicle | 89 (23.9%) | 250 (38.8%) |
| 2 Vehicles | 159 (42.7%) | 156 (24.2%) |
| 3 or more Vehicles | 108 (29.0%) | 119 (18.4%) |
| Total | 372 (100.0%) | 645 (100.0%) |
Real Estate & Mortgages in Laie
Real Estate and Mortgage Overview in Laie
| Characteristic | Without Mortgage | With Mortgage |
| Housing Units | 89 | 283 |
| Median Property Value | $1,102,700 | $916,400 |
| Median Household Income | $91,635 | $176 |
| Monthly Housing Costs | $818 | $175 |
| Real Estate Taxes | $1,875 | $10 |
Property Value by Mortgage Status in Laie
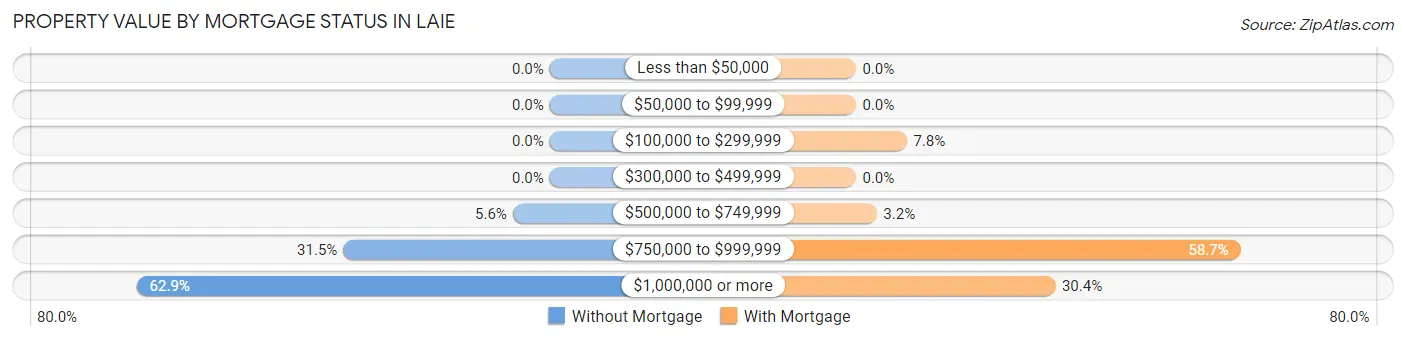
| Property Value | Without Mortgage | With Mortgage |
| Less than $50,000 | 0 (0.0%) | 0 (0.0%) |
| $50,000 to $99,999 | 0 (0.0%) | 0 (0.0%) |
| $100,000 to $299,999 | 0 (0.0%) | 22 (7.8%) |
| $300,000 to $499,999 | 0 (0.0%) | 0 (0.0%) |
| $500,000 to $749,999 | 5 (5.6%) | 9 (3.2%) |
| $750,000 to $999,999 | 28 (31.5%) | 166 (58.7%) |
| $1,000,000 or more | 56 (62.9%) | 86 (30.4%) |
| Total | 89 (100.0%) | 283 (100.0%) |
Household Income by Mortgage Status in Laie
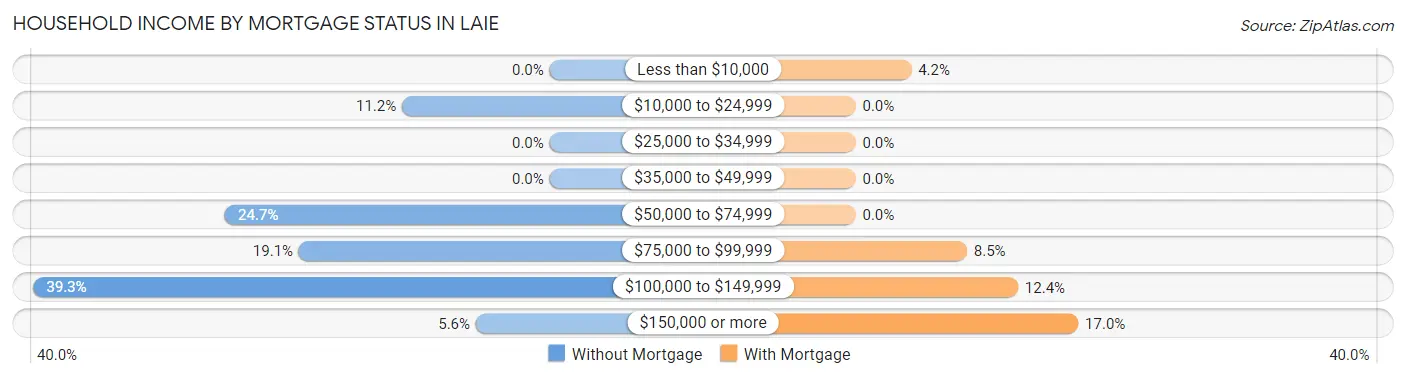
| Household Income | Without Mortgage | With Mortgage |
| Less than $10,000 | 0 (0.0%) | 12 (4.2%) |
| $10,000 to $24,999 | 10 (11.2%) | 0 (0.0%) |
| $25,000 to $34,999 | 0 (0.0%) | 0 (0.0%) |
| $35,000 to $49,999 | 0 (0.0%) | 0 (0.0%) |
| $50,000 to $74,999 | 22 (24.7%) | 0 (0.0%) |
| $75,000 to $99,999 | 17 (19.1%) | 24 (8.5%) |
| $100,000 to $149,999 | 35 (39.3%) | 35 (12.4%) |
| $150,000 or more | 5 (5.6%) | 48 (17.0%) |
| Total | 89 (100.0%) | 283 (100.0%) |
Property Value to Household Income Ratio in Laie
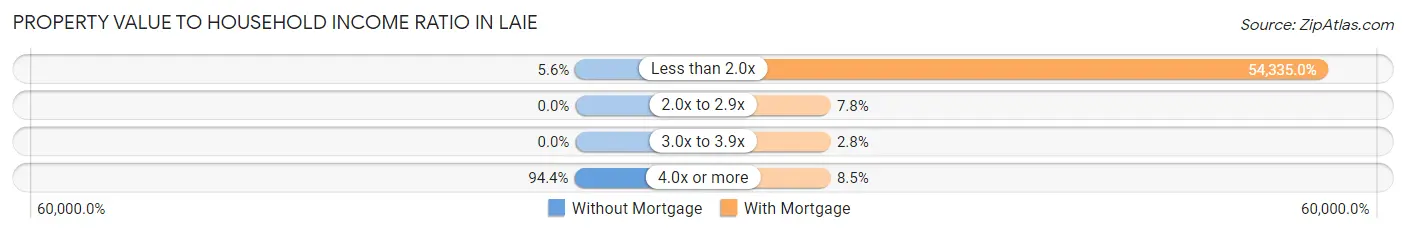
| Value-to-Income Ratio | Without Mortgage | With Mortgage |
| Less than 2.0x | 5 (5.6%) | 153,768 (54,335.0%) |
| 2.0x to 2.9x | 0 (0.0%) | 22 (7.8%) |
| 3.0x to 3.9x | 0 (0.0%) | 8 (2.8%) |
| 4.0x or more | 84 (94.4%) | 24 (8.5%) |
| Total | 89 (100.0%) | 283 (100.0%) |
Real Estate Taxes by Mortgage Status in Laie
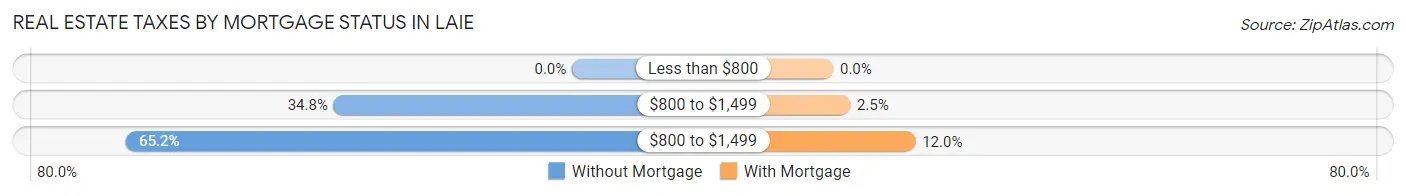
| Property Taxes | Without Mortgage | With Mortgage |
| Less than $800 | 0 (0.0%) | 0 (0.0%) |
| $800 to $1,499 | 31 (34.8%) | 7 (2.5%) |
| $800 to $1,499 | 58 (65.2%) | 34 (12.0%) |
| Total | 89 (100.0%) | 283 (100.0%) |
Health & Disability in Laie
Health Insurance Coverage by Age in Laie
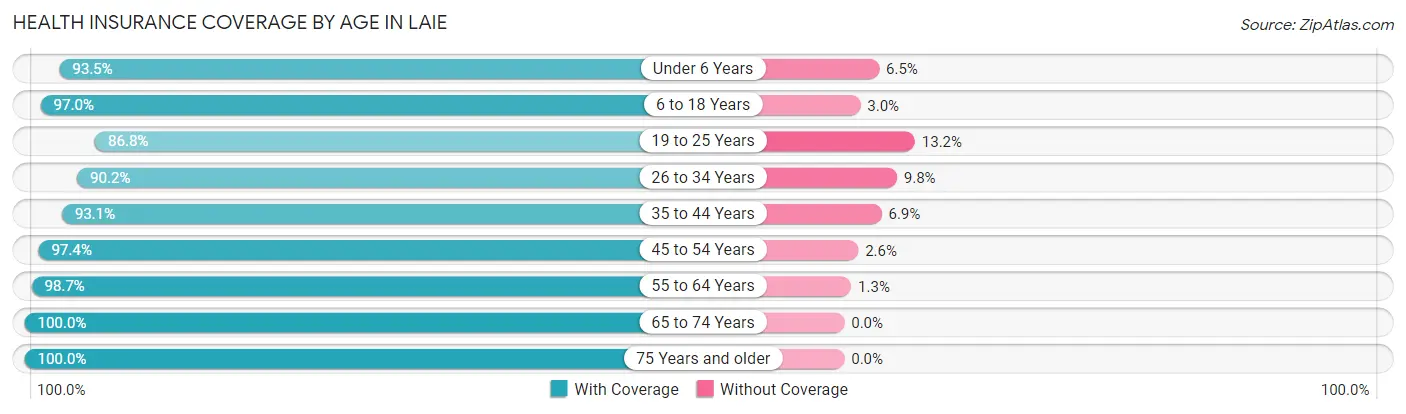
| Age Bracket | With Coverage | Without Coverage |
| Under 6 Years | 288 (93.5%) | 20 (6.5%) |
| 6 to 18 Years | 1,066 (97.0%) | 33 (3.0%) |
| 19 to 25 Years | 1,438 (86.8%) | 218 (13.2%) |
| 26 to 34 Years | 617 (90.2%) | 67 (9.8%) |
| 35 to 44 Years | 483 (93.1%) | 36 (6.9%) |
| 45 to 54 Years | 412 (97.4%) | 11 (2.6%) |
| 55 to 64 Years | 309 (98.7%) | 4 (1.3%) |
| 65 to 74 Years | 354 (100.0%) | 0 (0.0%) |
| 75 Years and older | 48 (100.0%) | 0 (0.0%) |
| Total | 5,015 (92.8%) | 389 (7.2%) |
Health Insurance Coverage by Citizenship Status in Laie
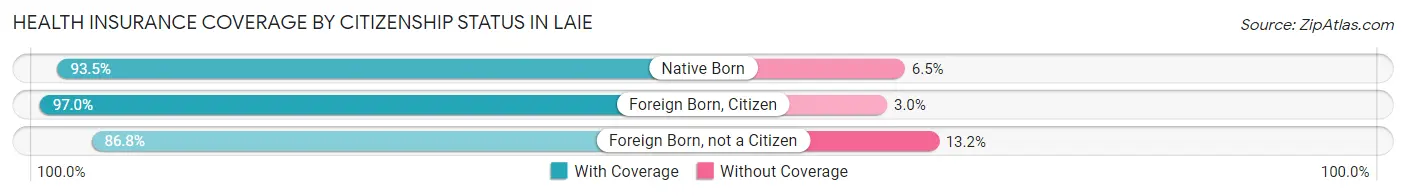
| Citizenship Status | With Coverage | Without Coverage |
| Native Born | 288 (93.5%) | 20 (6.5%) |
| Foreign Born, Citizen | 1,066 (97.0%) | 33 (3.0%) |
| Foreign Born, not a Citizen | 1,438 (86.8%) | 218 (13.2%) |
Health Insurance Coverage by Household Income in Laie
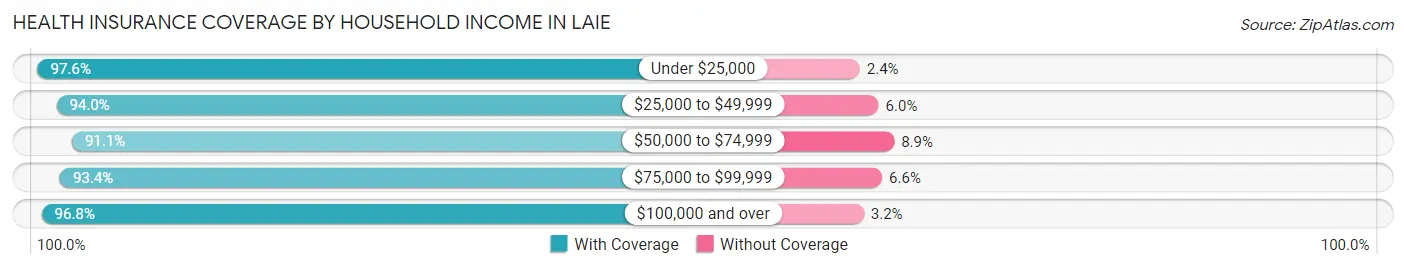
| Household Income | With Coverage | Without Coverage |
| Under $25,000 | 160 (97.6%) | 4 (2.4%) |
| $25,000 to $49,999 | 362 (94.0%) | 23 (6.0%) |
| $50,000 to $74,999 | 349 (91.1%) | 34 (8.9%) |
| $75,000 to $99,999 | 493 (93.4%) | 35 (6.6%) |
| $100,000 and over | 2,669 (96.8%) | 88 (3.2%) |
Public vs Private Health Insurance Coverage by Age in Laie
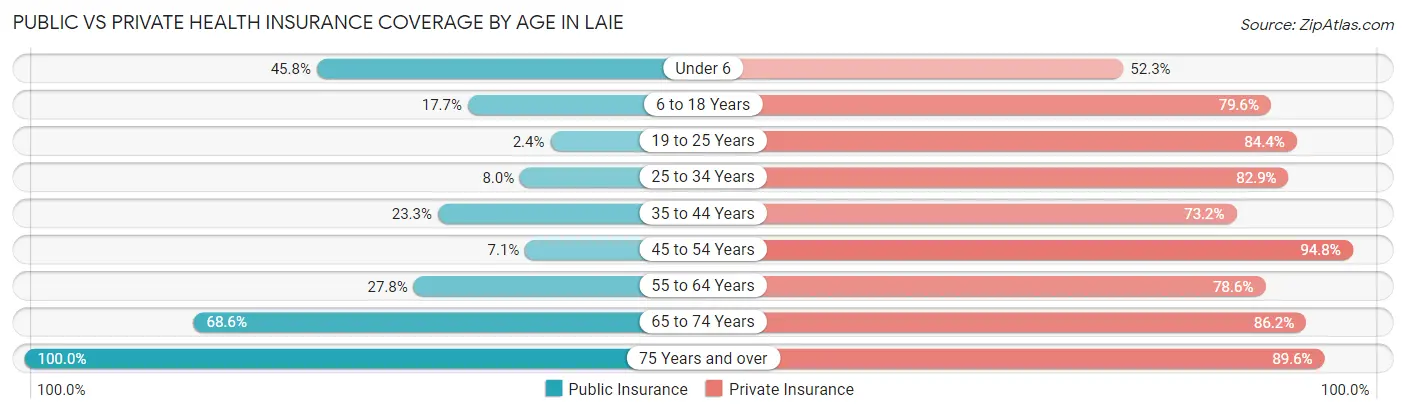
| Age Bracket | Public Insurance | Private Insurance |
| Under 6 | 141 (45.8%) | 161 (52.3%) |
| 6 to 18 Years | 195 (17.7%) | 875 (79.6%) |
| 19 to 25 Years | 40 (2.4%) | 1,398 (84.4%) |
| 25 to 34 Years | 55 (8.0%) | 567 (82.9%) |
| 35 to 44 Years | 121 (23.3%) | 380 (73.2%) |
| 45 to 54 Years | 30 (7.1%) | 401 (94.8%) |
| 55 to 64 Years | 87 (27.8%) | 246 (78.6%) |
| 65 to 74 Years | 243 (68.6%) | 305 (86.2%) |
| 75 Years and over | 48 (100.0%) | 43 (89.6%) |
| Total | 960 (17.8%) | 4,376 (81.0%) |
Disability Status by Sex by Age in Laie
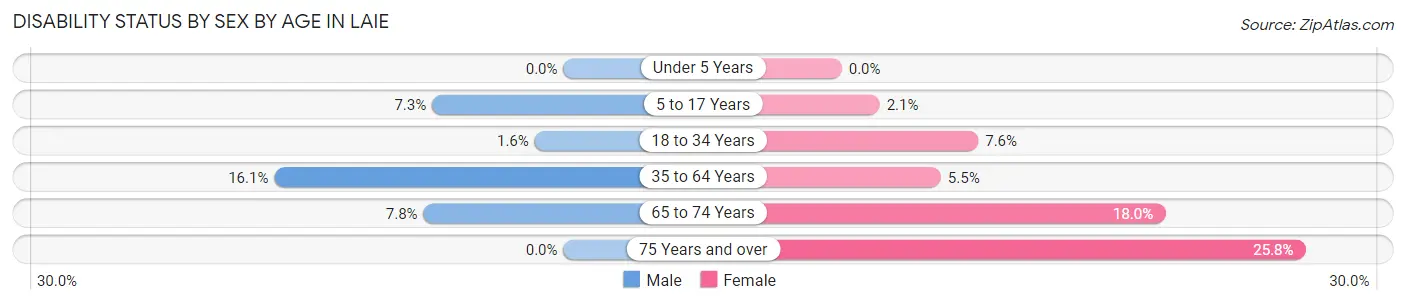
| Age Bracket | Male | Female |
| Under 5 Years | 0 (0.0%) | 0 (0.0%) |
| 5 to 17 Years | 40 (7.3%) | 9 (2.1%) |
| 18 to 34 Years | 17 (1.6%) | 110 (7.6%) |
| 35 to 64 Years | 100 (16.1%) | 35 (5.5%) |
| 65 to 74 Years | 12 (7.8%) | 36 (18.0%) |
| 75 Years and over | 0 (0.0%) | 8 (25.8%) |
Disability Class by Sex by Age in Laie
Disability Class: Hearing Difficulty
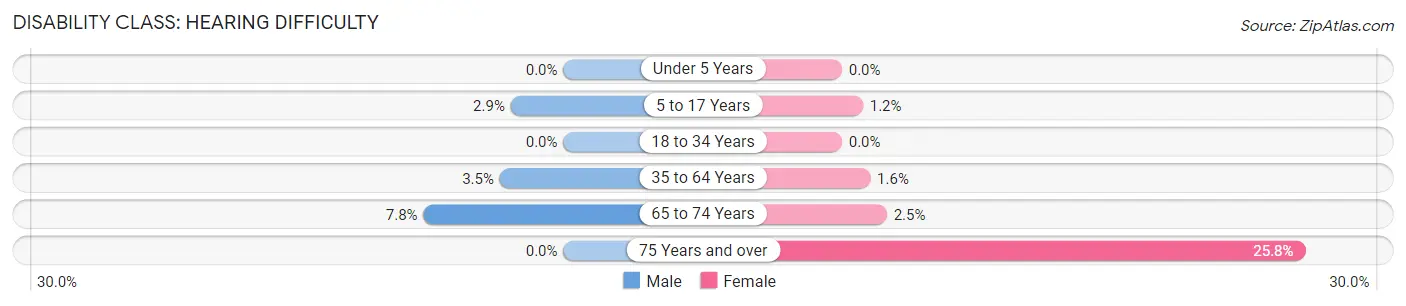
| Age Bracket | Male | Female |
| Under 5 Years | 0 (0.0%) | 0 (0.0%) |
| 5 to 17 Years | 16 (2.9%) | 5 (1.2%) |
| 18 to 34 Years | 0 (0.0%) | 0 (0.0%) |
| 35 to 64 Years | 22 (3.5%) | 10 (1.6%) |
| 65 to 74 Years | 12 (7.8%) | 5 (2.5%) |
| 75 Years and over | 0 (0.0%) | 8 (25.8%) |
Disability Class: Vision Difficulty
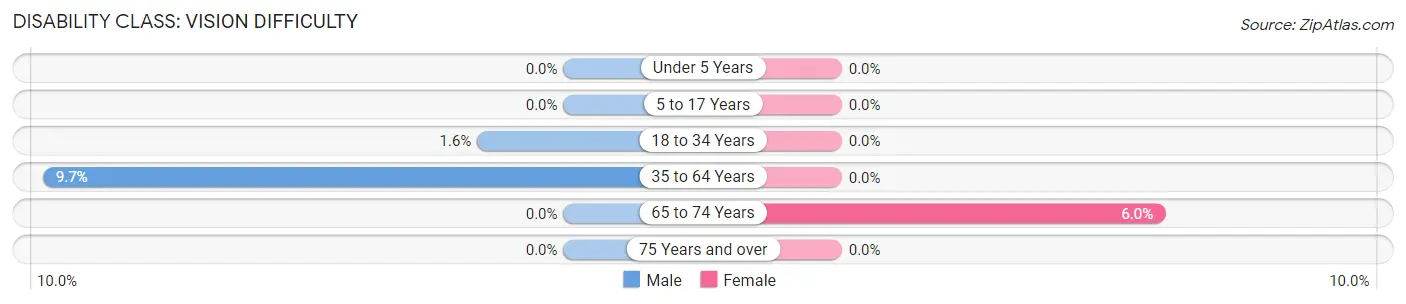
| Age Bracket | Male | Female |
| Under 5 Years | 0 (0.0%) | 0 (0.0%) |
| 5 to 17 Years | 0 (0.0%) | 0 (0.0%) |
| 18 to 34 Years | 17 (1.6%) | 0 (0.0%) |
| 35 to 64 Years | 60 (9.7%) | 0 (0.0%) |
| 65 to 74 Years | 0 (0.0%) | 12 (6.0%) |
| 75 Years and over | 0 (0.0%) | 0 (0.0%) |
Disability Class: Cognitive Difficulty
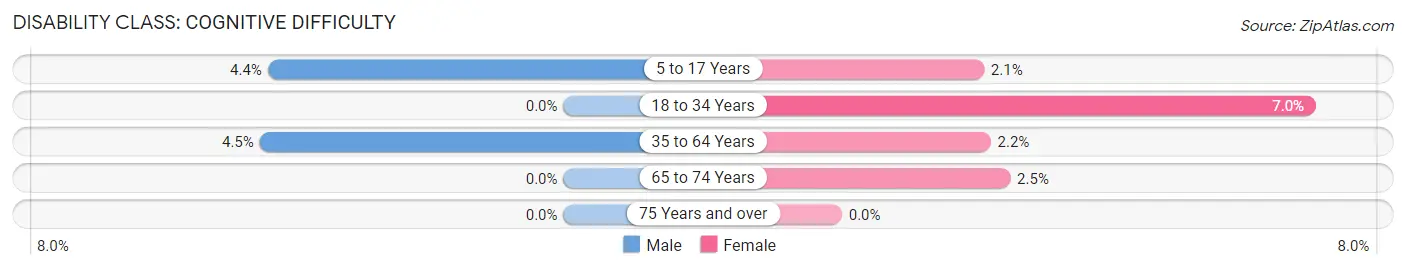
| Age Bracket | Male | Female |
| 5 to 17 Years | 24 (4.4%) | 9 (2.1%) |
| 18 to 34 Years | 0 (0.0%) | 102 (7.0%) |
| 35 to 64 Years | 28 (4.5%) | 14 (2.2%) |
| 65 to 74 Years | 0 (0.0%) | 5 (2.5%) |
| 75 Years and over | 0 (0.0%) | 0 (0.0%) |
Disability Class: Ambulatory Difficulty
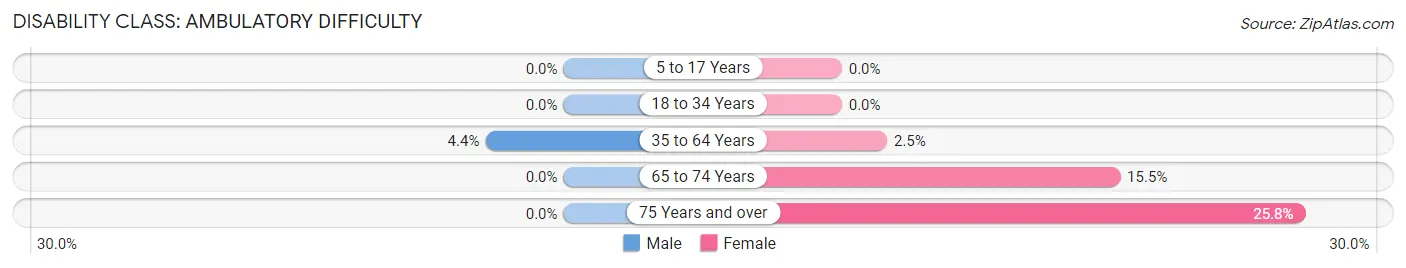
| Age Bracket | Male | Female |
| 5 to 17 Years | 0 (0.0%) | 0 (0.0%) |
| 18 to 34 Years | 0 (0.0%) | 0 (0.0%) |
| 35 to 64 Years | 27 (4.3%) | 16 (2.5%) |
| 65 to 74 Years | 0 (0.0%) | 31 (15.5%) |
| 75 Years and over | 0 (0.0%) | 8 (25.8%) |
Disability Class: Self-Care Difficulty
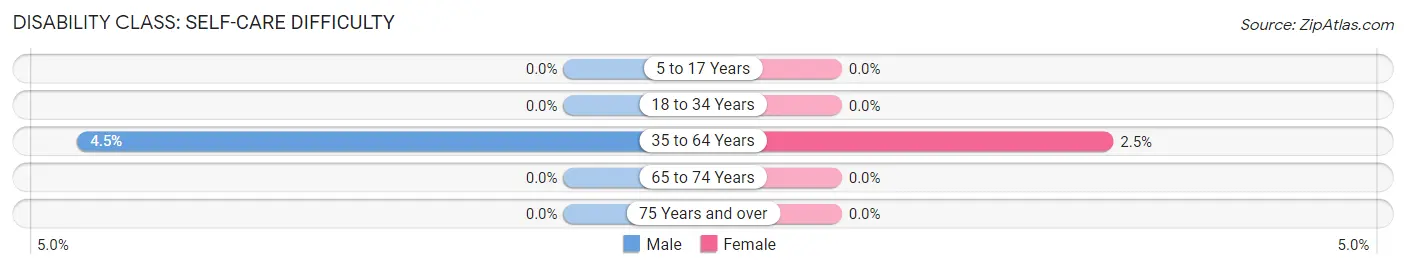
| Age Bracket | Male | Female |
| 5 to 17 Years | 0 (0.0%) | 0 (0.0%) |
| 18 to 34 Years | 0 (0.0%) | 0 (0.0%) |
| 35 to 64 Years | 28 (4.5%) | 16 (2.5%) |
| 65 to 74 Years | 0 (0.0%) | 0 (0.0%) |
| 75 Years and over | 0 (0.0%) | 0 (0.0%) |
Technology Access in Laie
Computing Device Access in Laie
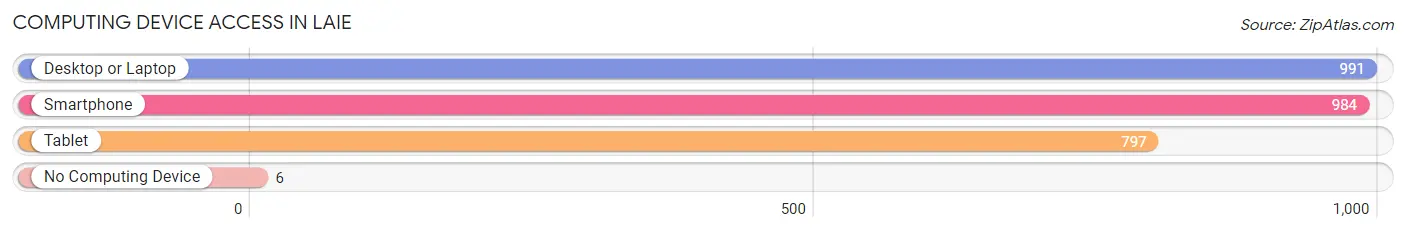
| Device Type | # Households | % Households |
| Desktop or Laptop | 991 | 97.4% |
| Smartphone | 984 | 96.8% |
| Tablet | 797 | 78.4% |
| No Computing Device | 6 | 0.6% |
| Total | 1,017 | 100.0% |
Internet Access in Laie
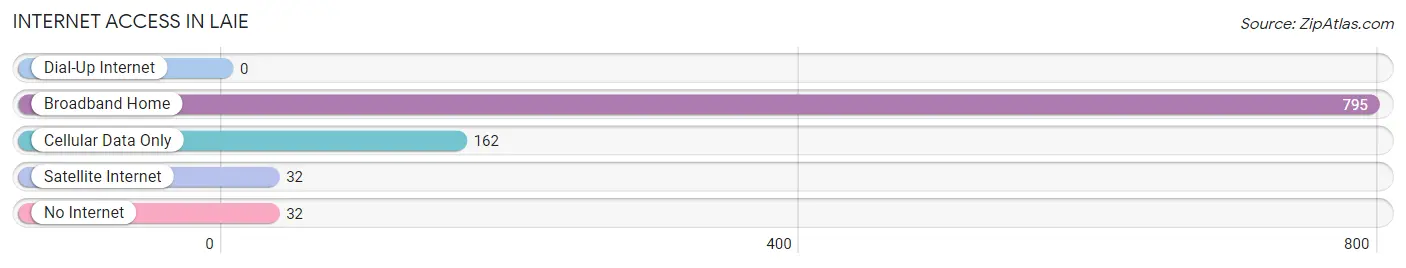
| Internet Type | # Households | % Households |
| Dial-Up Internet | 0 | 0.0% |
| Broadband Home | 795 | 78.2% |
| Cellular Data Only | 162 | 15.9% |
| Satellite Internet | 32 | 3.2% |
| No Internet | 32 | 3.2% |
| Total | 1,017 | 100.0% |
Laie Summary
Laie is a small town located on the north shore of the Hawaiian island of Oahu. It is part of the City and County of Honolulu and is located in the Koolauloa District. Laie is known for its strong ties to the Church of Jesus Christ of Latter-day Saints (LDS) and is home to the Polynesian Cultural Center, a popular tourist attraction.
Geography
Laie is located on the north shore of Oahu, approximately 25 miles (40 km) from Honolulu. It is situated on a narrow strip of land between the Pacific Ocean and the Laie Bay. The town is surrounded by lush tropical vegetation and is home to several beaches, including Laie Beach, Malaekahana Beach, and Pohakea Beach. The town is also home to the Laie Point State Wayside, a popular spot for fishing and sightseeing.
Economy
Laie’s economy is largely driven by tourism. The town is home to the Polynesian Cultural Center, a popular tourist attraction that features interactive exhibits and performances showcasing the culture and traditions of the Pacific Islands. The center also offers educational programs and cultural activities. Laie is also home to several resorts, including the Turtle Bay Resort and the Laie Inn.
The town is also home to several businesses, including restaurants, retail stores, and service providers. The LDS Church is a major employer in the town, providing jobs in the church’s various departments and organizations.
Demographics
As of the 2010 census, Laie had a population of 5,913. The racial makeup of the town was 57.3% White, 0.3% African American, 0.3% Native American, 24.2% Asian, 0.2% Pacific Islander, and 17.7% from other races. The median household income was $50,945, and the median family income was $54,945.
Laie is home to a large population of Latter-day Saints. Approximately 70% of the town’s population is LDS, and the town is home to the Laie Hawaii Temple, the fifth temple of the LDS Church. The town is also home to Brigham Young University-Hawaii, a private university owned and operated by the LDS Church.
Conclusion
Laie is a small town located on the north shore of Oahu, Hawaii. It is known for its strong ties to the Church of Jesus Christ of Latter-day Saints and is home to the Polynesian Cultural Center, a popular tourist attraction. The town’s economy is largely driven by tourism, and it is home to several businesses, including restaurants, retail stores, and service providers. Laie is home to a large population of Latter-day Saints, and the median household income is $50,945.
Common Questions
What is Per Capita Income in Laie?
Per Capita income in Laie is $24,420.
What is the Median Family Income in Laie?
Median Family Income in Laie is $118,750.
What is the Median Household income in Laie?
Median Household Income in Laie is $108,965.
What is Income or Wage Gap in Laie?
Income or Wage Gap in Laie is 64.4%.
Women in Laie earn 35.6 cents for every dollar earned by a man.
What is Inequality or Gini Index in Laie?
Inequality or Gini Index in Laie is 0.37.
What is the Total Population of Laie?
Total Population of Laie is 5,411.
What is the Total Male Population of Laie?
Total Male Population of Laie is 2,524.
What is the Total Female Population of Laie?
Total Female Population of Laie is 2,887.
What is the Ratio of Males per 100 Females in Laie?
There are 87.43 Males per 100 Females in Laie.
What is the Ratio of Females per 100 Males in Laie?
There are 114.38 Females per 100 Males in Laie.
What is the Median Population Age in Laie?
Median Population Age in Laie is 23.7 Years.
What is the Average Family Size in Laie
Average Family Size in Laie is 4.6 People.
What is the Average Household Size in Laie
Average Household Size in Laie is 4.2 People.
How Large is the Labor Force in Laie?
There are 3,011 People in the Labor Forcein in Laie.
What is the Percentage of People in the Labor Force in Laie?
68.8% of People are in the Labor Force in Laie.
What is the Unemployment Rate in Laie?
Unemployment Rate in Laie is 9.0%.