Waycross, GA Map & Demographics
Waycross Map
Waycross Overview
$20,668
PER CAPITA INCOME
$40,711
AVG FAMILY INCOME
$36,818
AVG HOUSEHOLD INCOME
18.6%
WAGE / INCOME GAP [ % ]
81.4¢/ $1
WAGE / INCOME GAP [ $ ]
0.48
INEQUALITY / GINI INDEX
13,856
TOTAL POPULATION
6,212
MALE POPULATION
7,644
FEMALE POPULATION
81.27
MALES / 100 FEMALES
123.05
FEMALES / 100 MALES
34.7
MEDIAN AGE
3.6
AVG FAMILY SIZE
2.5
AVG HOUSEHOLD SIZE
4,744
LABOR FORCE [ PEOPLE ]
47.5%
PERCENT IN LABOR FORCE
6.5%
UNEMPLOYMENT RATE
Waycross Area Codes
Income in Waycross
Income Overview in Waycross
Per Capita Income in Waycross is $20,668, while median incomes of families and households are $40,711 and $36,818 respectively.
| Characteristic | Number | Measure |
| Per Capita Income | 13,856 | $20,668 |
| Median Family Income | 2,811 | $40,711 |
| Mean Family Income | 2,811 | $54,530 |
| Median Household Income | 5,300 | $36,818 |
| Mean Household Income | 5,300 | $50,100 |
| Income Deficit | 2,811 | $0 |
| Wage / Income Gap (%) | 13,856 | 18.59% |
| Wage / Income Gap ($) | 13,856 | 81.41¢ per $1 |
| Gini / Inequality Index | 13,856 | 0.48 |
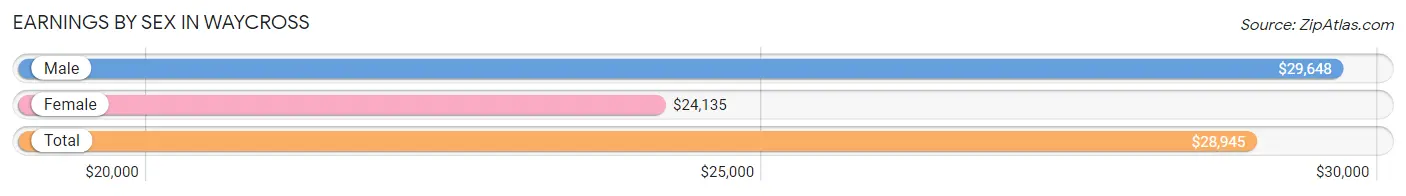
Earnings by Sex in Waycross
Average Earnings in Waycross are $28,945, $29,648 for men and $24,135 for women, a difference of 18.6%.
| Sex | Number | Average Earnings |
| Male | 2,241 (46.4%) | $29,648 |
| Female | 2,592 (53.6%) | $24,135 |
| Total | 4,833 (100.0%) | $28,945 |
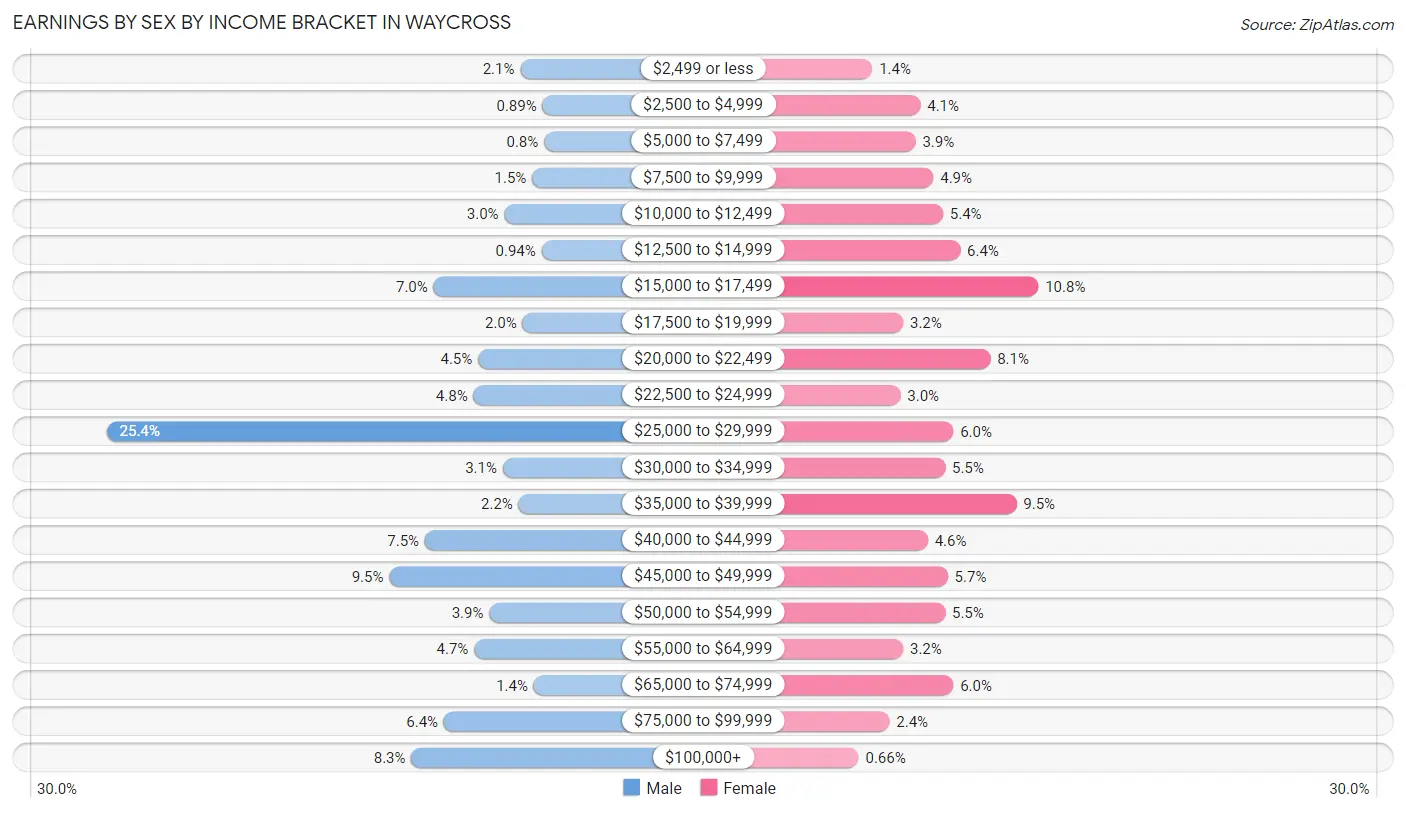
Earnings by Sex by Income Bracket in Waycross
The most common earnings brackets in Waycross are $25,000 to $29,999 for men (569 | 25.4%) and $15,000 to $17,499 for women (279 | 10.8%).
| Income | Male | Female |
| $2,499 or less | 48 (2.1%) | 37 (1.4%) |
| $2,500 to $4,999 | 20 (0.9%) | 107 (4.1%) |
| $5,000 to $7,499 | 18 (0.8%) | 100 (3.9%) |
| $7,500 to $9,999 | 33 (1.5%) | 126 (4.9%) |
| $10,000 to $12,499 | 68 (3.0%) | 140 (5.4%) |
| $12,500 to $14,999 | 21 (0.9%) | 165 (6.4%) |
| $15,000 to $17,499 | 157 (7.0%) | 279 (10.8%) |
| $17,500 to $19,999 | 45 (2.0%) | 82 (3.2%) |
| $20,000 to $22,499 | 101 (4.5%) | 209 (8.1%) |
| $22,500 to $24,999 | 107 (4.8%) | 78 (3.0%) |
| $25,000 to $29,999 | 569 (25.4%) | 155 (6.0%) |
| $30,000 to $34,999 | 70 (3.1%) | 143 (5.5%) |
| $35,000 to $39,999 | 50 (2.2%) | 247 (9.5%) |
| $40,000 to $44,999 | 168 (7.5%) | 118 (4.5%) |
| $45,000 to $49,999 | 213 (9.5%) | 147 (5.7%) |
| $50,000 to $54,999 | 87 (3.9%) | 143 (5.5%) |
| $55,000 to $64,999 | 106 (4.7%) | 82 (3.2%) |
| $65,000 to $74,999 | 31 (1.4%) | 155 (6.0%) |
| $75,000 to $99,999 | 144 (6.4%) | 62 (2.4%) |
| $100,000+ | 185 (8.3%) | 17 (0.7%) |
| Total | 2,241 (100.0%) | 2,592 (100.0%) |
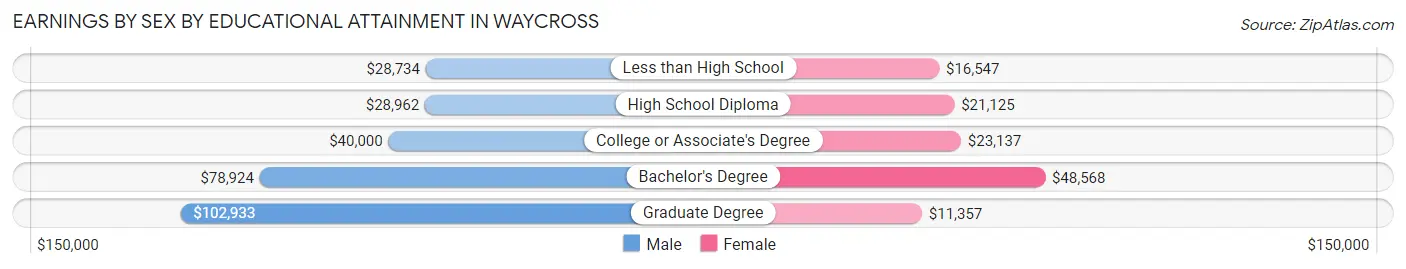
Earnings by Sex by Educational Attainment in Waycross
Average earnings in Waycross are $33,603 for men and $26,184 for women, a difference of 22.1%. Men with an educational attainment of graduate degree enjoy the highest average annual earnings of $102,933, while those with less than high school education earn the least with $28,734. Women with an educational attainment of bachelor's degree earn the most with the average annual earnings of $48,568, while those with graduate degree education have the smallest earnings of $11,357.
| Educational Attainment | Male Income | Female Income |
| Less than High School | $28,734 | $16,547 |
| High School Diploma | $28,962 | $21,125 |
| College or Associate's Degree | $40,000 | $23,137 |
| Bachelor's Degree | $78,924 | $48,568 |
| Graduate Degree | $102,933 | $11,357 |
| Total | $33,603 | $26,184 |
Family Income in Waycross
Family Income Brackets in Waycross
According to the Waycross family income data, there are 559 families falling into the $35,000 to $49,999 income range, which is the most common income bracket and makes up 19.9% of all families. Conversely, the $150,000 to $199,999 income bracket is the least frequent group with only 45 families (1.6%) belonging to this category.
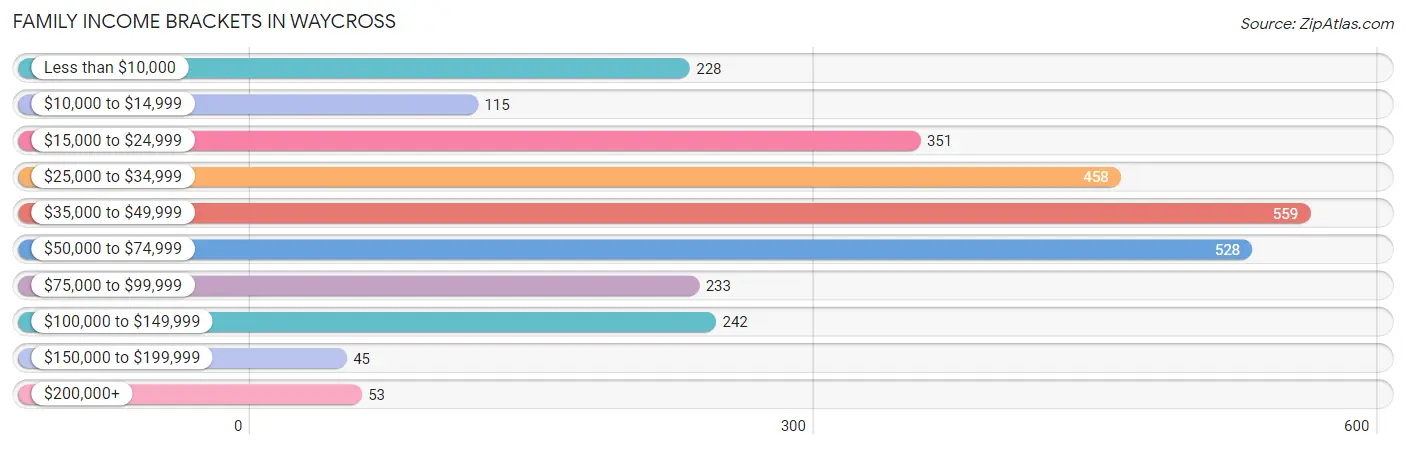
| Income Bracket | # Families | % Families |
| Less than $10,000 | 228 | 8.1% |
| $10,000 to $14,999 | 115 | 4.1% |
| $15,000 to $24,999 | 351 | 12.5% |
| $25,000 to $34,999 | 458 | 16.3% |
| $35,000 to $49,999 | 559 | 19.9% |
| $50,000 to $74,999 | 528 | 18.8% |
| $75,000 to $99,999 | 233 | 8.3% |
| $100,000 to $149,999 | 242 | 8.6% |
| $150,000 to $199,999 | 45 | 1.6% |
| $200,000+ | 53 | 1.9% |
Family Income by Famaliy Size in Waycross
3-person families (619 | 22.0%) account for the highest median family income in Waycross with $48,750 per family, while 2-person families (1,359 | 48.3%) have the highest median income of $19,732 per family member.
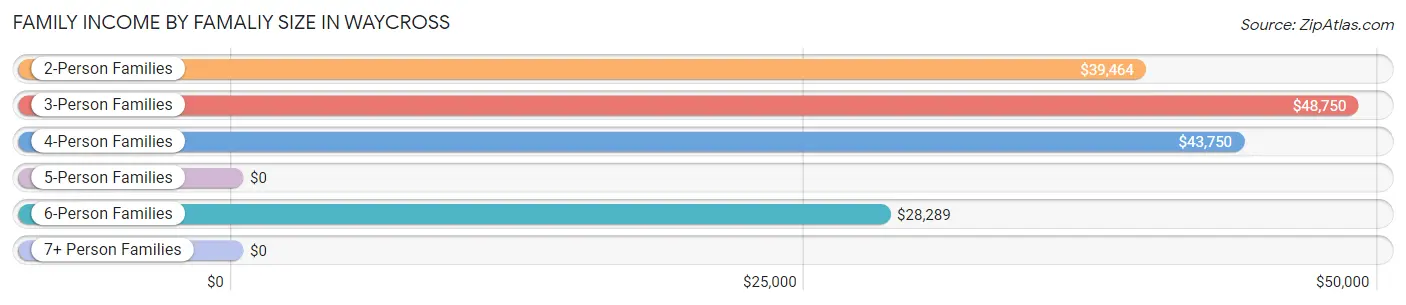
| Income Bracket | # Families | Median Income |
| 2-Person Families | 1,359 (48.3%) | $39,464 |
| 3-Person Families | 619 (22.0%) | $48,750 |
| 4-Person Families | 416 (14.8%) | $43,750 |
| 5-Person Families | 267 (9.5%) | $0 |
| 6-Person Families | 140 (5.0%) | $28,289 |
| 7+ Person Families | 10 (0.4%) | $0 |
| Total | 2,811 (100.0%) | $40,711 |
Family Income by Number of Earners in Waycross
The median family income in Waycross is $40,711, with families comprising 3+ earners (46) having the highest median family income of $122,788, while families with no earners (845) have the lowest median family income of $26,733, accounting for 1.6% and 30.1% of families, respectively.
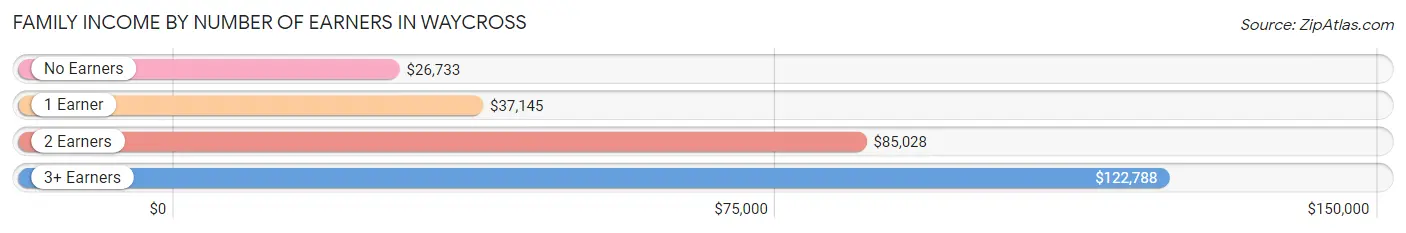
| Number of Earners | # Families | Median Income |
| No Earners | 845 (30.1%) | $26,733 |
| 1 Earner | 1,423 (50.6%) | $37,145 |
| 2 Earners | 497 (17.7%) | $85,028 |
| 3+ Earners | 46 (1.6%) | $122,788 |
| Total | 2,811 (100.0%) | $40,711 |
Household Income in Waycross
Household Income Brackets in Waycross
With 896 households falling in the category, the $35,000 to $49,999 income range is the most frequent in Waycross, accounting for 16.9% of all households. In contrast, only 42 households (0.8%) fall into the $150,000 to $199,999 income bracket, making it the least populous group.
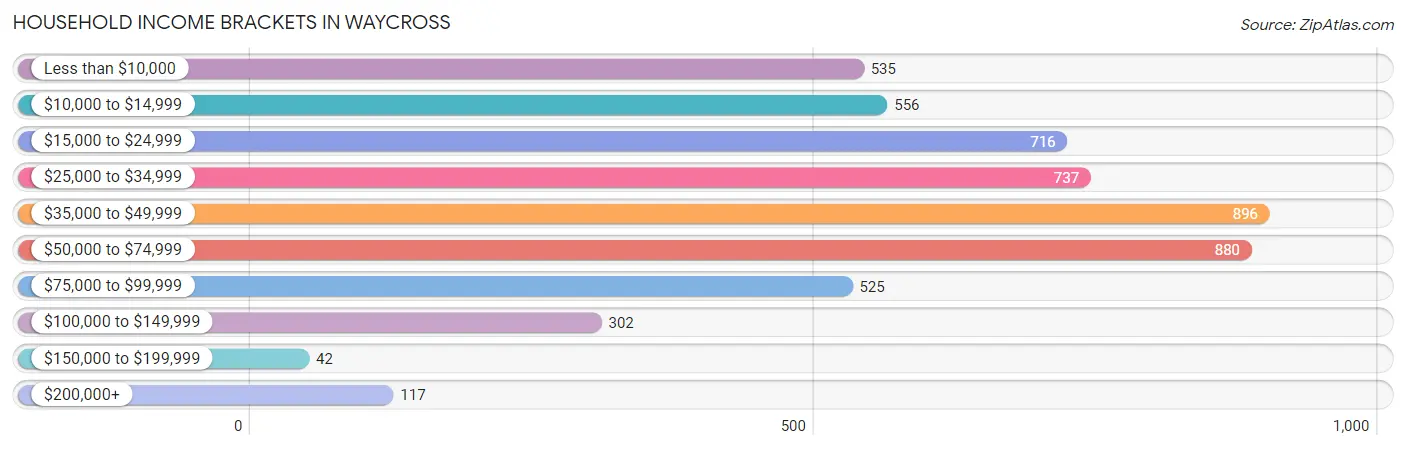
| Income Bracket | # Households | % Households |
| Less than $10,000 | 535 | 10.1% |
| $10,000 to $14,999 | 556 | 10.5% |
| $15,000 to $24,999 | 716 | 13.5% |
| $25,000 to $34,999 | 737 | 13.9% |
| $35,000 to $49,999 | 896 | 16.9% |
| $50,000 to $74,999 | 880 | 16.6% |
| $75,000 to $99,999 | 525 | 9.9% |
| $100,000 to $149,999 | 302 | 5.7% |
| $150,000 to $199,999 | 42 | 0.8% |
| $200,000+ | 117 | 2.2% |
Household Income by Householder Age in Waycross
The median household income in Waycross is $36,818, with the highest median household income of $44,201 found in the 45 to 64 years age bracket for the primary householder. A total of 1,735 households (32.7%) fall into this category. Meanwhile, the 15 to 24 years age bracket for the primary householder has the lowest median household income of $4,032, with 128 households (2.4%) in this group.
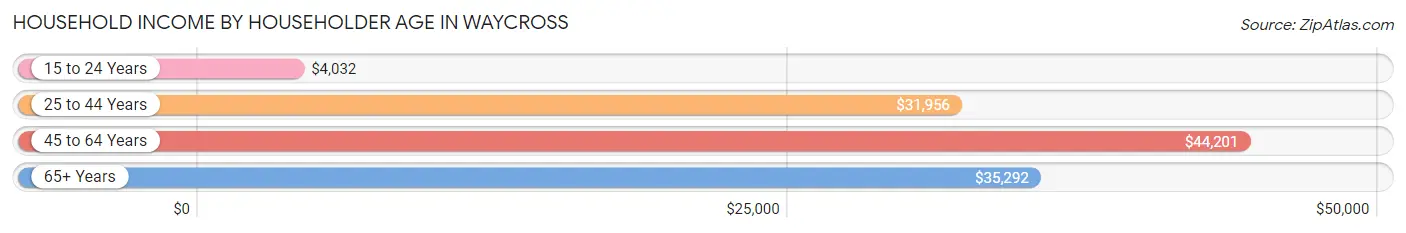
| Income Bracket | # Households | Median Income |
| 15 to 24 Years | 128 (2.4%) | $4,032 |
| 25 to 44 Years | 2,007 (37.9%) | $31,956 |
| 45 to 64 Years | 1,735 (32.7%) | $44,201 |
| 65+ Years | 1,430 (27.0%) | $35,292 |
| Total | 5,300 (100.0%) | $36,818 |
Poverty in Waycross
Income Below Poverty by Sex and Age in Waycross
With 31.0% poverty level for males and 36.1% for females among the residents of Waycross, 5 year old males and 6 to 11 year old females are the most vulnerable to poverty, with 219 males (100.0%) and 510 females (66.3%) in their respective age groups living below the poverty level.
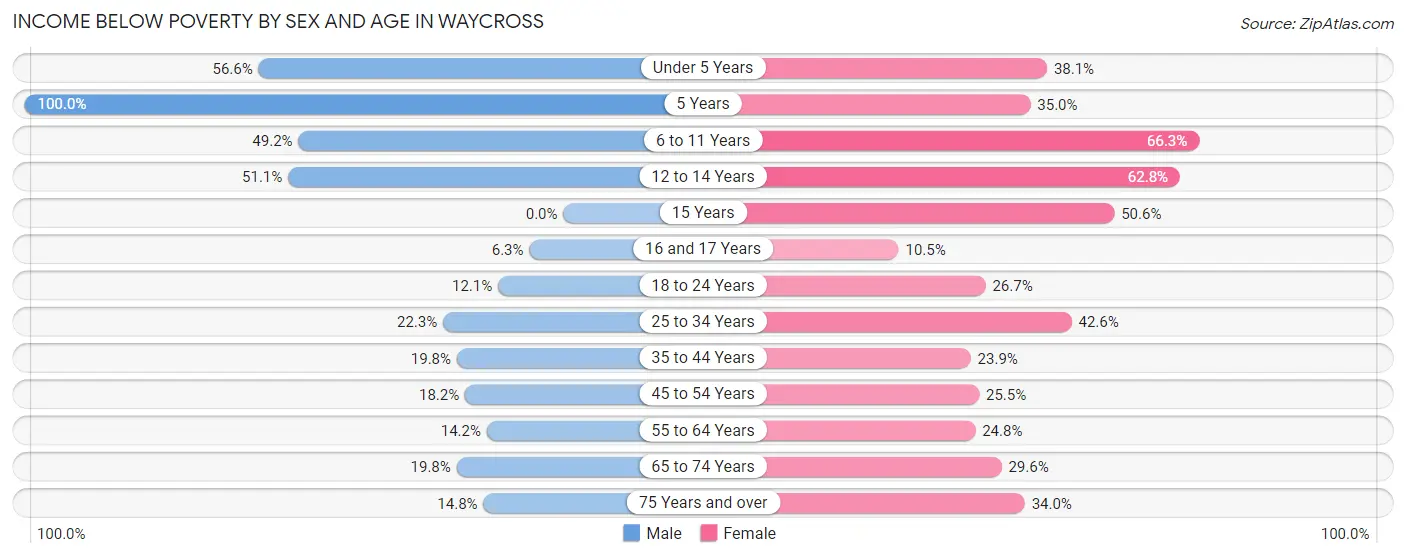
| Age Bracket | Male | Female |
| Under 5 Years | 396 (56.6%) | 171 (38.1%) |
| 5 Years | 219 (100.0%) | 7 (35.0%) |
| 6 to 11 Years | 421 (49.2%) | 510 (66.3%) |
| 12 to 14 Years | 141 (51.1%) | 219 (62.7%) |
| 15 Years | 0 (0.0%) | 44 (50.6%) |
| 16 and 17 Years | 7 (6.3%) | 22 (10.5%) |
| 18 to 24 Years | 49 (12.1%) | 136 (26.7%) |
| 25 to 34 Years | 134 (22.3%) | 545 (42.6%) |
| 35 to 44 Years | 189 (19.8%) | 182 (23.9%) |
| 45 to 54 Years | 83 (18.2%) | 230 (25.5%) |
| 55 to 64 Years | 102 (14.2%) | 185 (24.8%) |
| 65 to 74 Years | 82 (19.8%) | 198 (29.6%) |
| 75 Years and over | 42 (14.8%) | 203 (34.0%) |
| Total | 1,865 (31.0%) | 2,652 (36.1%) |
Income Above Poverty by Sex and Age in Waycross
According to the poverty statistics in Waycross, males aged 15 years and females aged 16 and 17 years are the age groups that are most secure financially, with 100.0% of males and 89.5% of females in these age groups living above the poverty line.
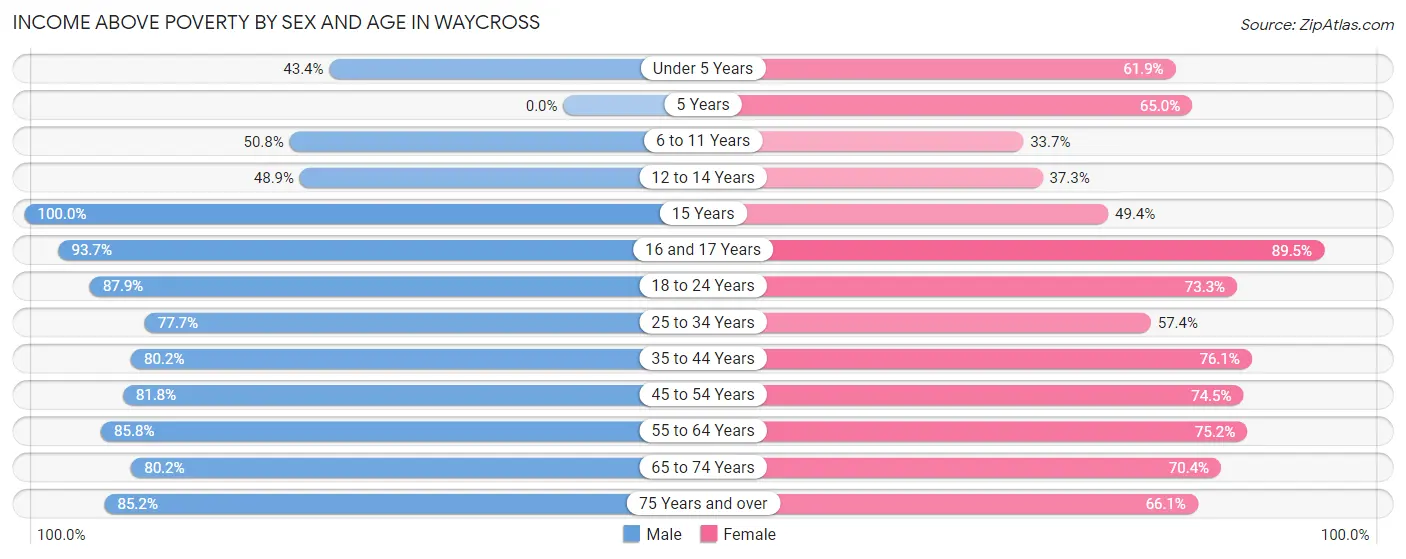
| Age Bracket | Male | Female |
| Under 5 Years | 304 (43.4%) | 278 (61.9%) |
| 5 Years | 0 (0.0%) | 13 (65.0%) |
| 6 to 11 Years | 435 (50.8%) | 259 (33.7%) |
| 12 to 14 Years | 135 (48.9%) | 130 (37.2%) |
| 15 Years | 32 (100.0%) | 43 (49.4%) |
| 16 and 17 Years | 104 (93.7%) | 187 (89.5%) |
| 18 to 24 Years | 355 (87.9%) | 374 (73.3%) |
| 25 to 34 Years | 466 (77.7%) | 733 (57.4%) |
| 35 to 44 Years | 767 (80.2%) | 579 (76.1%) |
| 45 to 54 Years | 372 (81.8%) | 673 (74.5%) |
| 55 to 64 Years | 616 (85.8%) | 562 (75.2%) |
| 65 to 74 Years | 332 (80.2%) | 470 (70.4%) |
| 75 Years and over | 241 (85.2%) | 395 (66.0%) |
| Total | 4,159 (69.0%) | 4,696 (63.9%) |
Income Below Poverty Among Married-Couple Families in Waycross
The poverty statistics for married-couple families in Waycross show that 14.5% or 185 of the total 1,275 families live below the poverty line. Families with 3 or 4 children have the highest poverty rate of 39.9%, comprising of 63 families. On the other hand, families with 1 or 2 children have the lowest poverty rate of 7.1%, which includes 30 families.
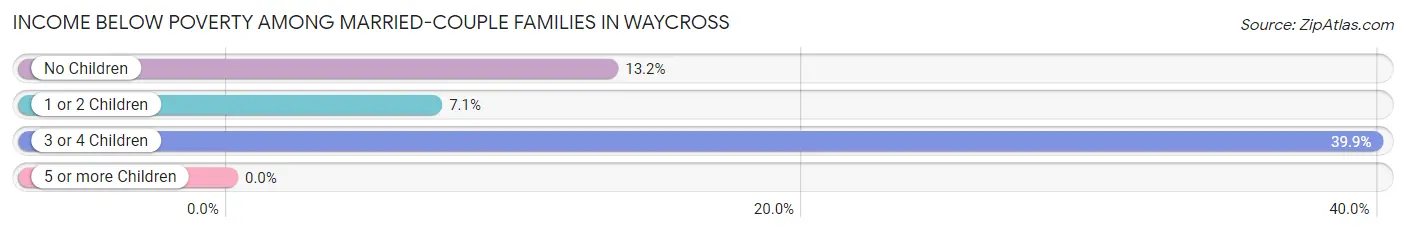
| Children | Above Poverty | Below Poverty |
| No Children | 603 (86.8%) | 92 (13.2%) |
| 1 or 2 Children | 392 (92.9%) | 30 (7.1%) |
| 3 or 4 Children | 95 (60.1%) | 63 (39.9%) |
| 5 or more Children | 0 (0.0%) | 0 (0.0%) |
| Total | 1,090 (85.5%) | 185 (14.5%) |
Income Below Poverty Among Single-Parent Households in Waycross
According to the poverty data in Waycross, 5.0% or 17 single-father households and 45.4% or 542 single-mother households are living below the poverty line. Among single-father households, those with 1 or 2 children have the highest poverty rate, with 17 households (7.2%) experiencing poverty. Likewise, among single-mother households, those with 5 or more children have the highest poverty rate, with 97 households (100.0%) falling below the poverty line.
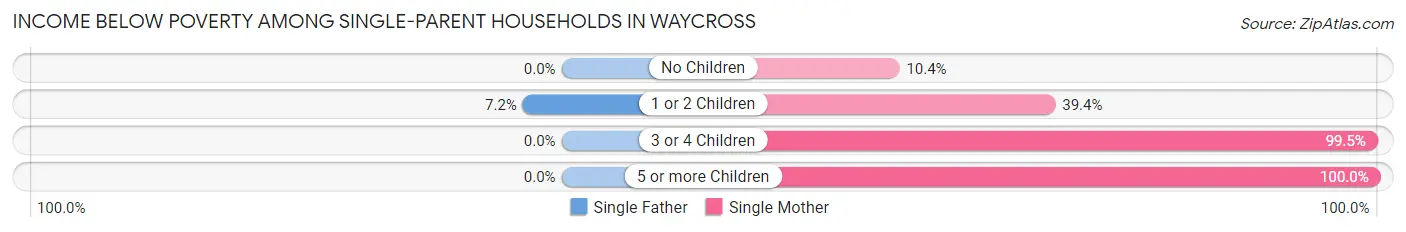
| Children | Single Father | Single Mother |
| No Children | 0 (0.0%) | 35 (10.4%) |
| 1 or 2 Children | 17 (7.2%) | 227 (39.4%) |
| 3 or 4 Children | 0 (0.0%) | 183 (99.5%) |
| 5 or more Children | 0 (0.0%) | 97 (100.0%) |
| Total | 17 (5.0%) | 542 (45.4%) |
Income Below Poverty Among Married-Couple vs Single-Parent Households in Waycross
The poverty data for Waycross shows that 185 of the married-couple family households (14.5%) and 559 of the single-parent households (36.4%) are living below the poverty level. Within the married-couple family households, those with 3 or 4 children have the highest poverty rate, with 63 households (39.9%) falling below the poverty line. Among the single-parent households, those with 5 or more children have the highest poverty rate, with 97 household (100.0%) living below poverty.
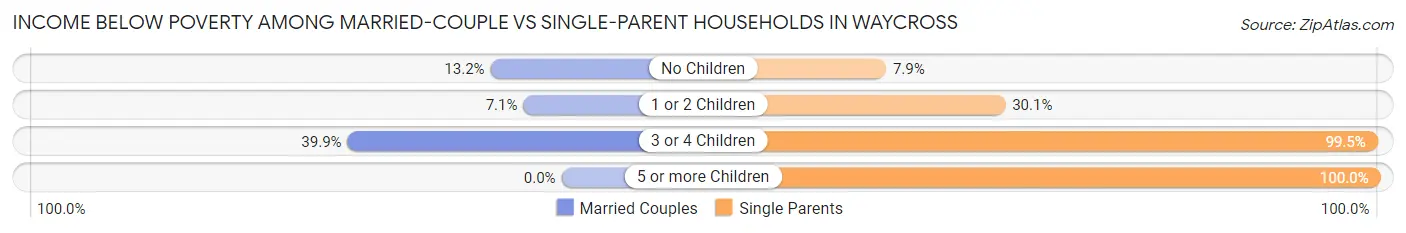
| Children | Married-Couple Families | Single-Parent Households |
| No Children | 92 (13.2%) | 35 (7.9%) |
| 1 or 2 Children | 30 (7.1%) | 244 (30.1%) |
| 3 or 4 Children | 63 (39.9%) | 183 (99.5%) |
| 5 or more Children | 0 (0.0%) | 97 (100.0%) |
| Total | 185 (14.5%) | 559 (36.4%) |
Race in Waycross
The most populous races in Waycross are Black / African American (7,647 | 55.2%), White / Caucasian (5,195 | 37.5%), and Hispanic or Latino (865 | 6.2%).
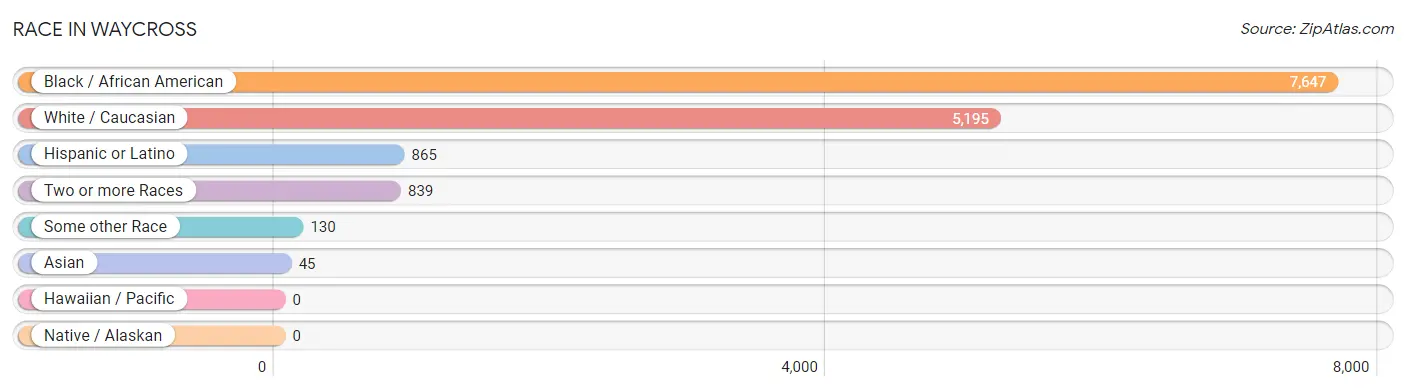
| Race | # Population | % Population |
| Asian | 45 | 0.3% |
| Black / African American | 7,647 | 55.2% |
| Hawaiian / Pacific | 0 | 0.0% |
| Hispanic or Latino | 865 | 6.2% |
| Native / Alaskan | 0 | 0.0% |
| White / Caucasian | 5,195 | 37.5% |
| Two or more Races | 839 | 6.1% |
| Some other Race | 130 | 0.9% |
| Total | 13,856 | 100.0% |
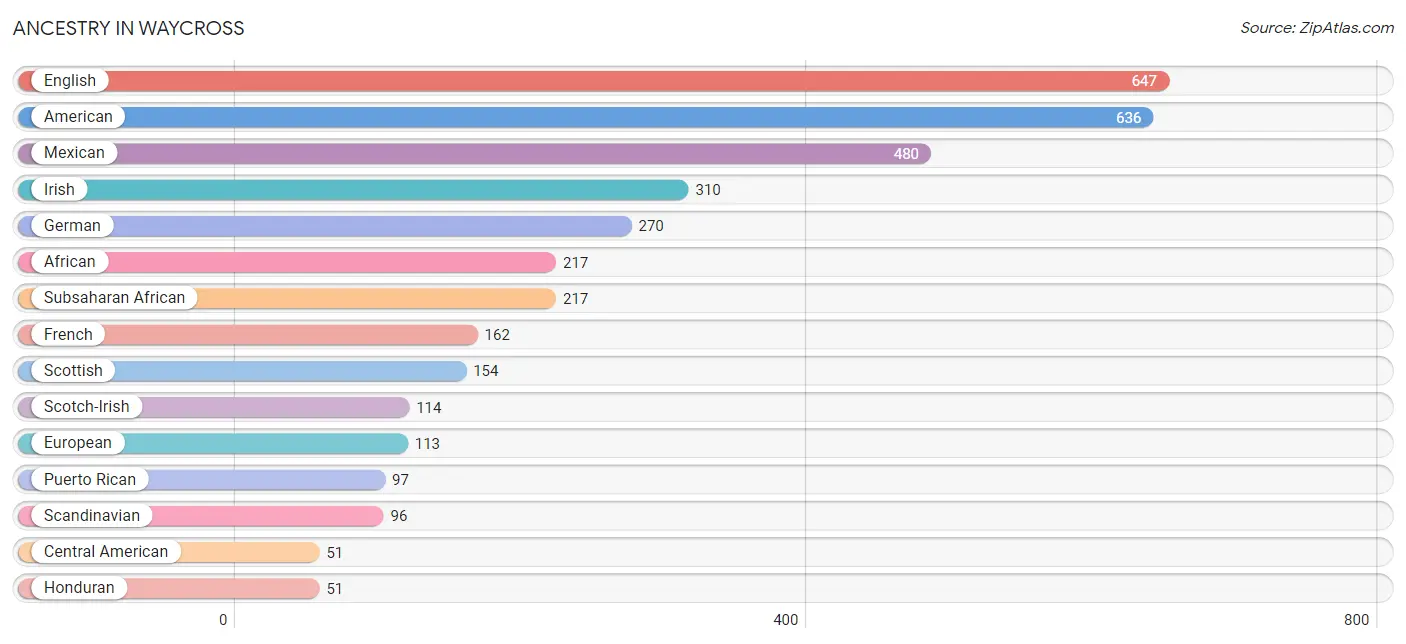
Ancestry in Waycross
The most populous ancestries reported in Waycross are English (647 | 4.7%), American (636 | 4.6%), Mexican (480 | 3.5%), Irish (310 | 2.2%), and German (270 | 1.9%), together accounting for 16.9% of all Waycross residents.
| Ancestry | # Population | % Population |
| African | 217 | 1.6% |
| American | 636 | 4.6% |
| Blackfeet | 10 | 0.1% |
| British | 12 | 0.1% |
| Canadian | 4 | 0.0% |
| Central American | 51 | 0.4% |
| Cherokee | 1 | 0.0% |
| Danish | 16 | 0.1% |
| English | 647 | 4.7% |
| European | 113 | 0.8% |
| French | 162 | 1.2% |
| French Canadian | 22 | 0.2% |
| German | 270 | 1.9% |
| Honduran | 51 | 0.4% |
| Indian (Asian) | 14 | 0.1% |
| Irish | 310 | 2.2% |
| Italian | 30 | 0.2% |
| Korean | 3 | 0.0% |
| Mexican | 480 | 3.5% |
| Mongolian | 12 | 0.1% |
| Northern European | 21 | 0.2% |
| Norwegian | 25 | 0.2% |
| Polish | 18 | 0.1% |
| Puerto Rican | 97 | 0.7% |
| Scandinavian | 96 | 0.7% |
| Scotch-Irish | 114 | 0.8% |
| Scottish | 154 | 1.1% |
| Subsaharan African | 217 | 1.6% |
| Swedish | 13 | 0.1% |
| Thai | 28 | 0.2% |
| Welsh | 34 | 0.3% | View All 31 Rows |
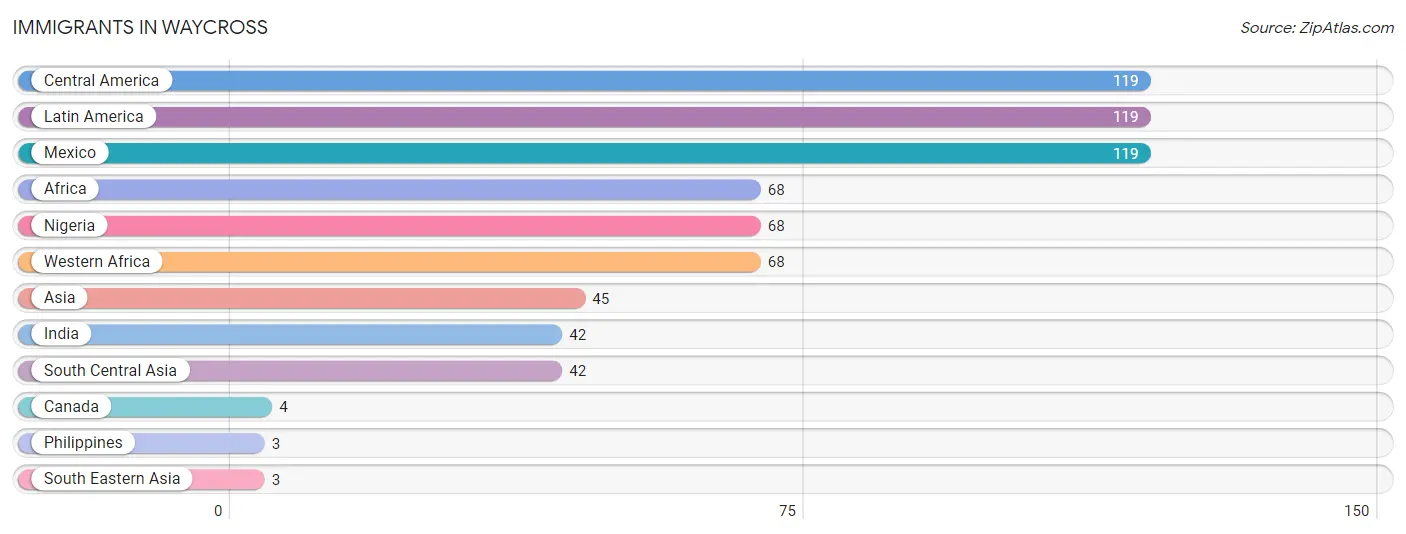
Immigrants in Waycross
The most numerous immigrant groups reported in Waycross came from Central America (119 | 0.9%), Latin America (119 | 0.9%), Mexico (119 | 0.9%), Africa (68 | 0.5%), and Nigeria (68 | 0.5%), together accounting for 3.6% of all Waycross residents.
| Immigration Origin | # Population | % Population |
| Africa | 68 | 0.5% |
| Asia | 45 | 0.3% |
| Canada | 4 | 0.0% |
| Central America | 119 | 0.9% |
| India | 42 | 0.3% |
| Latin America | 119 | 0.9% |
| Mexico | 119 | 0.9% |
| Nigeria | 68 | 0.5% |
| Philippines | 3 | 0.0% |
| South Central Asia | 42 | 0.3% |
| South Eastern Asia | 3 | 0.0% |
| Western Africa | 68 | 0.5% | View All 12 Rows |
Sex and Age in Waycross
Sex and Age in Waycross
The most populous age groups in Waycross are 5 to 9 Years (953 | 15.3%) for men and 10 to 14 Years (725 | 9.5%) for women.
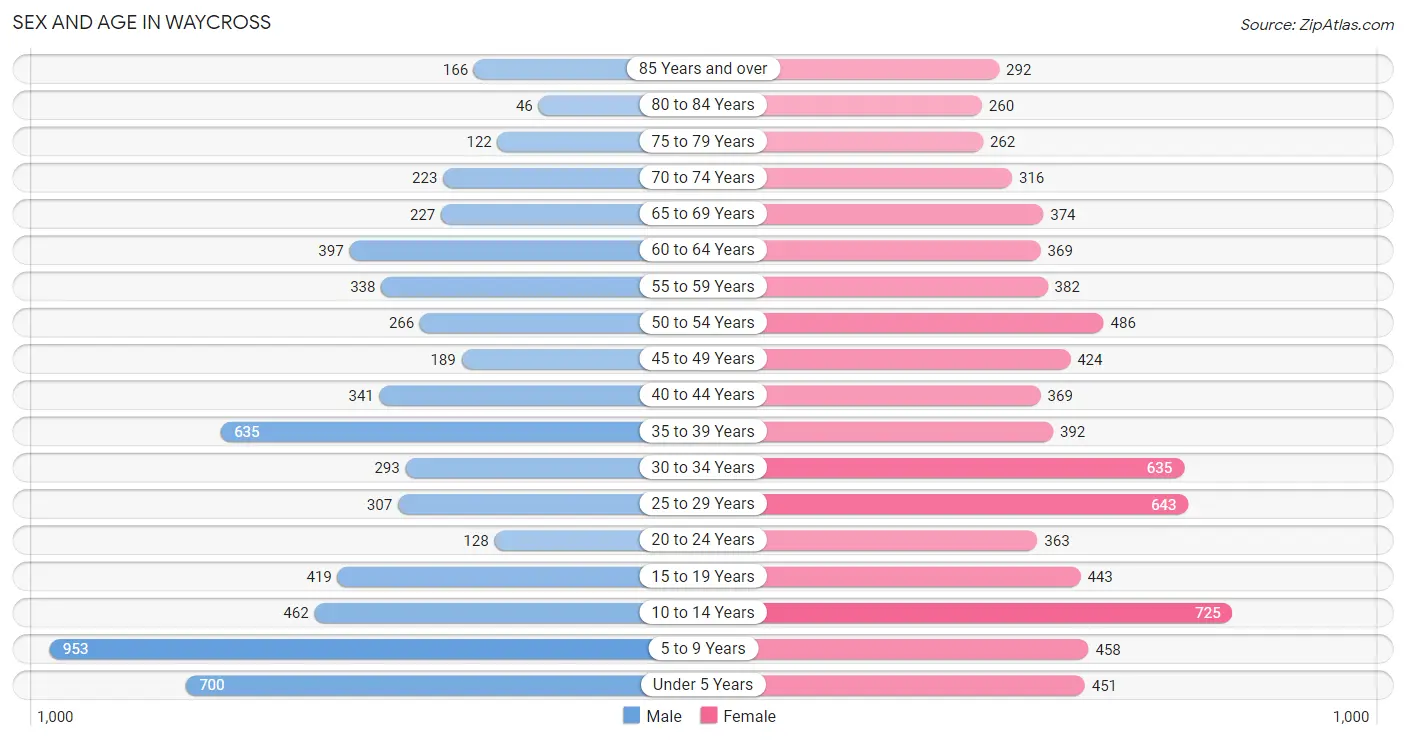
| Age Bracket | Male | Female |
| Under 5 Years | 700 (11.3%) | 451 (5.9%) |
| 5 to 9 Years | 953 (15.3%) | 458 (6.0%) |
| 10 to 14 Years | 462 (7.4%) | 725 (9.5%) |
| 15 to 19 Years | 419 (6.8%) | 443 (5.8%) |
| 20 to 24 Years | 128 (2.1%) | 363 (4.8%) |
| 25 to 29 Years | 307 (4.9%) | 643 (8.4%) |
| 30 to 34 Years | 293 (4.7%) | 635 (8.3%) |
| 35 to 39 Years | 635 (10.2%) | 392 (5.1%) |
| 40 to 44 Years | 341 (5.5%) | 369 (4.8%) |
| 45 to 49 Years | 189 (3.0%) | 424 (5.6%) |
| 50 to 54 Years | 266 (4.3%) | 486 (6.4%) |
| 55 to 59 Years | 338 (5.4%) | 382 (5.0%) |
| 60 to 64 Years | 397 (6.4%) | 369 (4.8%) |
| 65 to 69 Years | 227 (3.6%) | 374 (4.9%) |
| 70 to 74 Years | 223 (3.6%) | 316 (4.1%) |
| 75 to 79 Years | 122 (2.0%) | 262 (3.4%) |
| 80 to 84 Years | 46 (0.7%) | 260 (3.4%) |
| 85 Years and over | 166 (2.7%) | 292 (3.8%) |
| Total | 6,212 (100.0%) | 7,644 (100.0%) |
Families and Households in Waycross
Median Family Size in Waycross
The median family size in Waycross is 3.61 persons per family, with single female/mother families (1,194 | 42.5%) accounting for the largest median family size of 3.99 persons per family. On the other hand, single male/father families (342 | 12.2%) represent the smallest median family size with 2.78 persons per family.
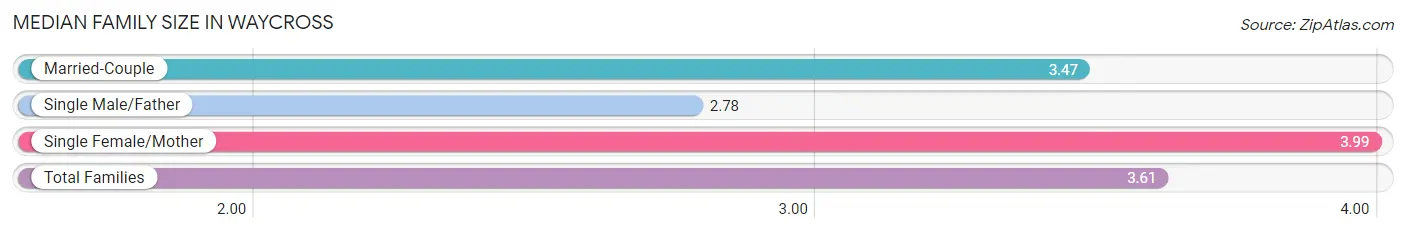
| Family Type | # Families | Family Size |
| Married-Couple | 1,275 (45.4%) | 3.47 |
| Single Male/Father | 342 (12.2%) | 2.78 |
| Single Female/Mother | 1,194 (42.5%) | 3.99 |
| Total Families | 2,811 (100.0%) | 3.61 |
Median Household Size in Waycross
The median household size in Waycross is 2.53 persons per household, with single female/mother households (1,194 | 22.5%) accounting for the largest median household size of 4.27 persons per household. non-family households (2,489 | 47.0%) represent the smallest median household size with 1.11 persons per household.
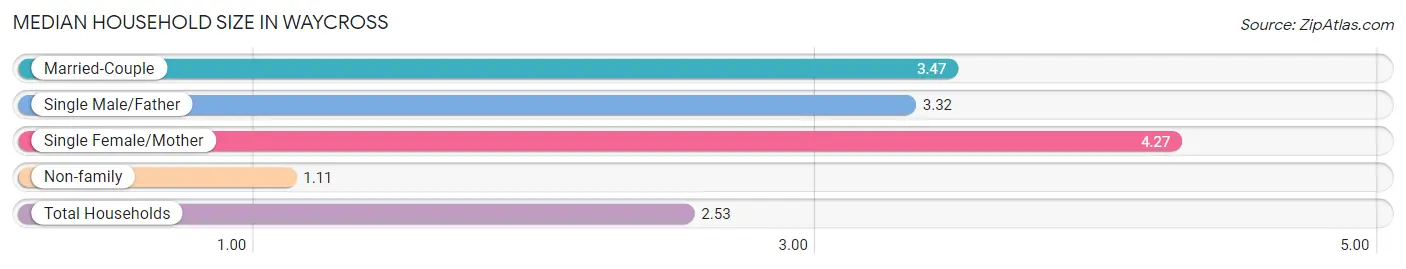
| Household Type | # Households | Household Size |
| Married-Couple | 1,275 (24.1%) | 3.47 |
| Single Male/Father | 342 (6.5%) | 3.32 |
| Single Female/Mother | 1,194 (22.5%) | 4.27 |
| Non-family | 2,489 (47.0%) | 1.11 |
| Total Households | 5,300 (100.0%) | 2.53 |
Household Size by Marriage Status in Waycross
Out of a total of 5,300 households in Waycross, 2,811 (53.0%) are family households, while 2,489 (47.0%) are nonfamily households. The most numerous type of family households are 2-person households, comprising 1,125, and the most common type of nonfamily households are 1-person households, comprising 2,283.
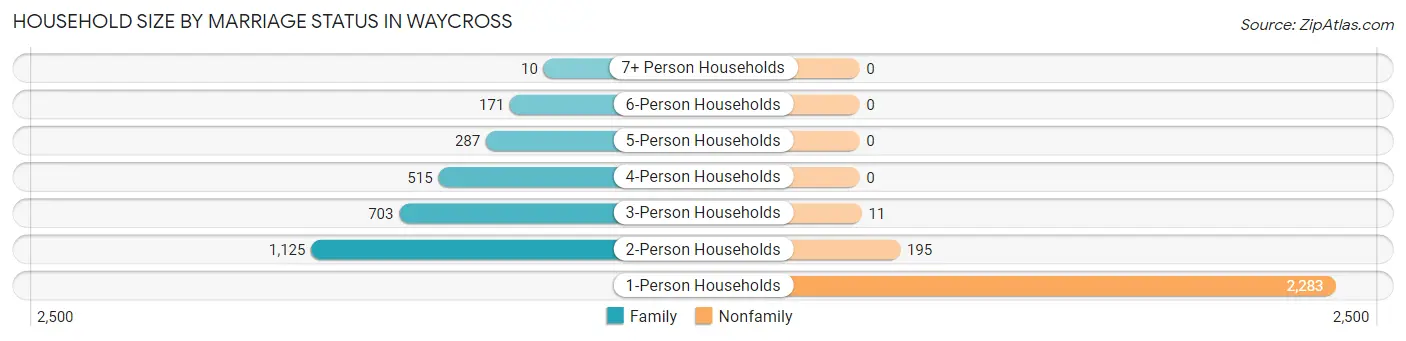
| Household Size | Family Households | Nonfamily Households |
| 1-Person Households | - | 2,283 (43.1%) |
| 2-Person Households | 1,125 (21.2%) | 195 (3.7%) |
| 3-Person Households | 703 (13.3%) | 11 (0.2%) |
| 4-Person Households | 515 (9.7%) | 0 (0.0%) |
| 5-Person Households | 287 (5.4%) | 0 (0.0%) |
| 6-Person Households | 171 (3.2%) | 0 (0.0%) |
| 7+ Person Households | 10 (0.2%) | 0 (0.0%) |
| Total | 2,811 (53.0%) | 2,489 (47.0%) |
Female Fertility in Waycross
Fertility by Age in Waycross
Average fertility rate in Waycross is 119.0 births per 1,000 women. Women in the age bracket of 20 to 34 years have the highest fertility rate with 222.0 births per 1,000 women. Women in the age bracket of 20 to 34 years acount for 92.6% of all women with births.
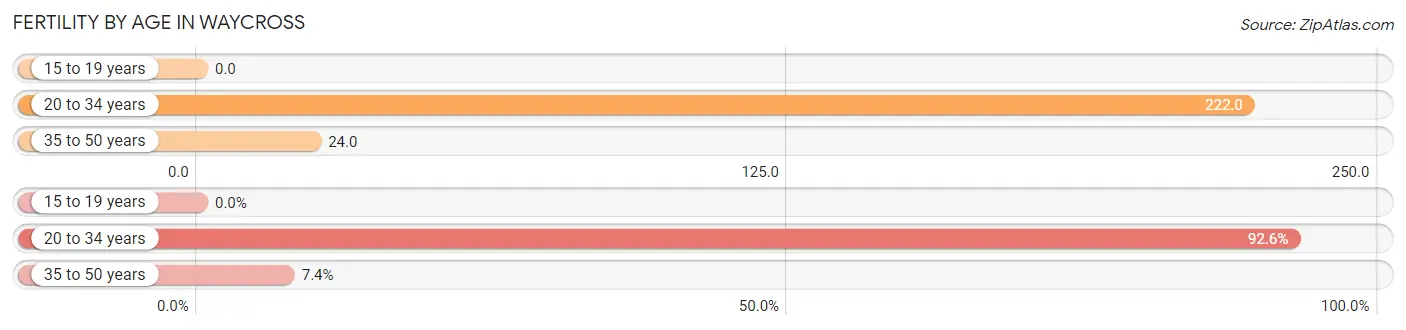
| Age Bracket | Women with Births | Births / 1,000 Women |
| 15 to 19 years | 0 (0.0%) | 0.0 |
| 20 to 34 years | 365 (92.6%) | 222.0 |
| 35 to 50 years | 29 (7.4%) | 24.0 |
| Total | 394 (100.0%) | 119.0 |
Fertility by Age by Marriage Status in Waycross
22.8% of women with births (394) in Waycross are married. The highest percentage of unmarried women with births falls into 20 to 34 years age bracket with 83.3% of them unmarried at the time of birth, while the lowest percentage of unmarried women with births belong to 35 to 50 years age bracket with 0.0% of them unmarried.
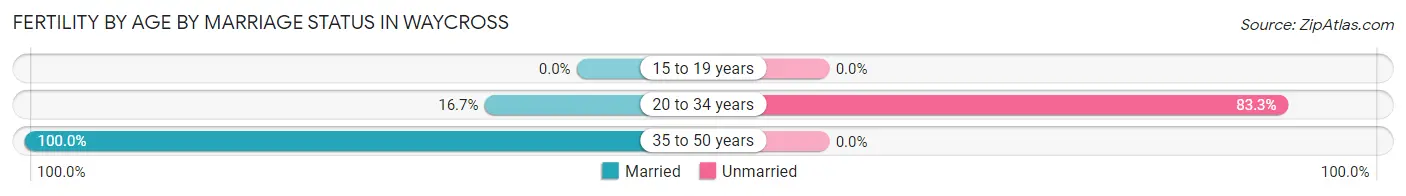
| Age Bracket | Married | Unmarried |
| 15 to 19 years | 0 (0.0%) | 0 (0.0%) |
| 20 to 34 years | 61 (16.7%) | 304 (83.3%) |
| 35 to 50 years | 29 (100.0%) | 0 (0.0%) |
| Total | 90 (22.8%) | 304 (77.2%) |
Fertility by Education in Waycross
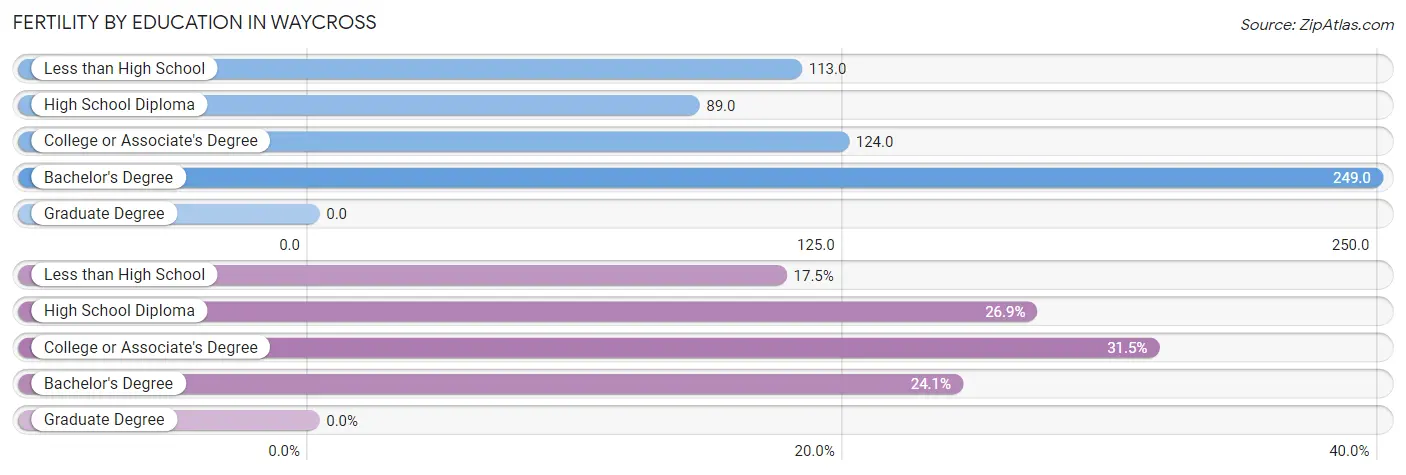
| Educational Attainment | Women with Births | Births / 1,000 Women |
| Less than High School | 69 (17.5%) | 113.0 |
| High School Diploma | 106 (26.9%) | 89.0 |
| College or Associate's Degree | 124 (31.5%) | 124.0 |
| Bachelor's Degree | 95 (24.1%) | 249.0 |
| Graduate Degree | 0 (0.0%) | 0.0 |
| Total | 394 (100.0%) | 119.0 |
Fertility by Education by Marriage Status in Waycross
77.2% of women with births in Waycross are unmarried. Women with the educational attainment of college or associate's degree are most likely to be married with 64.5% of them married at childbirth, while women with the educational attainment of high school diploma are least likely to be married with 100.0% of them unmarried at childbirth.
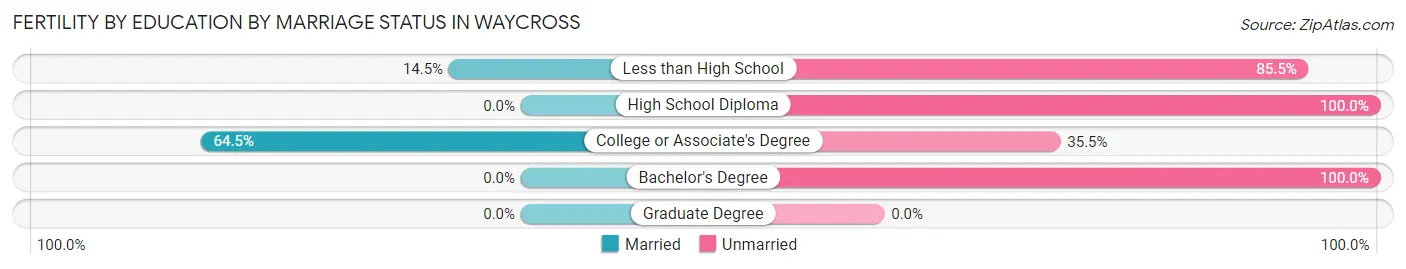
| Educational Attainment | Married | Unmarried |
| Less than High School | 10 (14.5%) | 59 (85.5%) |
| High School Diploma | 0 (0.0%) | 106 (100.0%) |
| College or Associate's Degree | 80 (64.5%) | 44 (35.5%) |
| Bachelor's Degree | 0 (0.0%) | 95 (100.0%) |
| Graduate Degree | 0 (0.0%) | 0 (0.0%) |
| Total | 90 (22.8%) | 304 (77.2%) |
Employment Characteristics in Waycross
Employment by Class of Employer in Waycross
Among the 4,347 employed individuals in Waycross, private company employees (3,103 | 71.4%), state government employees (618 | 14.2%), and self-employed (not incorporated) (152 | 3.5%) make up the most common classes of employment.
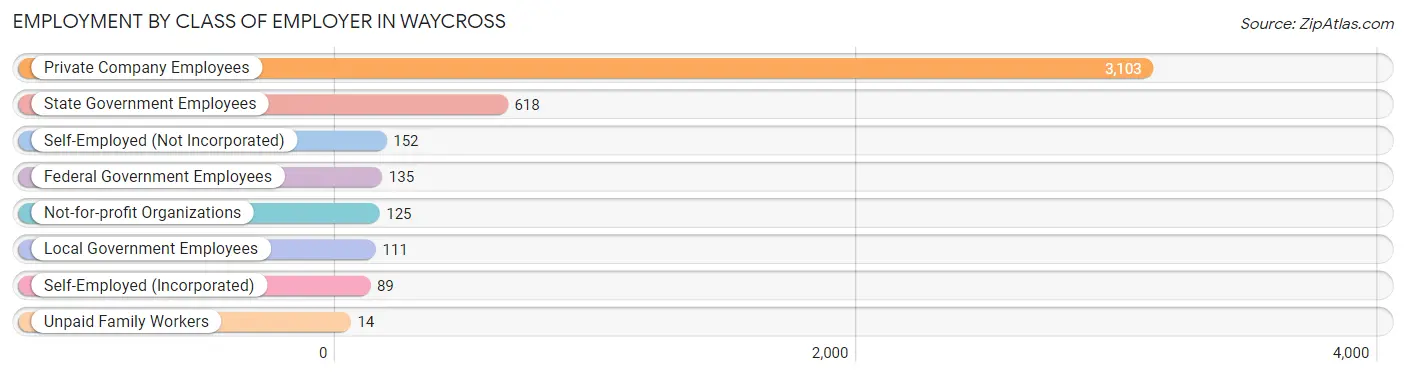
| Employer Class | # Employees | % Employees |
| Private Company Employees | 3,103 | 71.4% |
| Self-Employed (Incorporated) | 89 | 2.1% |
| Self-Employed (Not Incorporated) | 152 | 3.5% |
| Not-for-profit Organizations | 125 | 2.9% |
| Local Government Employees | 111 | 2.5% |
| State Government Employees | 618 | 14.2% |
| Federal Government Employees | 135 | 3.1% |
| Unpaid Family Workers | 14 | 0.3% |
| Total | 4,347 | 100.0% |
Employment Status by Age in Waycross
According to the labor force statistics for Waycross, out of the total population over 16 years of age (9,988), 47.5% or 4,744 individuals are in the labor force, with 6.5% or 308 of them unemployed. The age group with the highest labor force participation rate is 35 to 44 years, with 76.1% or 1,322 individuals in the labor force. Within the labor force, the 20 to 24 years age range has the highest percentage of unemployed individuals, with 15.0% or 48 of them being unemployed.
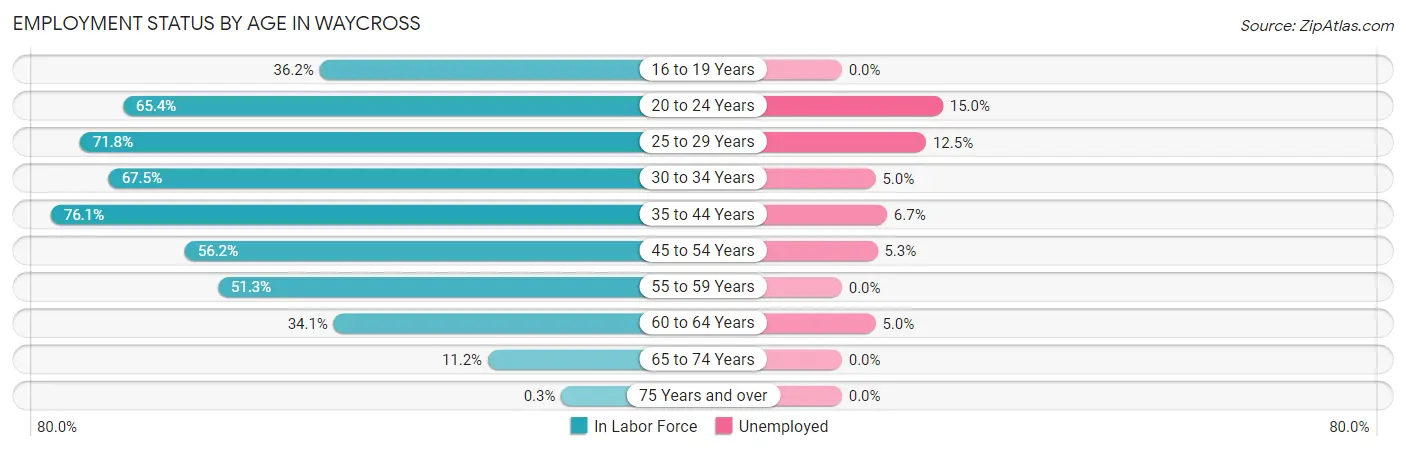
| Age Bracket | In Labor Force | Unemployed |
| 16 to 19 Years | 269 (36.2%) | 0 (0.0%) |
| 20 to 24 Years | 321 (65.4%) | 48 (15.0%) |
| 25 to 29 Years | 682 (71.8%) | 85 (12.5%) |
| 30 to 34 Years | 626 (67.5%) | 31 (5.0%) |
| 35 to 44 Years | 1,322 (76.1%) | 89 (6.7%) |
| 45 to 54 Years | 767 (56.2%) | 41 (5.3%) |
| 55 to 59 Years | 369 (51.3%) | 0 (0.0%) |
| 60 to 64 Years | 261 (34.1%) | 13 (5.0%) |
| 65 to 74 Years | 128 (11.2%) | 0 (0.0%) |
| 75 Years and over | 3 (0.3%) | 0 (0.0%) |
| Total | 4,744 (47.5%) | 308 (6.5%) |
Employment Status by Educational Attainment in Waycross
According to labor force statistics for Waycross, 62.3% of individuals (4,028) out of the total population between 25 and 64 years of age (6,466) are in the labor force, with 6.4% or 258 of them being unemployed. The group with the highest labor force participation rate are those with the educational attainment of bachelor's degree or higher, with 82.8% or 1,004 individuals in the labor force. Within the labor force, individuals with college / associate degree education have the highest percentage of unemployment, with 7.1% or 84 of them being unemployed.
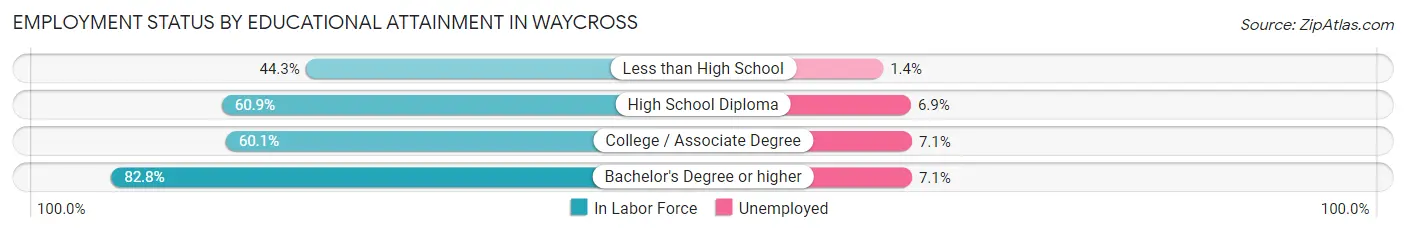
| Educational Attainment | In Labor Force | Unemployed |
| Less than High School | 428 (44.3%) | 14 (1.4%) |
| High School Diploma | 1,413 (60.9%) | 160 (6.9%) |
| College / Associate Degree | 1,183 (60.1%) | 140 (7.1%) |
| Bachelor's Degree or higher | 1,004 (82.8%) | 86 (7.1%) |
| Total | 4,028 (62.3%) | 414 (6.4%) |
Employment Occupations by Sex in Waycross
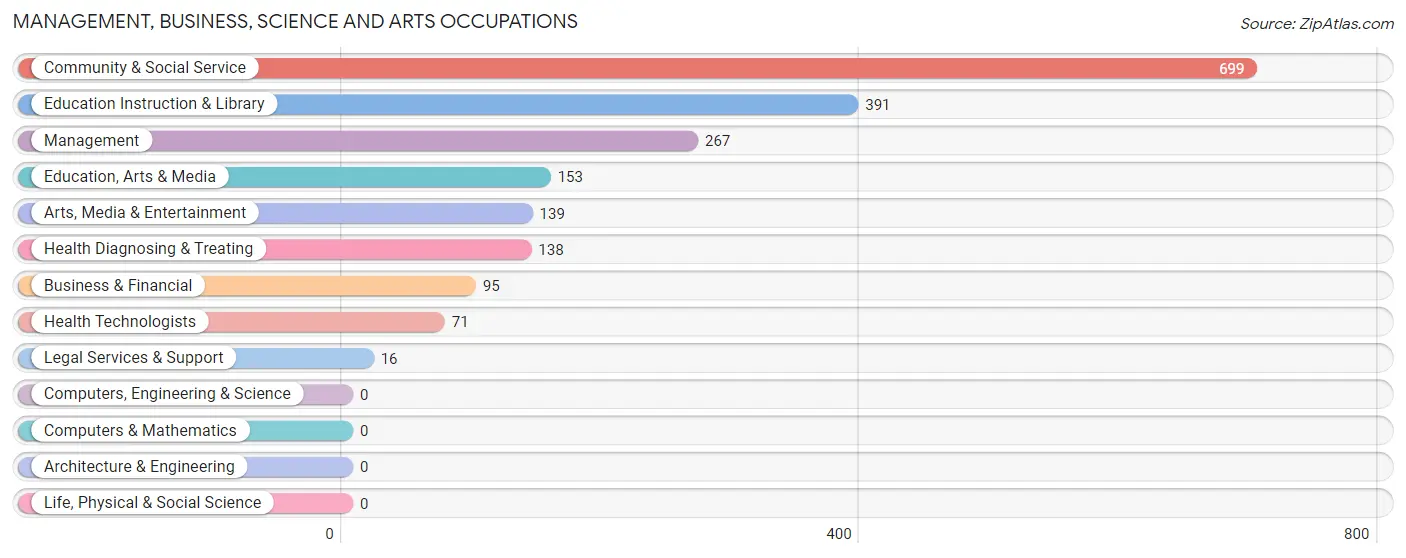
Management, Business, Science and Arts Occupations
The most common Management, Business, Science and Arts occupations in Waycross are Community & Social Service (699 | 15.7%), Education Instruction & Library (391 | 8.8%), Management (267 | 6.0%), Education, Arts & Media (153 | 3.5%), and Arts, Media & Entertainment (139 | 3.1%).
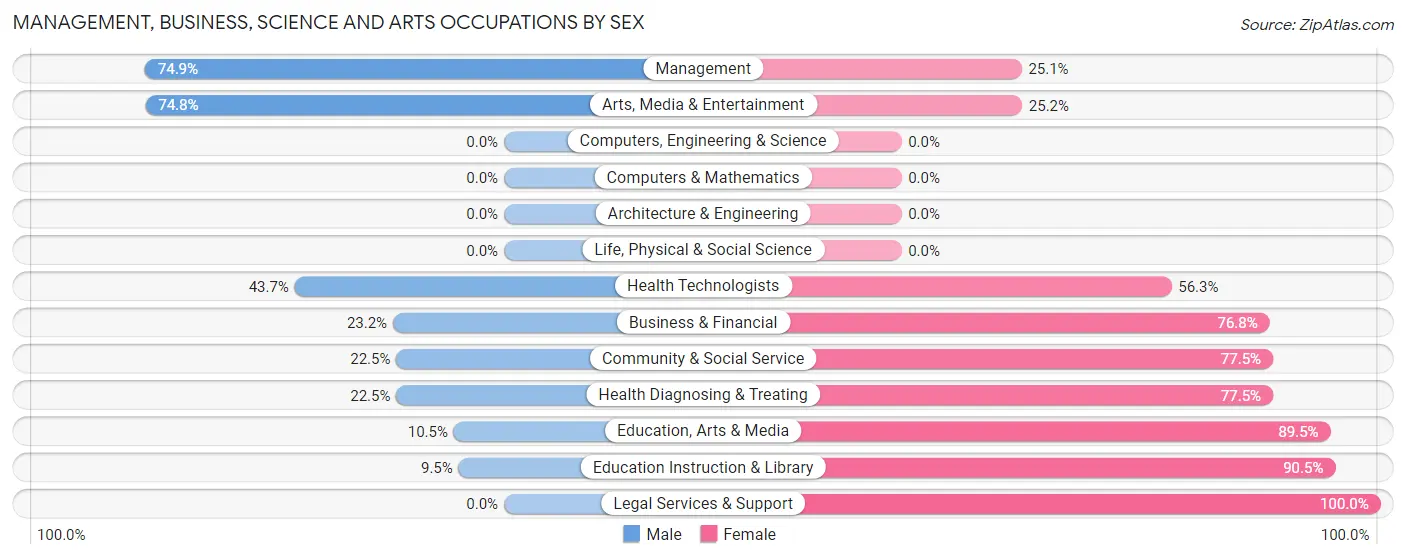
Management, Business, Science and Arts Occupations by Sex
Within the Management, Business, Science and Arts occupations in Waycross, the most male-oriented occupations are Management (74.9%), Arts, Media & Entertainment (74.8%), and Health Technologists (43.7%), while the most female-oriented occupations are Legal Services & Support (100.0%), Education Instruction & Library (90.5%), and Education, Arts & Media (89.5%).
| Occupation | Male | Female |
| Management | 200 (74.9%) | 67 (25.1%) |
| Business & Financial | 22 (23.2%) | 73 (76.8%) |
| Computers, Engineering & Science | 0 (0.0%) | 0 (0.0%) |
| Computers & Mathematics | 0 (0.0%) | 0 (0.0%) |
| Architecture & Engineering | 0 (0.0%) | 0 (0.0%) |
| Life, Physical & Social Science | 0 (0.0%) | 0 (0.0%) |
| Community & Social Service | 157 (22.5%) | 542 (77.5%) |
| Education, Arts & Media | 16 (10.5%) | 137 (89.5%) |
| Legal Services & Support | 0 (0.0%) | 16 (100.0%) |
| Education Instruction & Library | 37 (9.5%) | 354 (90.5%) |
| Arts, Media & Entertainment | 104 (74.8%) | 35 (25.2%) |
| Health Diagnosing & Treating | 31 (22.5%) | 107 (77.5%) |
| Health Technologists | 31 (43.7%) | 40 (56.3%) |
| Total (Category) | 410 (34.2%) | 789 (65.8%) |
| Total (Overall) | 2,120 (47.7%) | 2,321 (52.3%) |
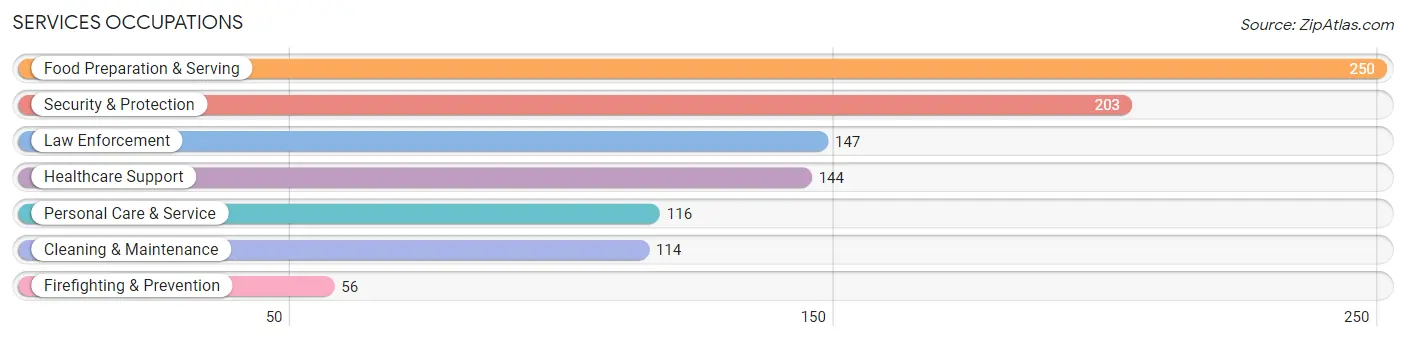
Services Occupations
The most common Services occupations in Waycross are Food Preparation & Serving (250 | 5.6%), Security & Protection (203 | 4.6%), Law Enforcement (147 | 3.3%), Healthcare Support (144 | 3.2%), and Personal Care & Service (116 | 2.6%).
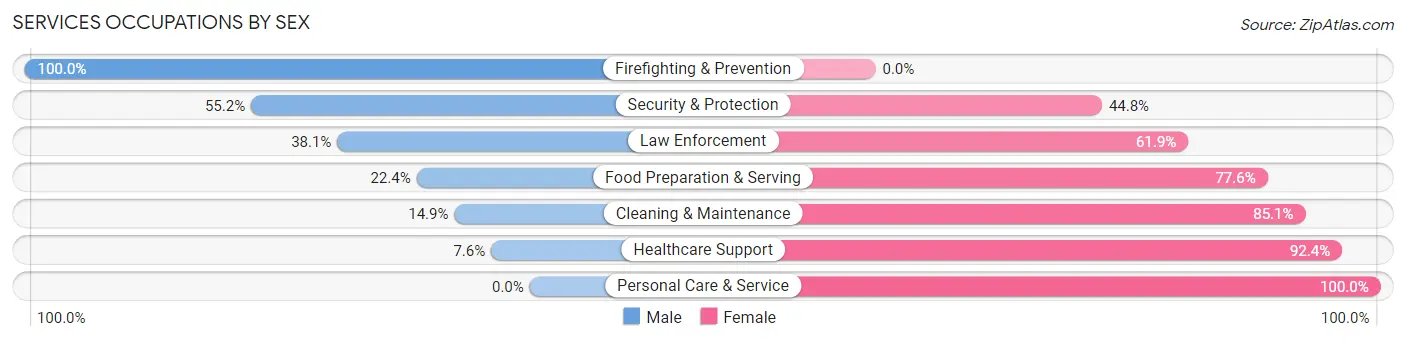
Services Occupations by Sex
Within the Services occupations in Waycross, the most male-oriented occupations are Firefighting & Prevention (100.0%), Security & Protection (55.2%), and Law Enforcement (38.1%), while the most female-oriented occupations are Personal Care & Service (100.0%), Healthcare Support (92.4%), and Cleaning & Maintenance (85.1%).
| Occupation | Male | Female |
| Healthcare Support | 11 (7.6%) | 133 (92.4%) |
| Security & Protection | 112 (55.2%) | 91 (44.8%) |
| Firefighting & Prevention | 56 (100.0%) | 0 (0.0%) |
| Law Enforcement | 56 (38.1%) | 91 (61.9%) |
| Food Preparation & Serving | 56 (22.4%) | 194 (77.6%) |
| Cleaning & Maintenance | 17 (14.9%) | 97 (85.1%) |
| Personal Care & Service | 0 (0.0%) | 116 (100.0%) |
| Total (Category) | 196 (23.7%) | 631 (76.3%) |
| Total (Overall) | 2,120 (47.7%) | 2,321 (52.3%) |
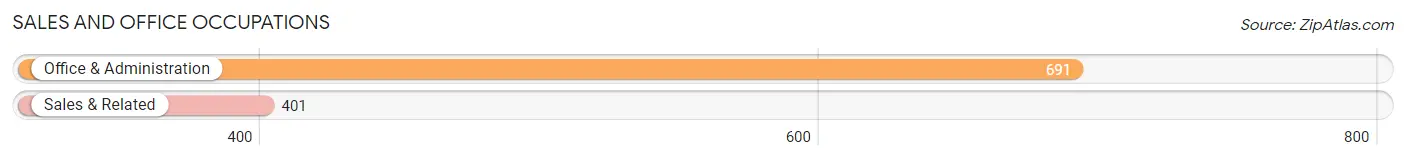
Sales and Office Occupations
The most common Sales and Office occupations in Waycross are Office & Administration (691 | 15.6%), and Sales & Related (401 | 9.0%).
Sales and Office Occupations by Sex
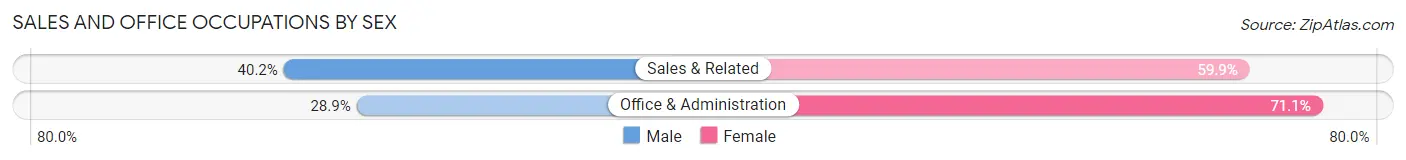
| Occupation | Male | Female |
| Sales & Related | 161 (40.2%) | 240 (59.9%) |
| Office & Administration | 200 (28.9%) | 491 (71.1%) |
| Total (Category) | 361 (33.1%) | 731 (66.9%) |
| Total (Overall) | 2,120 (47.7%) | 2,321 (52.3%) |
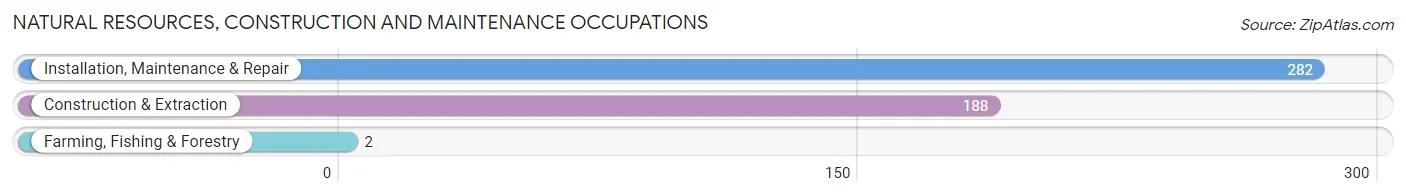
Natural Resources, Construction and Maintenance Occupations
The most common Natural Resources, Construction and Maintenance occupations in Waycross are Installation, Maintenance & Repair (282 | 6.4%), Construction & Extraction (188 | 4.2%), and Farming, Fishing & Forestry (2 | 0.1%).
Natural Resources, Construction and Maintenance Occupations by Sex
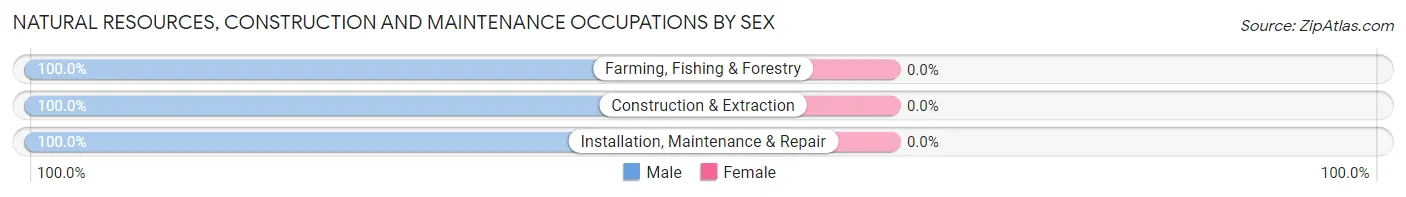
| Occupation | Male | Female |
| Farming, Fishing & Forestry | 2 (100.0%) | 0 (0.0%) |
| Construction & Extraction | 188 (100.0%) | 0 (0.0%) |
| Installation, Maintenance & Repair | 282 (100.0%) | 0 (0.0%) |
| Total (Category) | 472 (100.0%) | 0 (0.0%) |
| Total (Overall) | 2,120 (47.7%) | 2,321 (52.3%) |
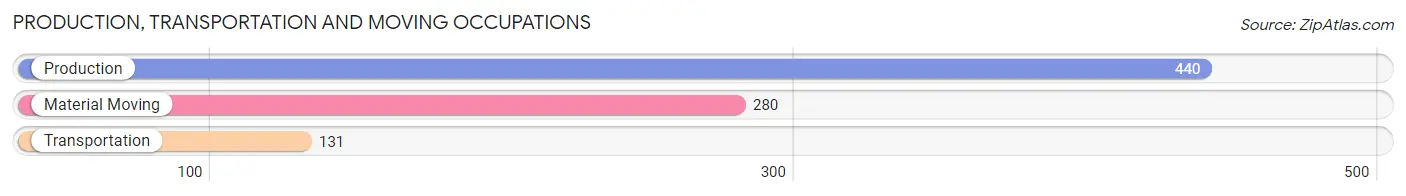
Production, Transportation and Moving Occupations
The most common Production, Transportation and Moving occupations in Waycross are Production (440 | 9.9%), Material Moving (280 | 6.3%), and Transportation (131 | 2.9%).
Production, Transportation and Moving Occupations by Sex
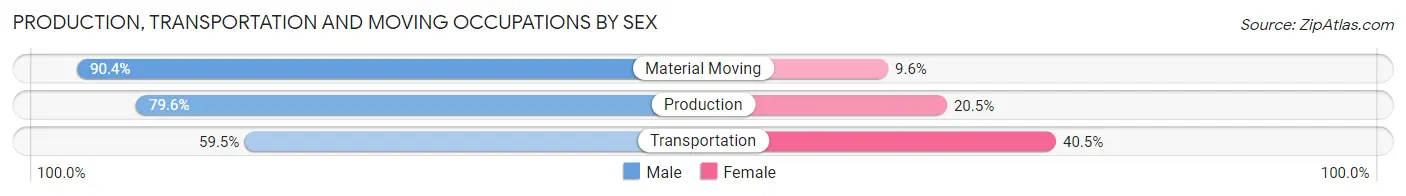
| Occupation | Male | Female |
| Production | 350 (79.5%) | 90 (20.4%) |
| Transportation | 78 (59.5%) | 53 (40.5%) |
| Material Moving | 253 (90.4%) | 27 (9.6%) |
| Total (Category) | 681 (80.0%) | 170 (20.0%) |
| Total (Overall) | 2,120 (47.7%) | 2,321 (52.3%) |
Employment Industries by Sex in Waycross
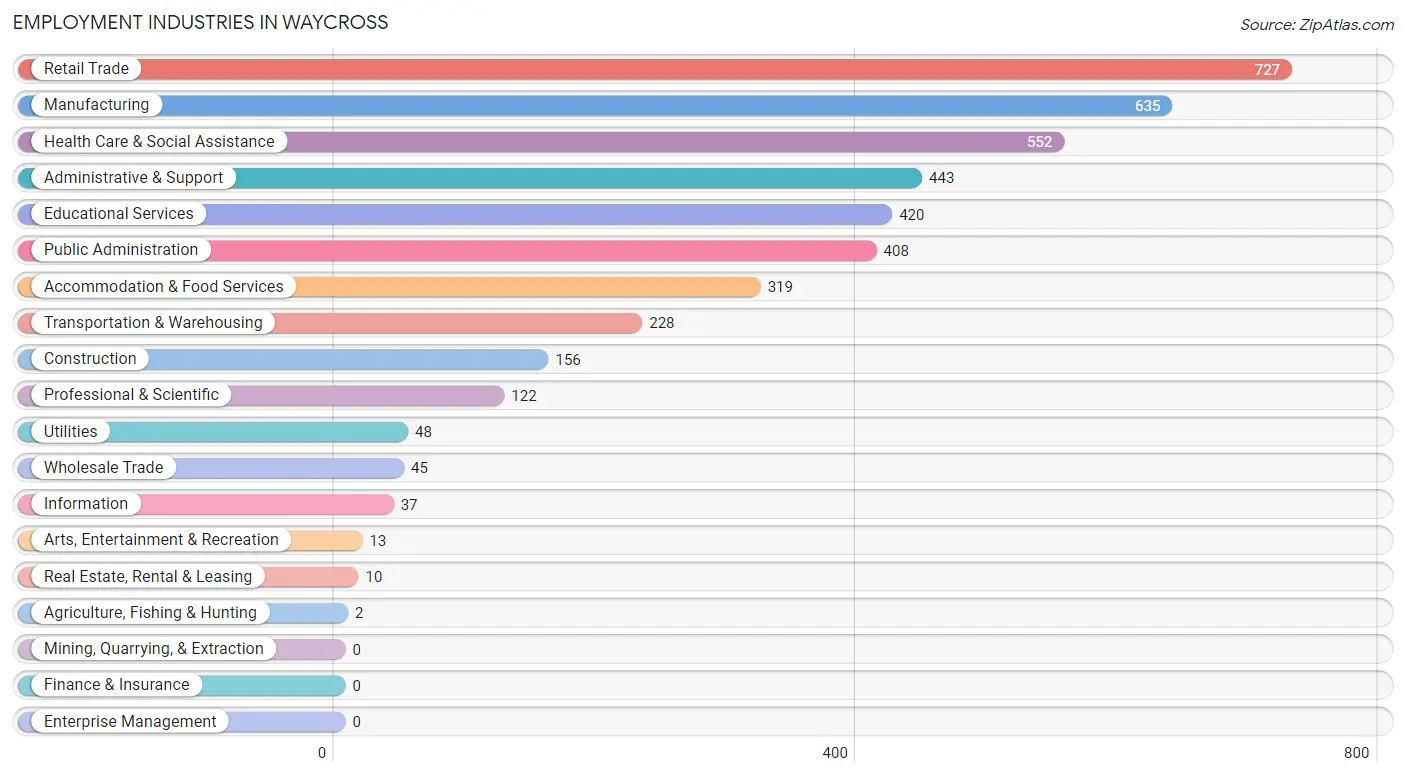
Employment Industries in Waycross
The major employment industries in Waycross include Retail Trade (727 | 16.4%), Manufacturing (635 | 14.3%), Health Care & Social Assistance (552 | 12.4%), Administrative & Support (443 | 10.0%), and Educational Services (420 | 9.5%).
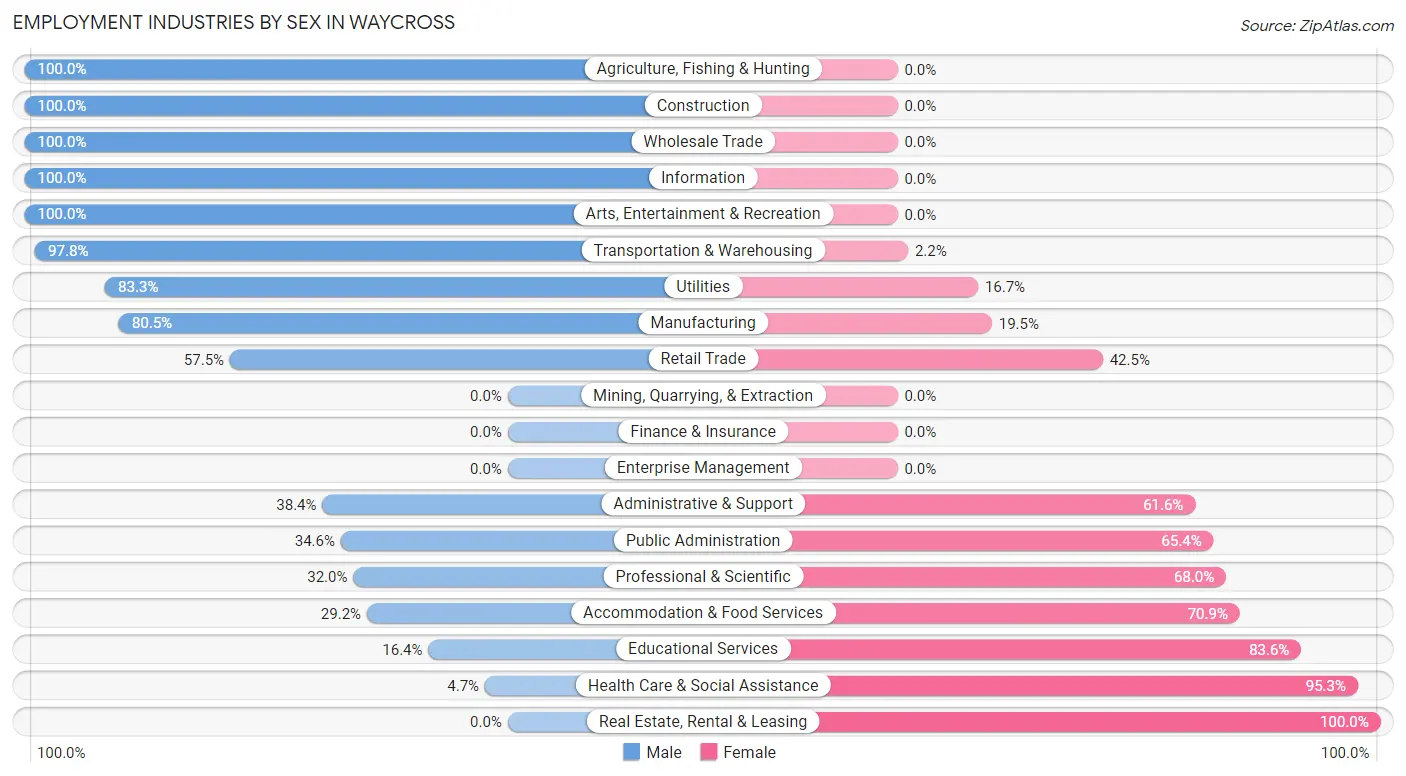
Employment Industries by Sex in Waycross
The Waycross industries that see more men than women are Agriculture, Fishing & Hunting (100.0%), Construction (100.0%), and Wholesale Trade (100.0%), whereas the industries that tend to have a higher number of women are Real Estate, Rental & Leasing (100.0%), Health Care & Social Assistance (95.3%), and Educational Services (83.6%).
| Industry | Male | Female |
| Agriculture, Fishing & Hunting | 2 (100.0%) | 0 (0.0%) |
| Mining, Quarrying, & Extraction | 0 (0.0%) | 0 (0.0%) |
| Construction | 156 (100.0%) | 0 (0.0%) |
| Manufacturing | 511 (80.5%) | 124 (19.5%) |
| Wholesale Trade | 45 (100.0%) | 0 (0.0%) |
| Retail Trade | 418 (57.5%) | 309 (42.5%) |
| Transportation & Warehousing | 223 (97.8%) | 5 (2.2%) |
| Utilities | 40 (83.3%) | 8 (16.7%) |
| Information | 37 (100.0%) | 0 (0.0%) |
| Finance & Insurance | 0 (0.0%) | 0 (0.0%) |
| Real Estate, Rental & Leasing | 0 (0.0%) | 10 (100.0%) |
| Professional & Scientific | 39 (32.0%) | 83 (68.0%) |
| Enterprise Management | 0 (0.0%) | 0 (0.0%) |
| Administrative & Support | 170 (38.4%) | 273 (61.6%) |
| Educational Services | 69 (16.4%) | 351 (83.6%) |
| Health Care & Social Assistance | 26 (4.7%) | 526 (95.3%) |
| Arts, Entertainment & Recreation | 13 (100.0%) | 0 (0.0%) |
| Accommodation & Food Services | 93 (29.1%) | 226 (70.9%) |
| Public Administration | 141 (34.6%) | 267 (65.4%) |
| Total | 2,120 (47.7%) | 2,321 (52.3%) |
Education in Waycross
School Enrollment in Waycross
The most common levels of schooling among the 3,424 students in Waycross are elementary school (1,347 | 39.3%), middle school (837 | 24.4%), and high school (451 | 13.2%).
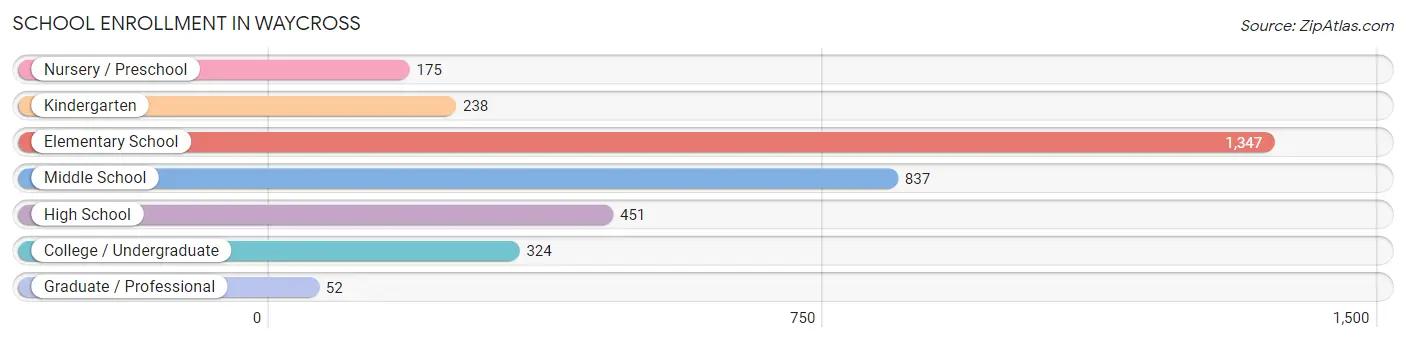
| School Level | # Students | % Students |
| Nursery / Preschool | 175 | 5.1% |
| Kindergarten | 238 | 7.0% |
| Elementary School | 1,347 | 39.3% |
| Middle School | 837 | 24.4% |
| High School | 451 | 13.2% |
| College / Undergraduate | 324 | 9.5% |
| Graduate / Professional | 52 | 1.5% |
| Total | 3,424 | 100.0% |
School Enrollment by Age by Funding Source in Waycross
Out of a total of 3,424 students who are enrolled in schools in Waycross, 325 (9.5%) attend a private institution, while the remaining 3,099 (90.5%) are enrolled in public schools. The age group of 18 to 19 year olds has the highest likelihood of being enrolled in private schools, with 34 (50.0% in the age bracket) enrolled. Conversely, the age group of 15 to 17 year olds has the lowest likelihood of being enrolled in a private school, with 402 (98.3% in the age bracket) attending a public institution.
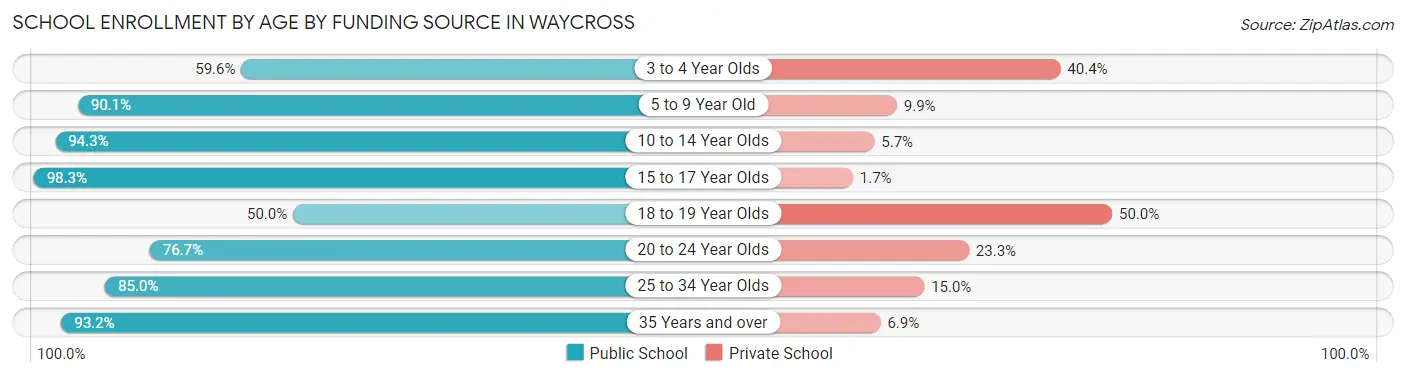
| Age Bracket | Public School | Private School |
| 3 to 4 Year Olds | 65 (59.6%) | 44 (40.4%) |
| 5 to 9 Year Old | 1,246 (90.1%) | 137 (9.9%) |
| 10 to 14 Year Olds | 1,074 (94.3%) | 65 (5.7%) |
| 15 to 17 Year Olds | 402 (98.3%) | 7 (1.7%) |
| 18 to 19 Year Olds | 34 (50.0%) | 34 (50.0%) |
| 20 to 24 Year Olds | 23 (76.7%) | 7 (23.3%) |
| 25 to 34 Year Olds | 119 (85.0%) | 21 (15.0%) |
| 35 Years and over | 136 (93.1%) | 10 (6.9%) |
| Total | 3,099 (90.5%) | 325 (9.5%) |
Educational Attainment by Field of Study in Waycross
Business (453 | 27.2%), education (453 | 27.2%), psychology (161 | 9.7%), science & technology (96 | 5.8%), and visual & performing arts (94 | 5.6%) are the most common fields of study among 1,666 individuals in Waycross who have obtained a bachelor's degree or higher.
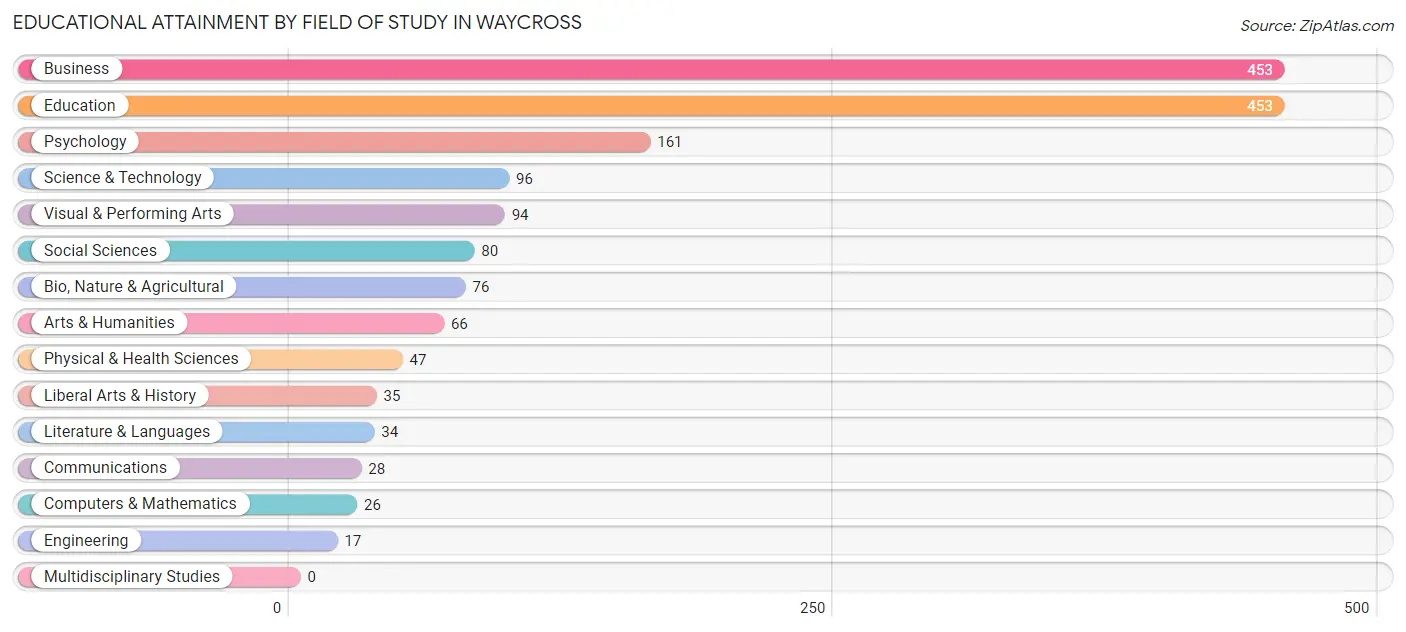
| Field of Study | # Graduates | % Graduates |
| Computers & Mathematics | 26 | 1.6% |
| Bio, Nature & Agricultural | 76 | 4.6% |
| Physical & Health Sciences | 47 | 2.8% |
| Psychology | 161 | 9.7% |
| Social Sciences | 80 | 4.8% |
| Engineering | 17 | 1.0% |
| Multidisciplinary Studies | 0 | 0.0% |
| Science & Technology | 96 | 5.8% |
| Business | 453 | 27.2% |
| Education | 453 | 27.2% |
| Literature & Languages | 34 | 2.0% |
| Liberal Arts & History | 35 | 2.1% |
| Visual & Performing Arts | 94 | 5.6% |
| Communications | 28 | 1.7% |
| Arts & Humanities | 66 | 4.0% |
| Total | 1,666 | 100.0% |
Transportation & Commute in Waycross
Vehicle Availability by Sex in Waycross
The most prevalent vehicle ownership categories in Waycross are males with 2 vehicles (971, accounting for 47.5%) and females with 2 vehicles (880, making up 42.3%).
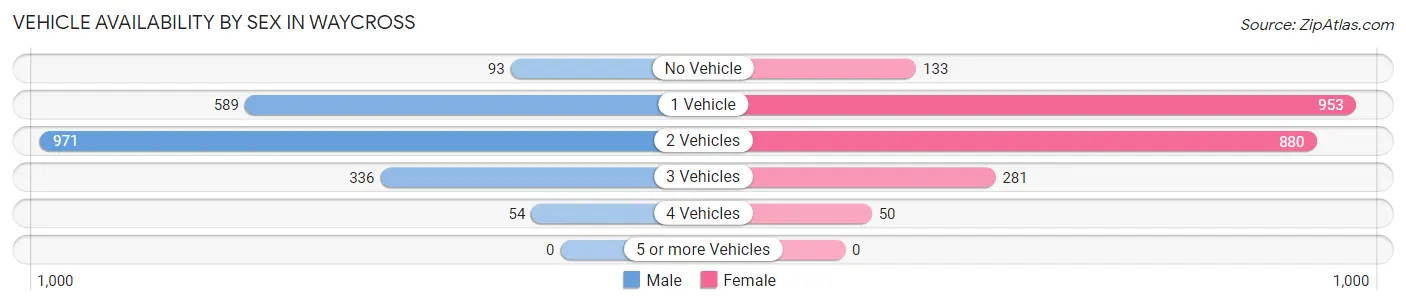
| Vehicles Available | Male | Female |
| No Vehicle | 93 (4.5%) | 133 (5.8%) |
| 1 Vehicle | 589 (28.8%) | 953 (41.5%) |
| 2 Vehicles | 971 (47.5%) | 880 (38.3%) |
| 3 Vehicles | 336 (16.5%) | 281 (12.2%) |
| 4 Vehicles | 54 (2.6%) | 50 (2.2%) |
| 5 or more Vehicles | 0 (0.0%) | 0 (0.0%) |
| Total | 2,043 (100.0%) | 2,297 (100.0%) |
Commute Time in Waycross
The most frequently occuring commute durations in Waycross are 15 to 19 minutes (1,184 commuters, 28.3%), 10 to 14 minutes (956 commuters, 22.9%), and 5 to 9 minutes (710 commuters, 17.0%).
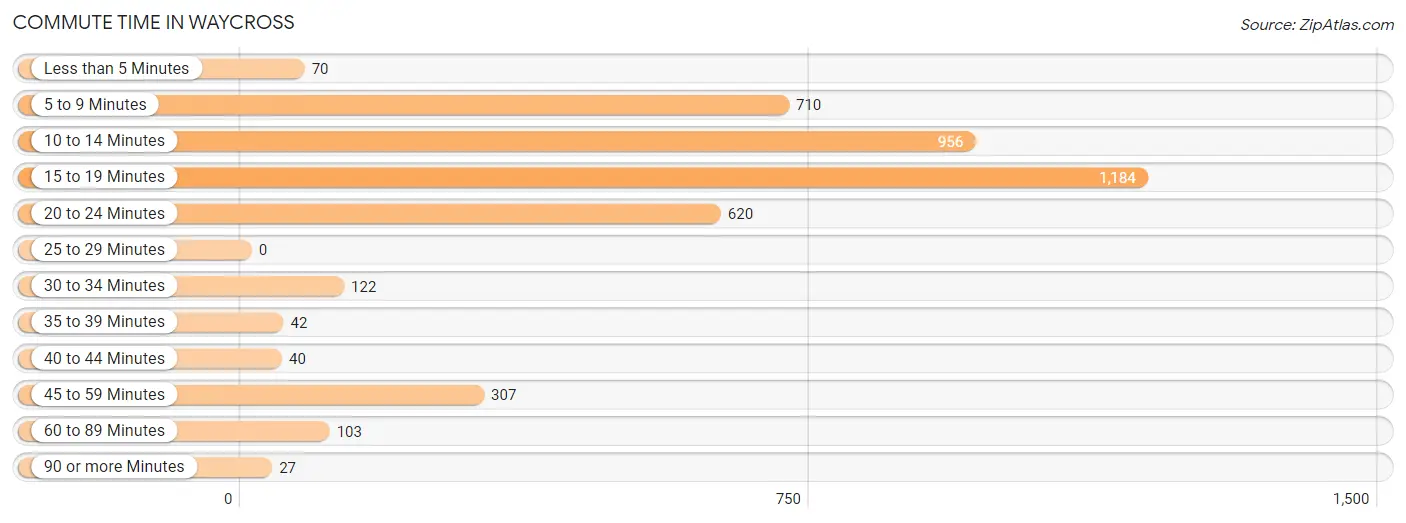
| Commute Time | # Commuters | % Commuters |
| Less than 5 Minutes | 70 | 1.7% |
| 5 to 9 Minutes | 710 | 17.0% |
| 10 to 14 Minutes | 956 | 22.9% |
| 15 to 19 Minutes | 1,184 | 28.3% |
| 20 to 24 Minutes | 620 | 14.8% |
| 25 to 29 Minutes | 0 | 0.0% |
| 30 to 34 Minutes | 122 | 2.9% |
| 35 to 39 Minutes | 42 | 1.0% |
| 40 to 44 Minutes | 40 | 1.0% |
| 45 to 59 Minutes | 307 | 7.3% |
| 60 to 89 Minutes | 103 | 2.5% |
| 90 or more Minutes | 27 | 0.6% |
Commute Time by Sex in Waycross
The most common commute times in Waycross are 15 to 19 minutes (575 commuters, 29.1%) for males and 15 to 19 minutes (609 commuters, 27.6%) for females.
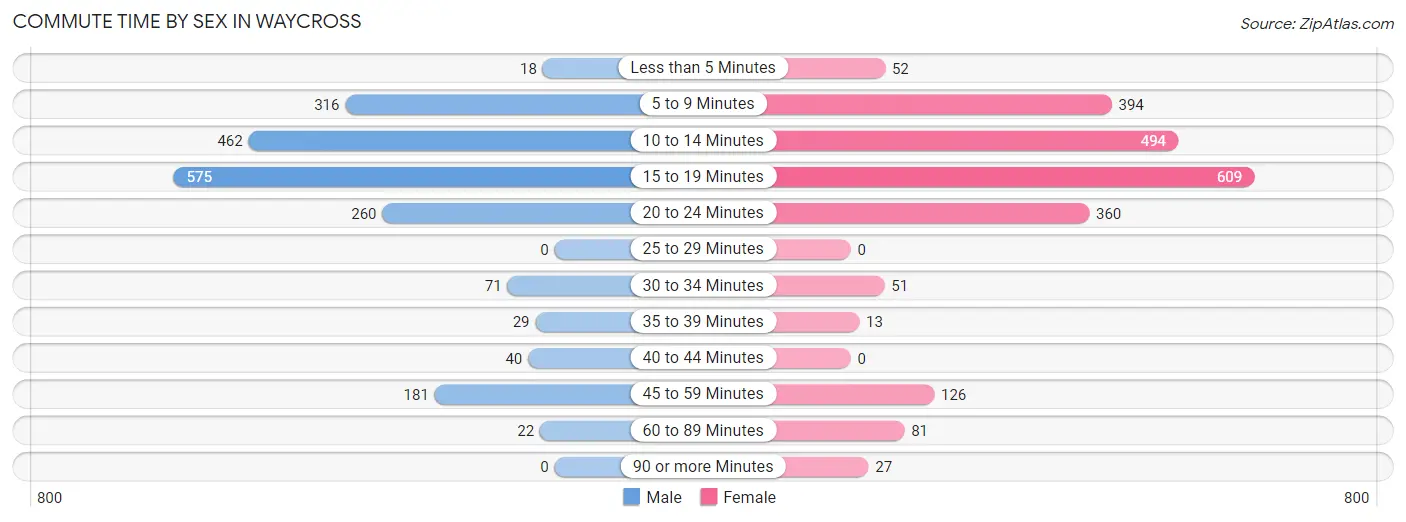
| Commute Time | Male | Female |
| Less than 5 Minutes | 18 (0.9%) | 52 (2.4%) |
| 5 to 9 Minutes | 316 (16.0%) | 394 (17.8%) |
| 10 to 14 Minutes | 462 (23.4%) | 494 (22.4%) |
| 15 to 19 Minutes | 575 (29.1%) | 609 (27.6%) |
| 20 to 24 Minutes | 260 (13.2%) | 360 (16.3%) |
| 25 to 29 Minutes | 0 (0.0%) | 0 (0.0%) |
| 30 to 34 Minutes | 71 (3.6%) | 51 (2.3%) |
| 35 to 39 Minutes | 29 (1.5%) | 13 (0.6%) |
| 40 to 44 Minutes | 40 (2.0%) | 0 (0.0%) |
| 45 to 59 Minutes | 181 (9.2%) | 126 (5.7%) |
| 60 to 89 Minutes | 22 (1.1%) | 81 (3.7%) |
| 90 or more Minutes | 0 (0.0%) | 27 (1.2%) |
Time of Departure to Work by Sex in Waycross
The most frequent times of departure to work in Waycross are 6:30 AM to 6:59 AM (428, 21.7%) for males and 6:30 AM to 6:59 AM (460, 20.8%) for females.
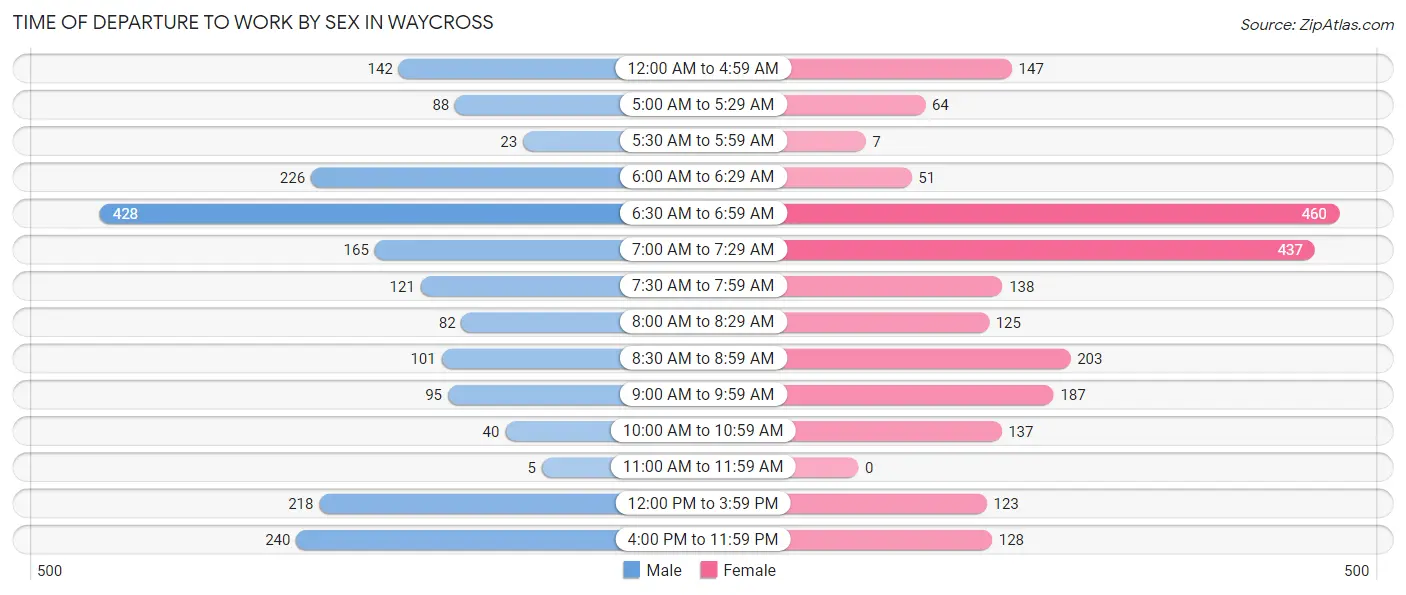
| Time of Departure | Male | Female |
| 12:00 AM to 4:59 AM | 142 (7.2%) | 147 (6.7%) |
| 5:00 AM to 5:29 AM | 88 (4.5%) | 64 (2.9%) |
| 5:30 AM to 5:59 AM | 23 (1.2%) | 7 (0.3%) |
| 6:00 AM to 6:29 AM | 226 (11.5%) | 51 (2.3%) |
| 6:30 AM to 6:59 AM | 428 (21.7%) | 460 (20.8%) |
| 7:00 AM to 7:29 AM | 165 (8.4%) | 437 (19.8%) |
| 7:30 AM to 7:59 AM | 121 (6.1%) | 138 (6.2%) |
| 8:00 AM to 8:29 AM | 82 (4.2%) | 125 (5.7%) |
| 8:30 AM to 8:59 AM | 101 (5.1%) | 203 (9.2%) |
| 9:00 AM to 9:59 AM | 95 (4.8%) | 187 (8.5%) |
| 10:00 AM to 10:59 AM | 40 (2.0%) | 137 (6.2%) |
| 11:00 AM to 11:59 AM | 5 (0.3%) | 0 (0.0%) |
| 12:00 PM to 3:59 PM | 218 (11.0%) | 123 (5.6%) |
| 4:00 PM to 11:59 PM | 240 (12.2%) | 128 (5.8%) |
| Total | 1,974 (100.0%) | 2,207 (100.0%) |
Housing Occupancy in Waycross
Occupancy by Ownership in Waycross
Of the total 5,300 dwellings in Waycross, owner-occupied units account for 2,339 (44.1%), while renter-occupied units make up 2,961 (55.9%).
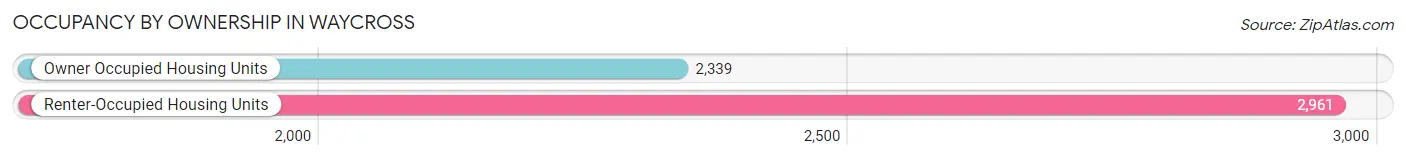
| Occupancy | # Housing Units | % Housing Units |
| Owner Occupied Housing Units | 2,339 | 44.1% |
| Renter-Occupied Housing Units | 2,961 | 55.9% |
| Total Occupied Housing Units | 5,300 | 100.0% |
Occupancy by Household Size in Waycross
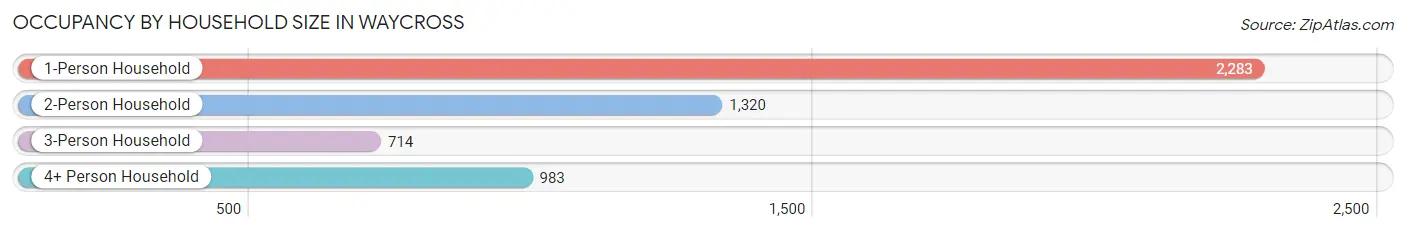
| Household Size | # Housing Units | % Housing Units |
| 1-Person Household | 2,283 | 43.1% |
| 2-Person Household | 1,320 | 24.9% |
| 3-Person Household | 714 | 13.5% |
| 4+ Person Household | 983 | 18.5% |
| Total Housing Units | 5,300 | 100.0% |
Occupancy by Ownership by Household Size in Waycross
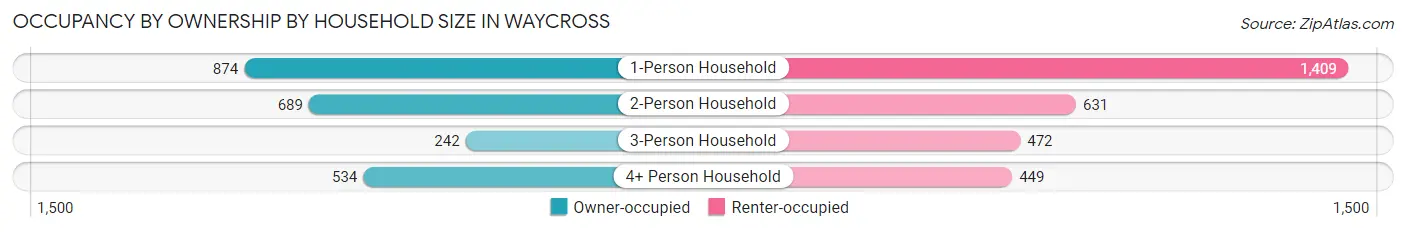
| Household Size | Owner-occupied | Renter-occupied |
| 1-Person Household | 874 (38.3%) | 1,409 (61.7%) |
| 2-Person Household | 689 (52.2%) | 631 (47.8%) |
| 3-Person Household | 242 (33.9%) | 472 (66.1%) |
| 4+ Person Household | 534 (54.3%) | 449 (45.7%) |
| Total Housing Units | 2,339 (44.1%) | 2,961 (55.9%) |
Occupancy by Educational Attainment in Waycross
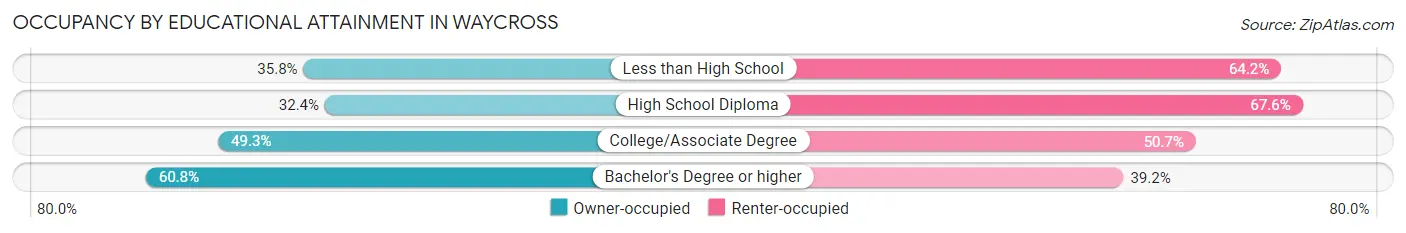
| Household Size | Owner-occupied | Renter-occupied |
| Less than High School | 249 (35.8%) | 447 (64.2%) |
| High School Diploma | 606 (32.4%) | 1,266 (67.6%) |
| College/Associate Degree | 759 (49.3%) | 780 (50.7%) |
| Bachelor's Degree or higher | 725 (60.8%) | 468 (39.2%) |
Occupancy by Age of Householder in Waycross
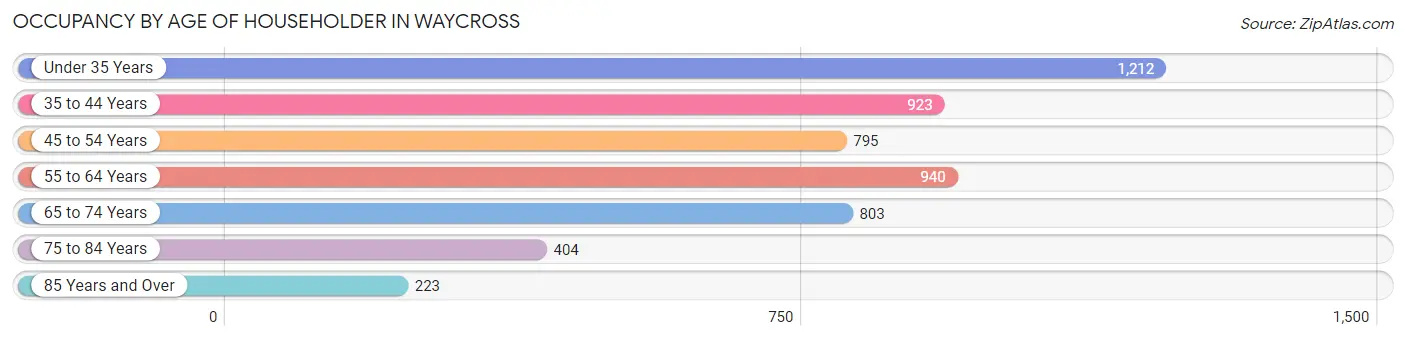
| Age Bracket | # Households | % Households |
| Under 35 Years | 1,212 | 22.9% |
| 35 to 44 Years | 923 | 17.4% |
| 45 to 54 Years | 795 | 15.0% |
| 55 to 64 Years | 940 | 17.7% |
| 65 to 74 Years | 803 | 15.1% |
| 75 to 84 Years | 404 | 7.6% |
| 85 Years and Over | 223 | 4.2% |
| Total | 5,300 | 100.0% |
Housing Finances in Waycross
Median Income by Occupancy in Waycross
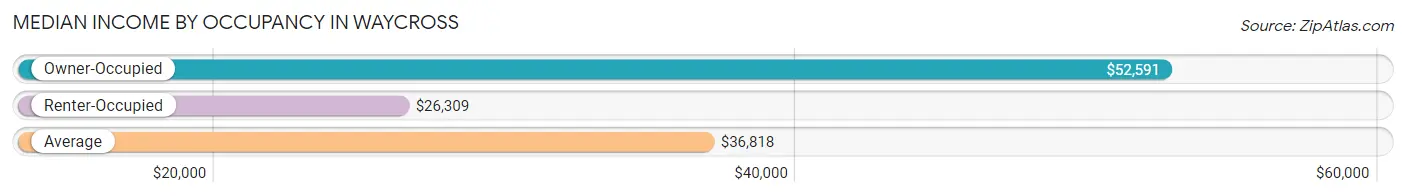
| Occupancy Type | # Households | Median Income |
| Owner-Occupied | 2,339 (44.1%) | $52,591 |
| Renter-Occupied | 2,961 (55.9%) | $26,309 |
| Average | 5,300 (100.0%) | $36,818 |
Occupancy by Householder Income Bracket in Waycross
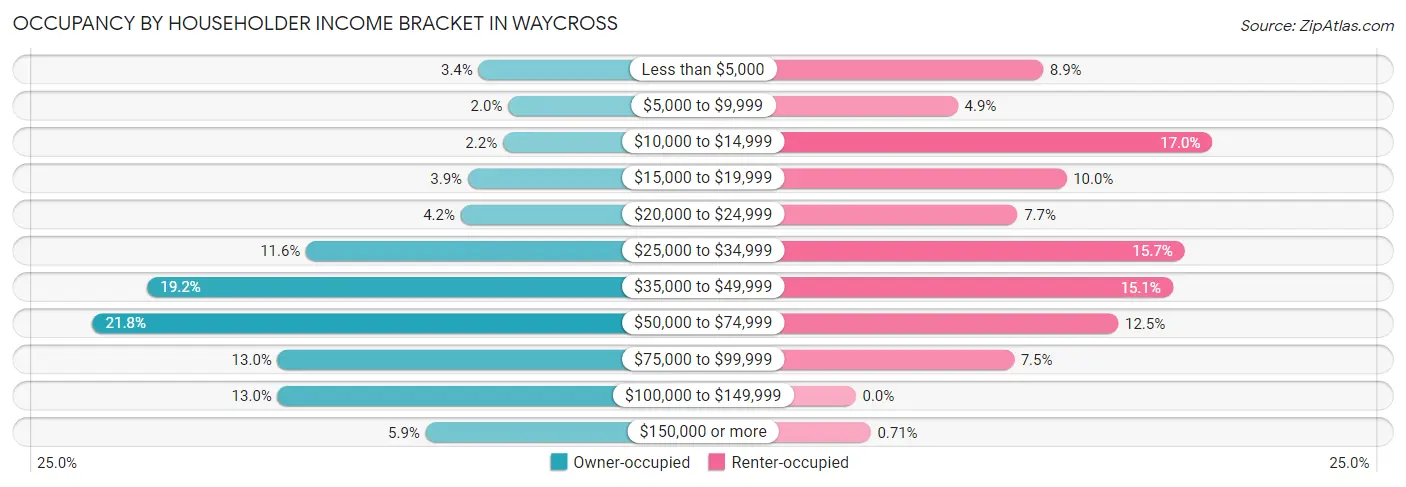
| Income Bracket | Owner-occupied | Renter-occupied |
| Less than $5,000 | 79 (3.4%) | 264 (8.9%) |
| $5,000 to $9,999 | 46 (2.0%) | 144 (4.9%) |
| $10,000 to $14,999 | 52 (2.2%) | 503 (17.0%) |
| $15,000 to $19,999 | 91 (3.9%) | 297 (10.0%) |
| $20,000 to $24,999 | 99 (4.2%) | 228 (7.7%) |
| $25,000 to $34,999 | 271 (11.6%) | 464 (15.7%) |
| $35,000 to $49,999 | 448 (19.2%) | 447 (15.1%) |
| $50,000 to $74,999 | 509 (21.8%) | 370 (12.5%) |
| $75,000 to $99,999 | 303 (13.0%) | 223 (7.5%) |
| $100,000 to $149,999 | 303 (13.0%) | 0 (0.0%) |
| $150,000 or more | 138 (5.9%) | 21 (0.7%) |
| Total | 2,339 (100.0%) | 2,961 (100.0%) |
Monthly Housing Cost Tiers in Waycross
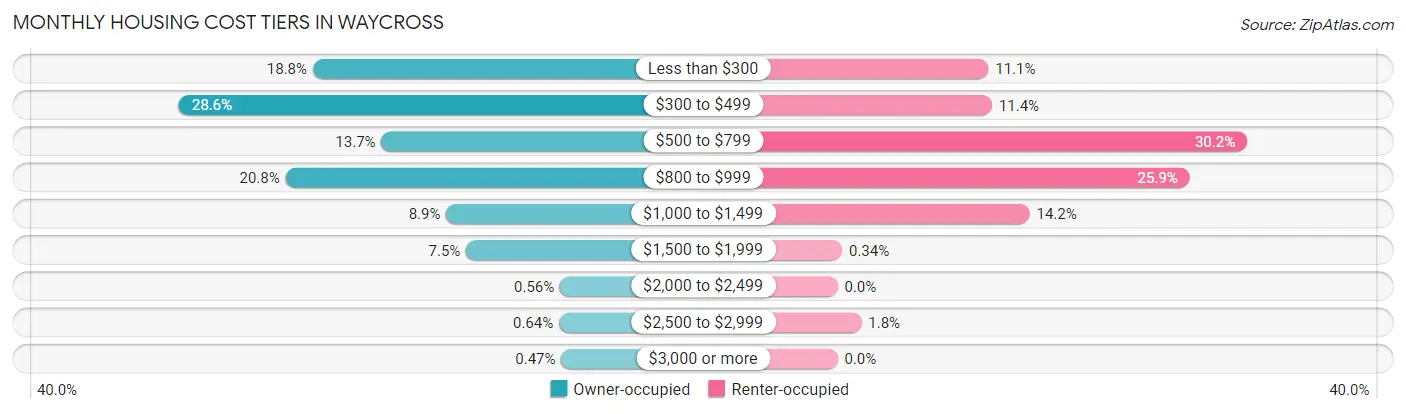
| Monthly Cost | Owner-occupied | Renter-occupied |
| Less than $300 | 439 (18.8%) | 329 (11.1%) |
| $300 to $499 | 670 (28.6%) | 337 (11.4%) |
| $500 to $799 | 321 (13.7%) | 893 (30.2%) |
| $800 to $999 | 486 (20.8%) | 768 (25.9%) |
| $1,000 to $1,499 | 209 (8.9%) | 419 (14.1%) |
| $1,500 to $1,999 | 175 (7.5%) | 10 (0.3%) |
| $2,000 to $2,499 | 13 (0.6%) | 0 (0.0%) |
| $2,500 to $2,999 | 15 (0.6%) | 52 (1.8%) |
| $3,000 or more | 11 (0.5%) | 0 (0.0%) |
| Total | 2,339 (100.0%) | 2,961 (100.0%) |
Physical Housing Characteristics in Waycross
Housing Structures in Waycross
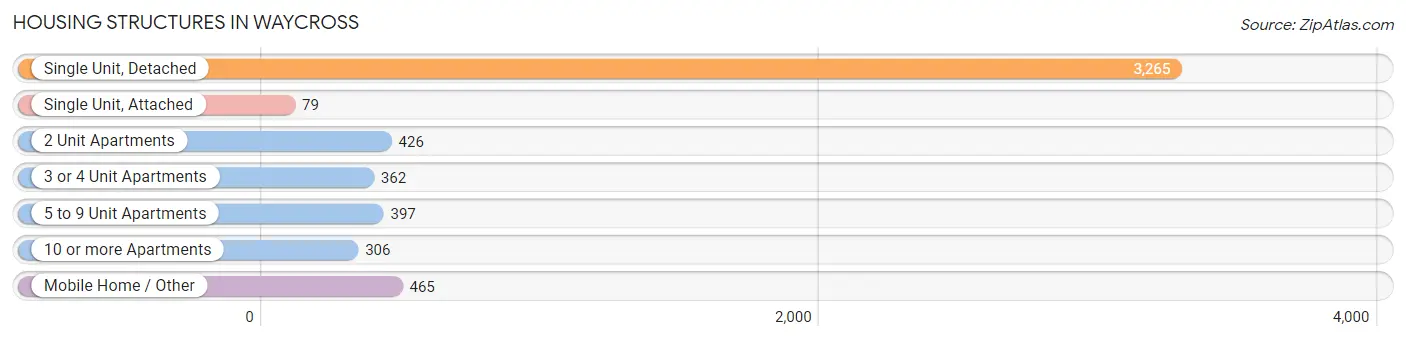
| Structure Type | # Housing Units | % Housing Units |
| Single Unit, Detached | 3,265 | 61.6% |
| Single Unit, Attached | 79 | 1.5% |
| 2 Unit Apartments | 426 | 8.0% |
| 3 or 4 Unit Apartments | 362 | 6.8% |
| 5 to 9 Unit Apartments | 397 | 7.5% |
| 10 or more Apartments | 306 | 5.8% |
| Mobile Home / Other | 465 | 8.8% |
| Total | 5,300 | 100.0% |
Housing Structures by Occupancy in Waycross
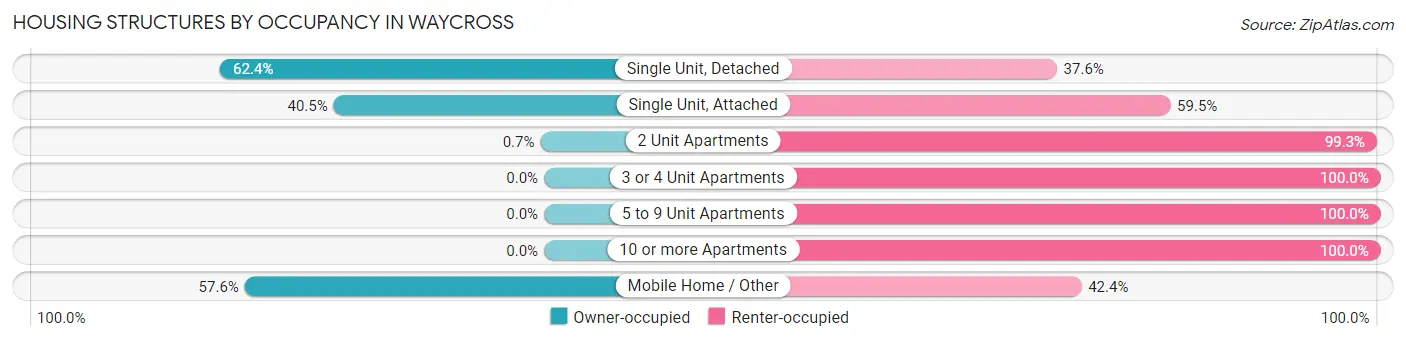
| Structure Type | Owner-occupied | Renter-occupied |
| Single Unit, Detached | 2,036 (62.4%) | 1,229 (37.6%) |
| Single Unit, Attached | 32 (40.5%) | 47 (59.5%) |
| 2 Unit Apartments | 3 (0.7%) | 423 (99.3%) |
| 3 or 4 Unit Apartments | 0 (0.0%) | 362 (100.0%) |
| 5 to 9 Unit Apartments | 0 (0.0%) | 397 (100.0%) |
| 10 or more Apartments | 0 (0.0%) | 306 (100.0%) |
| Mobile Home / Other | 268 (57.6%) | 197 (42.4%) |
| Total | 2,339 (44.1%) | 2,961 (55.9%) |
Housing Structures by Number of Rooms in Waycross
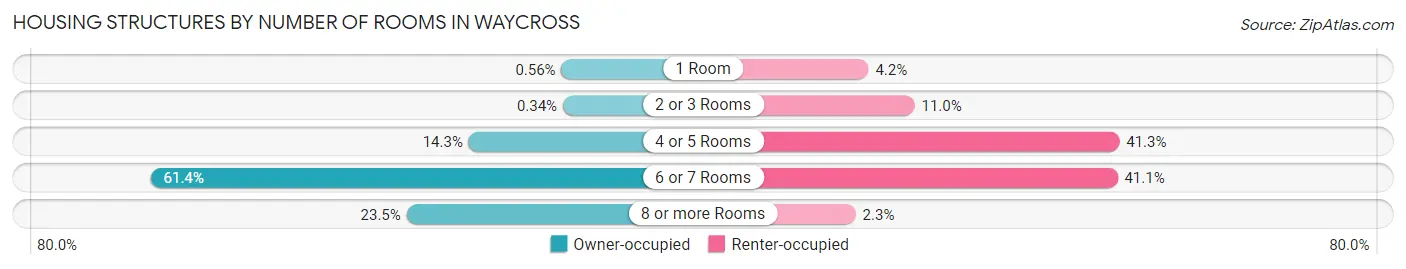
| Number of Rooms | Owner-occupied | Renter-occupied |
| 1 Room | 13 (0.6%) | 125 (4.2%) |
| 2 or 3 Rooms | 8 (0.3%) | 327 (11.0%) |
| 4 or 5 Rooms | 334 (14.3%) | 1,224 (41.3%) |
| 6 or 7 Rooms | 1,435 (61.4%) | 1,216 (41.1%) |
| 8 or more Rooms | 549 (23.5%) | 69 (2.3%) |
| Total | 2,339 (100.0%) | 2,961 (100.0%) |
Housing Structure by Heating Type in Waycross
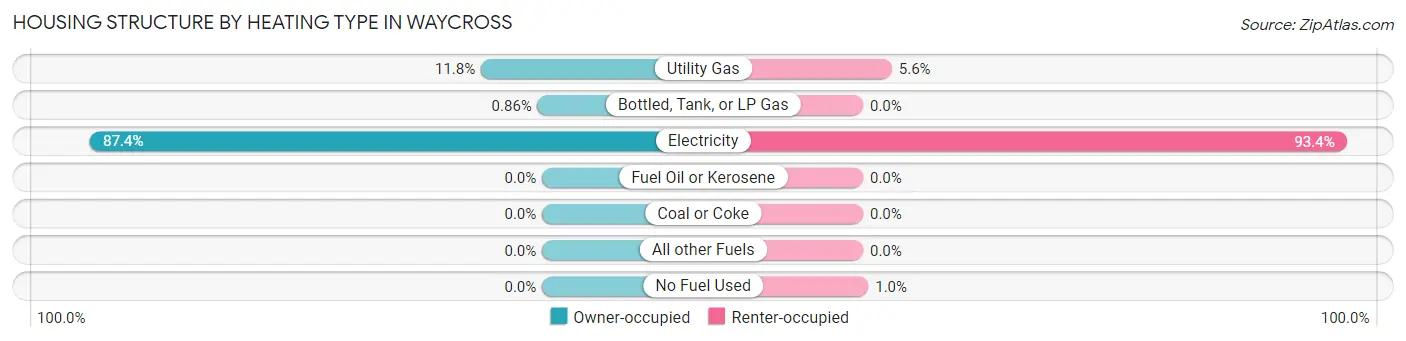
| Heating Type | Owner-occupied | Renter-occupied |
| Utility Gas | 276 (11.8%) | 165 (5.6%) |
| Bottled, Tank, or LP Gas | 20 (0.9%) | 0 (0.0%) |
| Electricity | 2,043 (87.4%) | 2,766 (93.4%) |
| Fuel Oil or Kerosene | 0 (0.0%) | 0 (0.0%) |
| Coal or Coke | 0 (0.0%) | 0 (0.0%) |
| All other Fuels | 0 (0.0%) | 0 (0.0%) |
| No Fuel Used | 0 (0.0%) | 30 (1.0%) |
| Total | 2,339 (100.0%) | 2,961 (100.0%) |
Household Vehicle Usage in Waycross
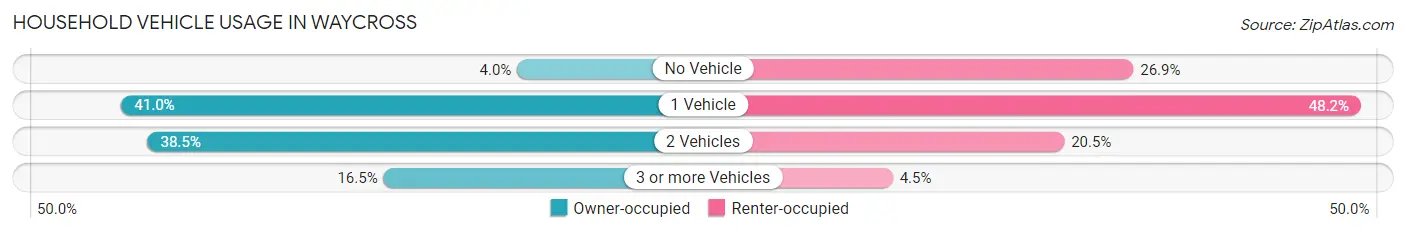
| Vehicles per Household | Owner-occupied | Renter-occupied |
| No Vehicle | 94 (4.0%) | 797 (26.9%) |
| 1 Vehicle | 958 (41.0%) | 1,426 (48.2%) |
| 2 Vehicles | 901 (38.5%) | 606 (20.5%) |
| 3 or more Vehicles | 386 (16.5%) | 132 (4.5%) |
| Total | 2,339 (100.0%) | 2,961 (100.0%) |
Real Estate & Mortgages in Waycross
Real Estate and Mortgage Overview in Waycross
| Characteristic | Without Mortgage | With Mortgage |
| Housing Units | 1,231 | 1,108 |
| Median Property Value | $53,900 | $95,000 |
| Median Household Income | $40,925 | $70 |
| Monthly Housing Costs | $366 | $11 |
| Real Estate Taxes | $570 | $61 |
Property Value by Mortgage Status in Waycross
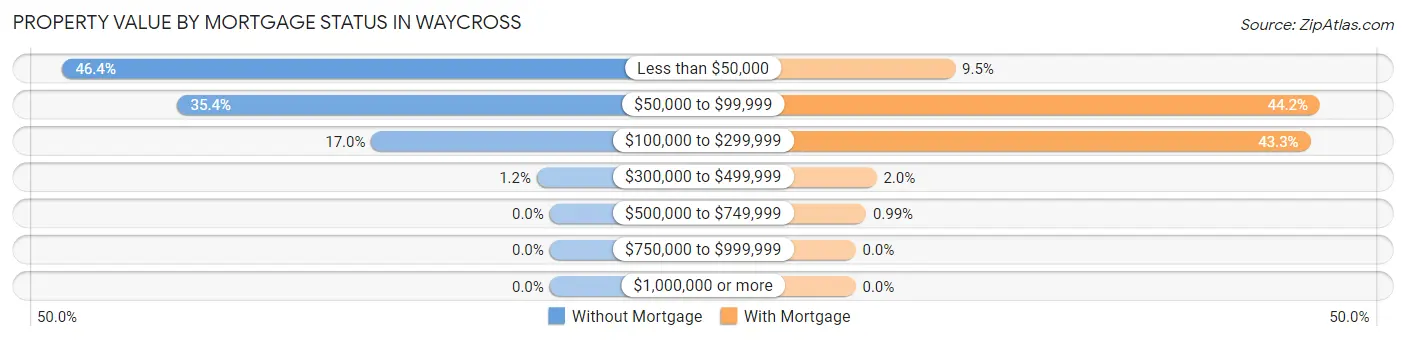
| Property Value | Without Mortgage | With Mortgage |
| Less than $50,000 | 571 (46.4%) | 105 (9.5%) |
| $50,000 to $99,999 | 436 (35.4%) | 490 (44.2%) |
| $100,000 to $299,999 | 209 (17.0%) | 480 (43.3%) |
| $300,000 to $499,999 | 15 (1.2%) | 22 (2.0%) |
| $500,000 to $749,999 | 0 (0.0%) | 11 (1.0%) |
| $750,000 to $999,999 | 0 (0.0%) | 0 (0.0%) |
| $1,000,000 or more | 0 (0.0%) | 0 (0.0%) |
| Total | 1,231 (100.0%) | 1,108 (100.0%) |
Household Income by Mortgage Status in Waycross
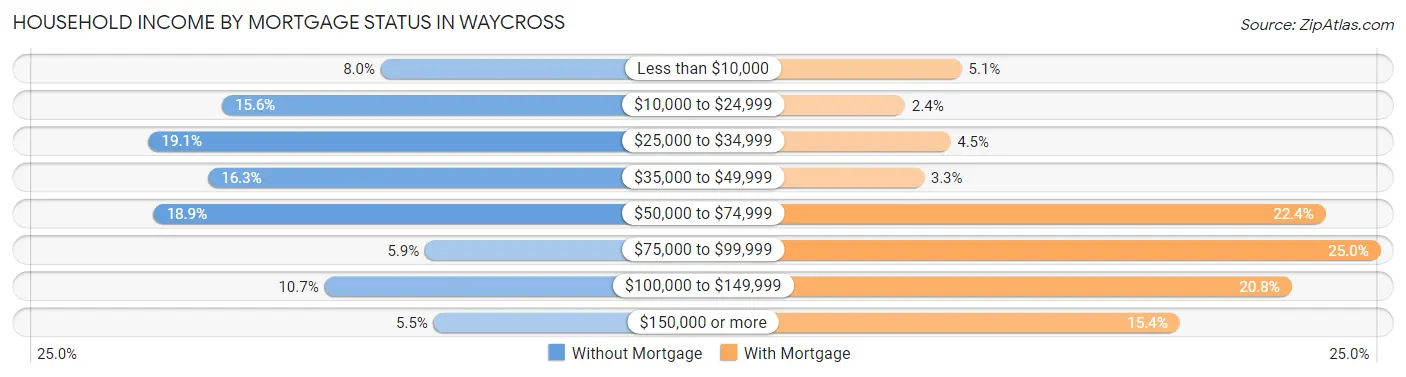
| Household Income | Without Mortgage | With Mortgage |
| Less than $10,000 | 99 (8.0%) | 56 (5.1%) |
| $10,000 to $24,999 | 192 (15.6%) | 26 (2.4%) |
| $25,000 to $34,999 | 235 (19.1%) | 50 (4.5%) |
| $35,000 to $49,999 | 200 (16.3%) | 36 (3.3%) |
| $50,000 to $74,999 | 232 (18.9%) | 248 (22.4%) |
| $75,000 to $99,999 | 73 (5.9%) | 277 (25.0%) |
| $100,000 to $149,999 | 132 (10.7%) | 230 (20.8%) |
| $150,000 or more | 68 (5.5%) | 171 (15.4%) |
| Total | 1,231 (100.0%) | 1,108 (100.0%) |
Property Value to Household Income Ratio in Waycross
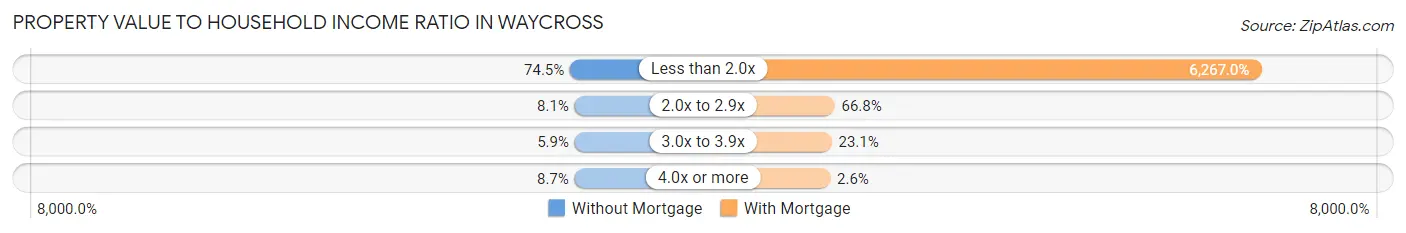
| Value-to-Income Ratio | Without Mortgage | With Mortgage |
| Less than 2.0x | 917 (74.5%) | 69,438 (6,267.0%) |
| 2.0x to 2.9x | 100 (8.1%) | 740 (66.8%) |
| 3.0x to 3.9x | 72 (5.9%) | 256 (23.1%) |
| 4.0x or more | 107 (8.7%) | 29 (2.6%) |
| Total | 1,231 (100.0%) | 1,108 (100.0%) |
Real Estate Taxes by Mortgage Status in Waycross
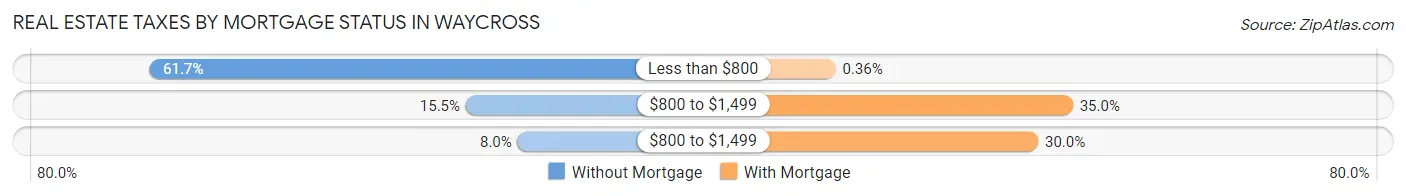
| Property Taxes | Without Mortgage | With Mortgage |
| Less than $800 | 759 (61.7%) | 4 (0.4%) |
| $800 to $1,499 | 191 (15.5%) | 388 (35.0%) |
| $800 to $1,499 | 98 (8.0%) | 332 (30.0%) |
| Total | 1,231 (100.0%) | 1,108 (100.0%) |
Health & Disability in Waycross
Health Insurance Coverage by Age in Waycross
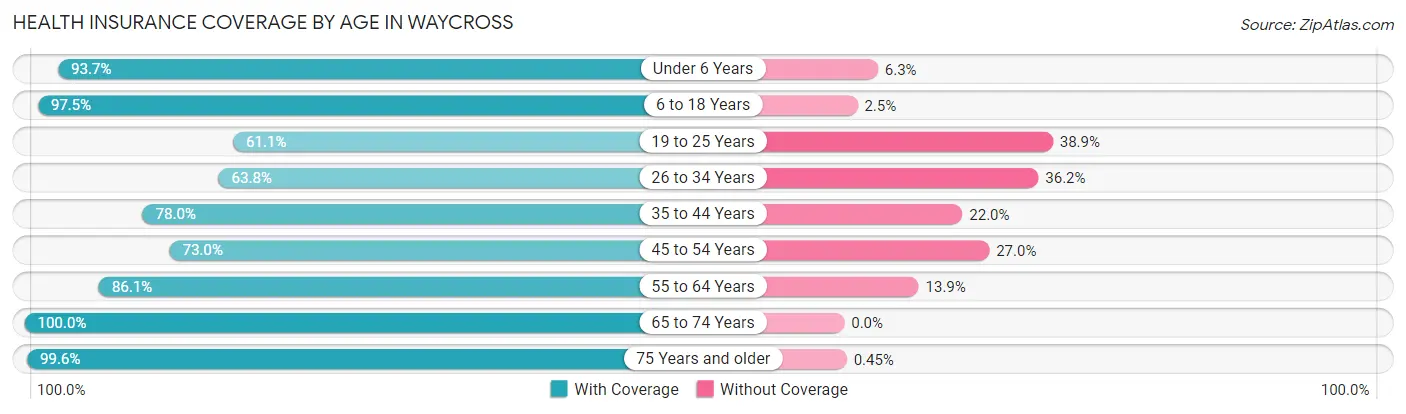
| Age Bracket | With Coverage | Without Coverage |
| Under 6 Years | 1,303 (93.7%) | 87 (6.3%) |
| 6 to 18 Years | 2,853 (97.5%) | 72 (2.5%) |
| 19 to 25 Years | 558 (61.1%) | 355 (38.9%) |
| 26 to 34 Years | 1,118 (63.8%) | 634 (36.2%) |
| 35 to 44 Years | 1,339 (78.0%) | 378 (22.0%) |
| 45 to 54 Years | 991 (73.0%) | 367 (27.0%) |
| 55 to 64 Years | 1,262 (86.1%) | 203 (13.9%) |
| 65 to 74 Years | 1,082 (100.0%) | 0 (0.0%) |
| 75 Years and older | 877 (99.6%) | 4 (0.4%) |
| Total | 11,383 (84.4%) | 2,100 (15.6%) |
Health Insurance Coverage by Citizenship Status in Waycross
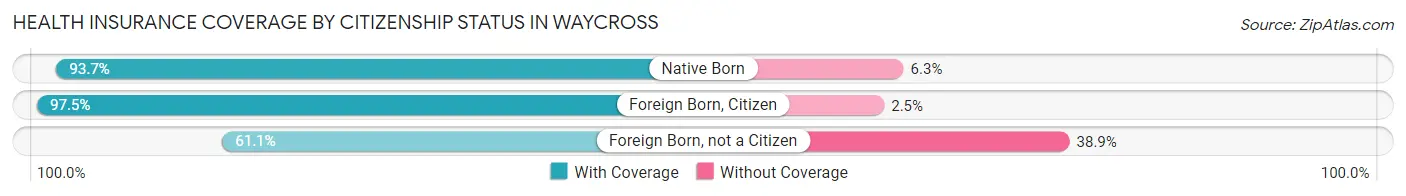
| Citizenship Status | With Coverage | Without Coverage |
| Native Born | 1,303 (93.7%) | 87 (6.3%) |
| Foreign Born, Citizen | 2,853 (97.5%) | 72 (2.5%) |
| Foreign Born, not a Citizen | 558 (61.1%) | 355 (38.9%) |
Health Insurance Coverage by Household Income in Waycross
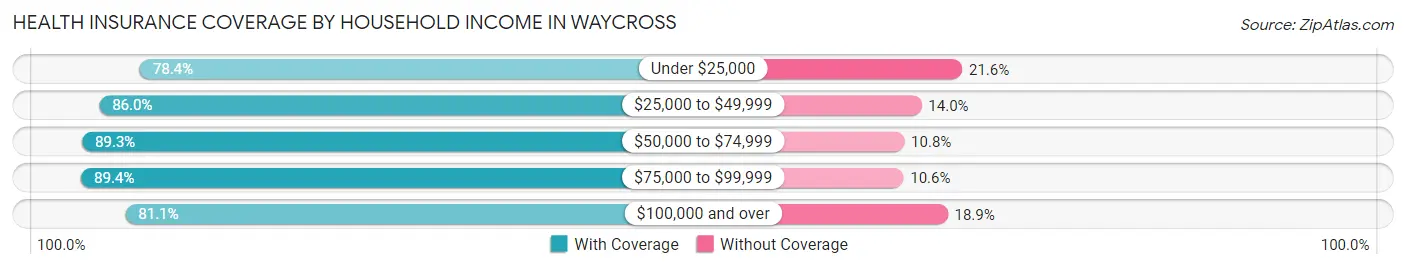
| Household Income | With Coverage | Without Coverage |
| Under $25,000 | 2,715 (78.4%) | 748 (21.6%) |
| $25,000 to $49,999 | 3,685 (86.0%) | 599 (14.0%) |
| $50,000 to $74,999 | 2,226 (89.2%) | 268 (10.7%) |
| $75,000 to $99,999 | 1,444 (89.4%) | 171 (10.6%) |
| $100,000 and over | 1,272 (81.1%) | 296 (18.9%) |
Public vs Private Health Insurance Coverage by Age in Waycross
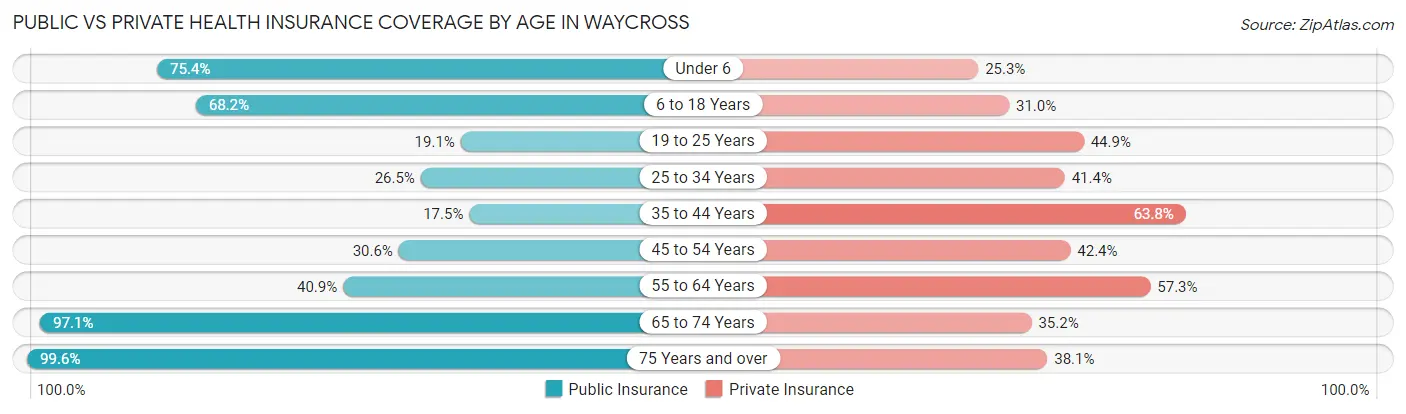
| Age Bracket | Public Insurance | Private Insurance |
| Under 6 | 1,048 (75.4%) | 352 (25.3%) |
| 6 to 18 Years | 1,995 (68.2%) | 908 (31.0%) |
| 19 to 25 Years | 174 (19.1%) | 410 (44.9%) |
| 25 to 34 Years | 464 (26.5%) | 725 (41.4%) |
| 35 to 44 Years | 300 (17.5%) | 1,096 (63.8%) |
| 45 to 54 Years | 415 (30.6%) | 576 (42.4%) |
| 55 to 64 Years | 599 (40.9%) | 839 (57.3%) |
| 65 to 74 Years | 1,051 (97.1%) | 381 (35.2%) |
| 75 Years and over | 877 (99.6%) | 336 (38.1%) |
| Total | 6,923 (51.3%) | 5,623 (41.7%) |
Disability Status by Sex by Age in Waycross
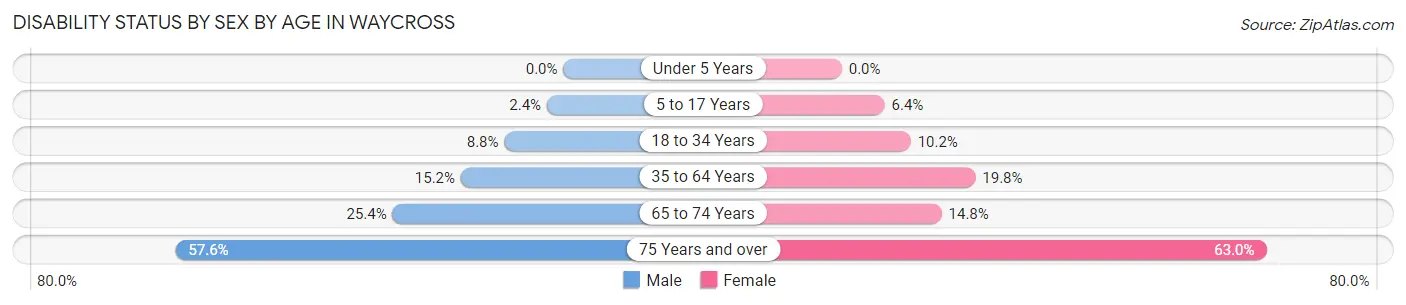
| Age Bracket | Male | Female |
| Under 5 Years | 0 (0.0%) | 0 (0.0%) |
| 5 to 17 Years | 38 (2.4%) | 94 (6.4%) |
| 18 to 34 Years | 88 (8.8%) | 183 (10.2%) |
| 35 to 64 Years | 324 (15.2%) | 478 (19.8%) |
| 65 to 74 Years | 105 (25.4%) | 99 (14.8%) |
| 75 Years and over | 163 (57.6%) | 377 (63.0%) |
Disability Class by Sex by Age in Waycross
Disability Class: Hearing Difficulty
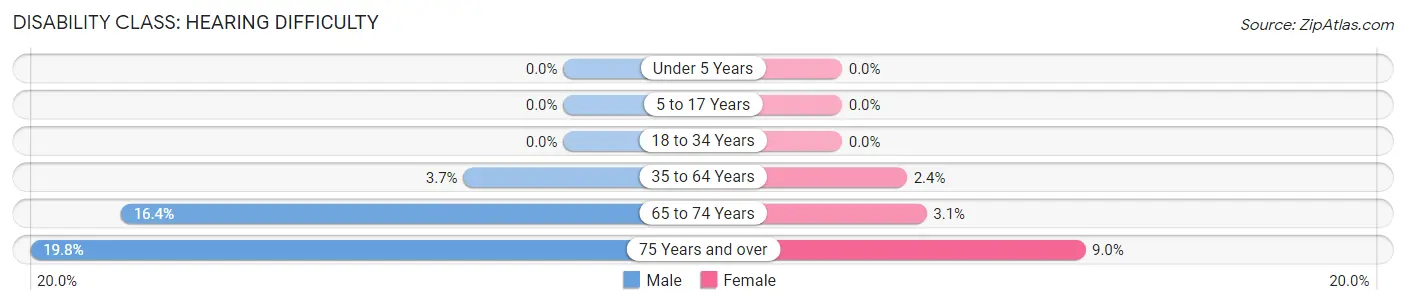
| Age Bracket | Male | Female |
| Under 5 Years | 0 (0.0%) | 0 (0.0%) |
| 5 to 17 Years | 0 (0.0%) | 0 (0.0%) |
| 18 to 34 Years | 0 (0.0%) | 0 (0.0%) |
| 35 to 64 Years | 79 (3.7%) | 58 (2.4%) |
| 65 to 74 Years | 68 (16.4%) | 21 (3.1%) |
| 75 Years and over | 56 (19.8%) | 54 (9.0%) |
Disability Class: Vision Difficulty
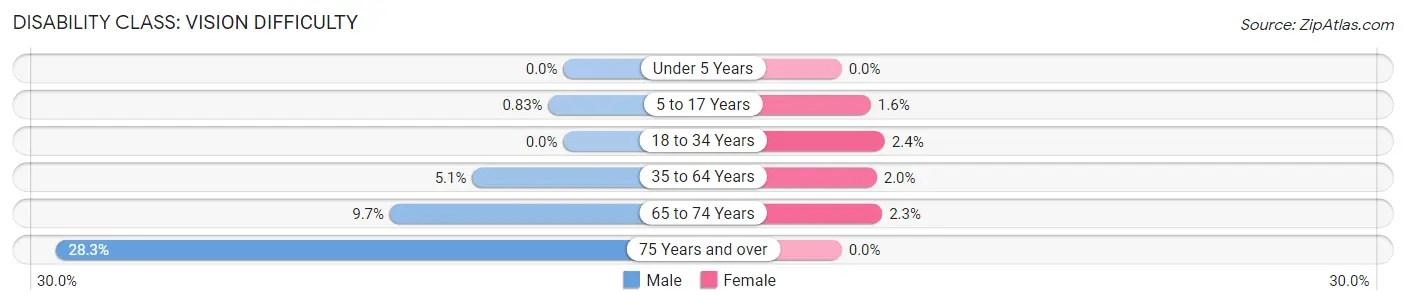
| Age Bracket | Male | Female |
| Under 5 Years | 0 (0.0%) | 0 (0.0%) |
| 5 to 17 Years | 13 (0.8%) | 24 (1.6%) |
| 18 to 34 Years | 0 (0.0%) | 43 (2.4%) |
| 35 to 64 Years | 108 (5.1%) | 47 (1.9%) |
| 65 to 74 Years | 40 (9.7%) | 15 (2.2%) |
| 75 Years and over | 80 (28.3%) | 0 (0.0%) |
Disability Class: Cognitive Difficulty
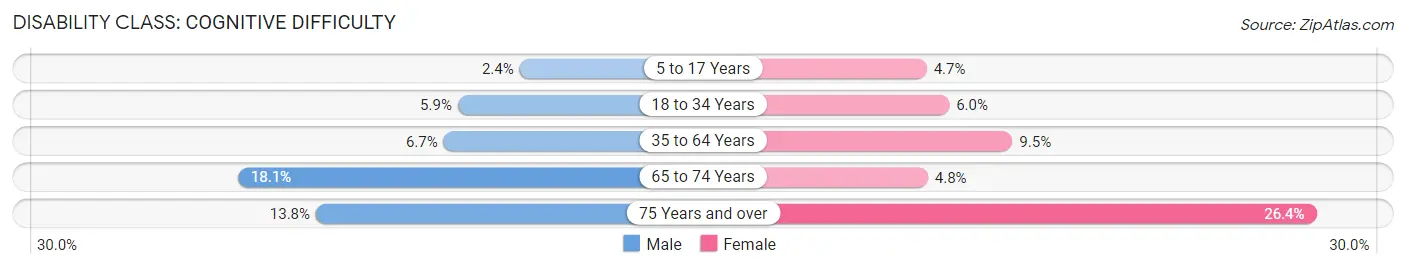
| Age Bracket | Male | Female |
| 5 to 17 Years | 38 (2.4%) | 70 (4.7%) |
| 18 to 34 Years | 59 (5.9%) | 107 (6.0%) |
| 35 to 64 Years | 142 (6.7%) | 229 (9.5%) |
| 65 to 74 Years | 75 (18.1%) | 32 (4.8%) |
| 75 Years and over | 39 (13.8%) | 158 (26.4%) |
Disability Class: Ambulatory Difficulty
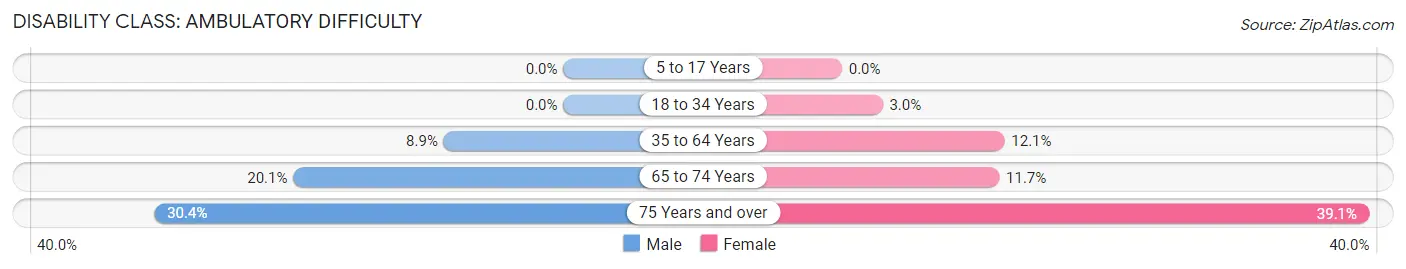
| Age Bracket | Male | Female |
| 5 to 17 Years | 0 (0.0%) | 0 (0.0%) |
| 18 to 34 Years | 0 (0.0%) | 54 (3.0%) |
| 35 to 64 Years | 189 (8.9%) | 291 (12.1%) |
| 65 to 74 Years | 83 (20.1%) | 78 (11.7%) |
| 75 Years and over | 86 (30.4%) | 234 (39.1%) |
Disability Class: Self-Care Difficulty
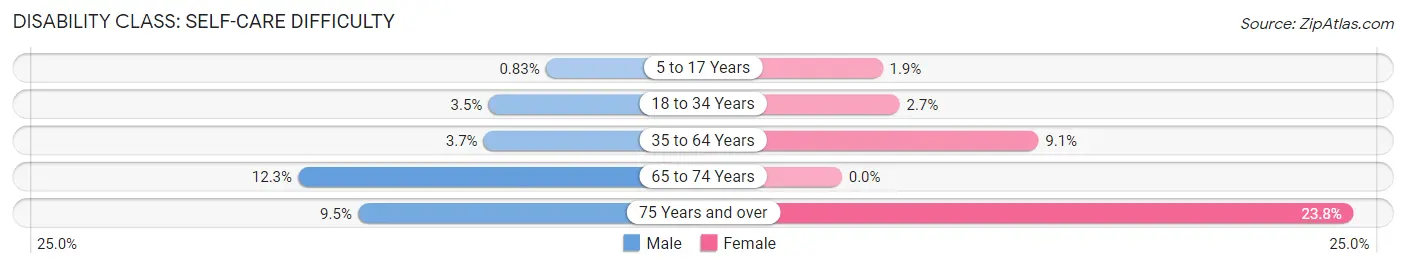
| Age Bracket | Male | Female |
| 5 to 17 Years | 13 (0.8%) | 28 (1.9%) |
| 18 to 34 Years | 35 (3.5%) | 48 (2.7%) |
| 35 to 64 Years | 79 (3.7%) | 220 (9.1%) |
| 65 to 74 Years | 51 (12.3%) | 0 (0.0%) |
| 75 Years and over | 27 (9.5%) | 142 (23.7%) |
Technology Access in Waycross
Computing Device Access in Waycross
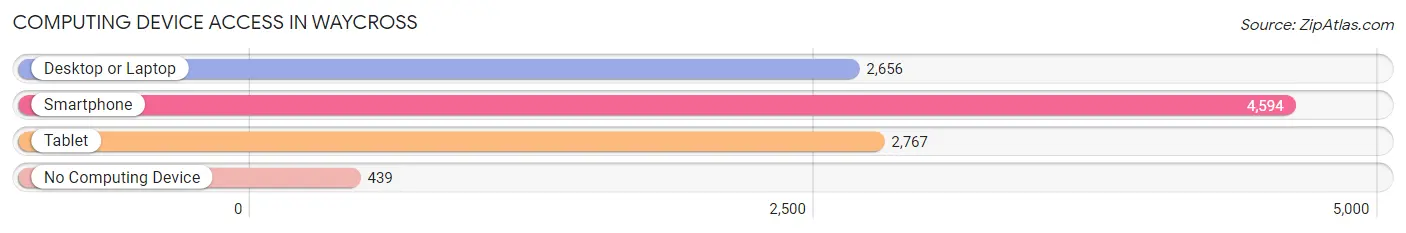
| Device Type | # Households | % Households |
| Desktop or Laptop | 2,656 | 50.1% |
| Smartphone | 4,594 | 86.7% |
| Tablet | 2,767 | 52.2% |
| No Computing Device | 439 | 8.3% |
| Total | 5,300 | 100.0% |
Internet Access in Waycross
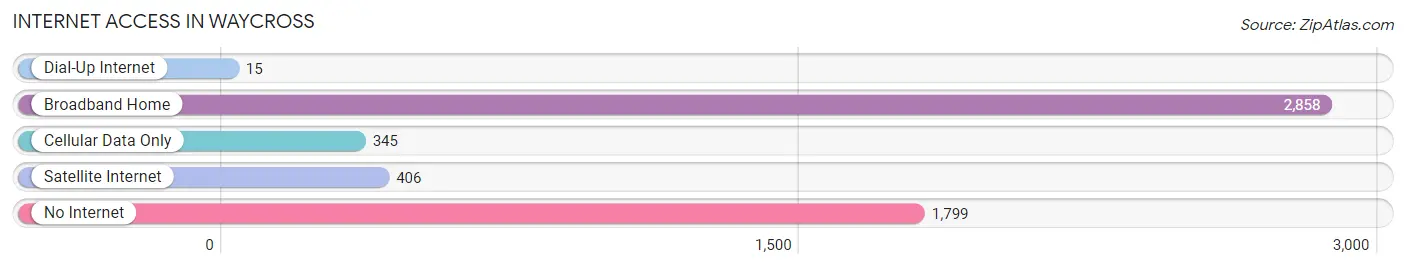
| Internet Type | # Households | % Households |
| Dial-Up Internet | 15 | 0.3% |
| Broadband Home | 2,858 | 53.9% |
| Cellular Data Only | 345 | 6.5% |
| Satellite Internet | 406 | 7.7% |
| No Internet | 1,799 | 33.9% |
| Total | 5,300 | 100.0% |
Waycross Summary
History
The city of Waycross, Georgia is located in Ware County in the southeastern corner of the state. It is the county seat and the largest city in the county. Waycross was founded in 1818 and was originally known as “Tebeauville”. The city was named after General Thomas J. Way, who was a prominent figure in the area during the Civil War. The city was incorporated in 1874 and has since grown to become a major hub for transportation, industry, and commerce in the region.
The city of Waycross has a rich history that dates back to the early 19th century. The area was originally inhabited by the Timucua Indians, who were later displaced by European settlers. The first settlers in the area were mostly farmers and ranchers, who were attracted to the area due to its fertile soil and abundant wildlife. The city was officially founded in 1818 and was named after General Thomas J. Way.
The city of Waycross experienced rapid growth during the late 19th and early 20th centuries. The city was a major hub for the lumber industry, which was a major source of employment for the area. The city also became a major railroad hub, with several major railroads running through the city. The city was also home to several major manufacturing plants, including a paper mill, a cotton mill, and a shoe factory.
Geography
Waycross is located in the southeastern corner of Georgia, in Ware County. The city is situated on the Satilla River, which is a major tributary of the Altamaha River. The city is located about 50 miles from the Atlantic Ocean and is bordered by the Okefenokee Swamp to the west. The city has a total area of 16.3 square miles, with 15.7 square miles of land and 0.6 square miles of water.
The city of Waycross has a humid subtropical climate, with hot and humid summers and mild winters. The average temperature in the summer is around 90 degrees Fahrenheit, while the average temperature in the winter is around 50 degrees Fahrenheit. The city receives an average of 48 inches of rain per year, with most of the rain falling in the summer months.
Economy
The economy of Waycross is largely based on the lumber industry, which has been a major source of employment for the area since the 19th century. The city is also home to several major manufacturing plants, including a paper mill, a cotton mill, and a shoe factory. The city is also a major transportation hub, with several major railroads running through the city.
The city of Waycross is also home to several major retail stores, including Walmart, Target, and Lowe’s. The city is also home to several major restaurants, including Applebee’s, Chili’s, and Olive Garden. The city is also home to several major hotels, including the Holiday Inn, the Comfort Inn, and the Best Western.
Demographics
As of the 2010 census, the city of Waycross had a population of 14,725. The racial makeup of the city was 57.3% White, 37.2% African American, 0.4% Native American, 0.7% Asian, 0.1% Pacific Islander, and 4.3% from other races. The median household income in the city was $30,945, and the median family income was $37,945. The per capita income in the city was $17,845.
Conclusion
The city of Waycross, Georgia is a major hub for transportation, industry, and commerce in the region. The city has a rich history that dates back to the early 19th century and has experienced rapid growth since then. The city is home to several major manufacturing plants, retail stores, restaurants, and hotels. The city has a population of 14,725 and a median household income of $30,945. Waycross is a vibrant city with a diverse economy and a rich cultural heritage.
Common Questions
What is Per Capita Income in Waycross?
Per Capita income in Waycross is $20,668.
What is the Median Family Income in Waycross?
Median Family Income in Waycross is $40,711.
What is the Median Household income in Waycross?
Median Household Income in Waycross is $36,818.
What is Income or Wage Gap in Waycross?
Income or Wage Gap in Waycross is 18.6%.
Women in Waycross earn 81.4 cents for every dollar earned by a man.
What is Inequality or Gini Index in Waycross?
Inequality or Gini Index in Waycross is 0.48.
What is the Total Population of Waycross?
Total Population of Waycross is 13,856.
What is the Total Male Population of Waycross?
Total Male Population of Waycross is 6,212.
What is the Total Female Population of Waycross?
Total Female Population of Waycross is 7,644.
What is the Ratio of Males per 100 Females in Waycross?
There are 81.27 Males per 100 Females in Waycross.
What is the Ratio of Females per 100 Males in Waycross?
There are 123.05 Females per 100 Males in Waycross.
What is the Median Population Age in Waycross?
Median Population Age in Waycross is 34.7 Years.
What is the Average Family Size in Waycross
Average Family Size in Waycross is 3.6 People.
What is the Average Household Size in Waycross
Average Household Size in Waycross is 2.5 People.
How Large is the Labor Force in Waycross?
There are 4,744 People in the Labor Forcein in Waycross.
What is the Percentage of People in the Labor Force in Waycross?
47.5% of People are in the Labor Force in Waycross.
What is the Unemployment Rate in Waycross?
Unemployment Rate in Waycross is 6.5%.