Zip Codes with the Highest Percentage of Population Taking Taxi / Cab to Work in Waycross, GA
RELATED REPORTS & OPTIONS
Taxi / Cab
Waycross
Compare Zip Codes
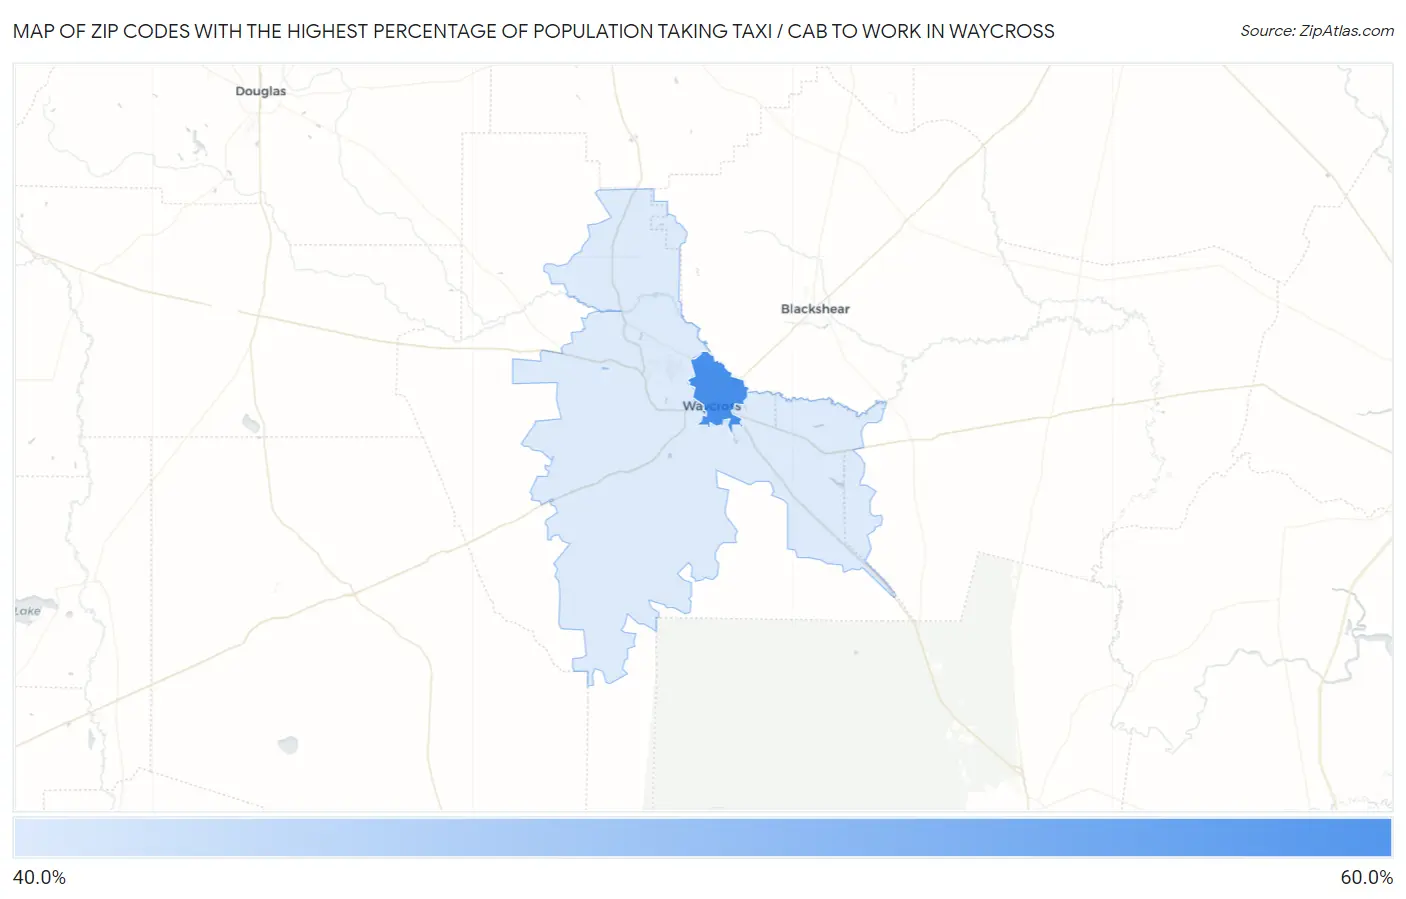
Map of Zip Codes with the Highest Percentage of Population Taking Taxi / Cab to Work in Waycross
49.4%
54.6%
Zip Codes with the Highest Percentage of Population Taking Taxi / Cab to Work in Waycross, GA
| Zip Code | % Take Taxi / Cab | vs State | vs National | |
| 1. | 31501 | 54.6% | 37.1%(+17.5)#39 | 38.2%(+16.4)#1,680 |
| 2. | 31503 | 49.4% | 37.1%(+12.3)#68 | 38.2%(+11.2)#3,136 |
1
Common Questions
What are the Top Zip Codes with the Highest Percentage of Population Taking Taxi / Cab to Work in Waycross, GA?
Top Zip Codes with the Highest Percentage of Population Taking Taxi / Cab to Work in Waycross, GA are:
What zip code has the Highest Percentage of Population Taking Taxi / Cab to Work in Waycross, GA?
31501 has the Highest Percentage of Population Taking Taxi / Cab to Work in Waycross, GA with 54.6%.
What is the Percentage of Population Taking Taxi / Cab to Work in Waycross, GA?
Percentage of Population Taking Taxi / Cab to Work in Waycross is 54.6%.
What is the Percentage of Population Taking Taxi / Cab to Work in Georgia?
Percentage of Population Taking Taxi / Cab to Work in Georgia is 37.1%.
What is the Percentage of Population Taking Taxi / Cab to Work in the United States?
Percentage of Population Taking Taxi / Cab to Work in the United States is 38.2%.