Immigrants from Cabo Verde vs Immigrants from Bangladesh Disability Age Under 5

COMPARE

Immigrants from Cabo Verde
Race
Ancestry
AfghanAfricanAlaska NativeAlaskan AthabascanAlbanianAleutAlsatianAmericanApacheArabArapahoArgentineanArmenianAssyrian/Chaldean/SyriacAustralianAustrianBahamianBangladeshiBarbadianBasqueBelgianBelizeanBermudanBhutaneseBlackfeetBolivianBrazilianBritishBritish West IndianBulgarianBurmeseCajunCambodianCanadianCape VerdeanCarpatho RusynCelticCentral AmericanCentral American IndianCherokeeCheyenneChickasawChileanChineseChippewaChoctawColombianColvilleComancheCosta RicanCreeCreekCroatianCrowCubanCypriotCzechCzechoslovakianDanishDelawareDominicanDutchDutch West IndianEastern EuropeanEcuadorianEgyptianEnglishEstonianEthiopianEuropeanFijianFilipinoFinnishFrenchFrench American IndianFrench CanadianGermanGerman RussianGhanaianGreekGuamanian/ChamorroGuatemalanGuyaneseHaitianHmongHonduranHopiHoumaHungarianIcelanderIndian (Asian)IndonesianInupiatIranianIraqiIrishIroquoisIsraeliItalianJamaicanJapaneseJordanianKenyanKiowaKoreanLaotianLatvianLebaneseLiberianLithuanianLumbeeLuxembourgerMacedonianMalaysianMalteseMarshalleseMenomineeMexicanMexican American IndianMongolianMoroccanNative HawaiianNavajoNepaleseNew ZealanderNicaraguanNigerianNorthern EuropeanNorwegianOkinawanOsageOttawaPaiutePakistaniPalestinianPanamanianParaguayanPennsylvania GermanPeruvianPimaPolishPortuguesePotawatomiPuebloPuerto RicanPuget Sound SalishRomanianRussianSalvadoranSamoanScandinavianScotch-IrishScottishSeminoleSenegaleseSerbianShoshoneSierra LeoneanSiouxSlavicSlovakSloveneSomaliSouth AfricanSouth AmericanSouth American IndianSoviet UnionSpaniardSpanishSpanish AmericanSpanish American IndianSri LankanSubsaharan AfricanSudaneseSwedishSwissSyrianTaiwaneseThaiTlingit-HaidaTohono O'OdhamTonganTrinidadian and TobagonianTsimshianTurkishU.S. Virgin IslanderUgandanUkrainianUruguayanUteVenezuelanVietnameseWelshWest IndianYakamaYaquiYugoslavianYumanYup'ikZimbabwean
Immigration
NonimmigrantsImmigrantsAfghanistanAfricaAlbaniaArgentinaArmeniaAsiaAustraliaAustriaBahamasBarbadosBelarusBelgiumBelizeBoliviaBosnia and HerzegovinaBrazilBulgariaBurma/MyanmarCabo VerdeCambodiaCameroonCanadaCaribbeanCentral AmericaChileChinaColombiaCongoCosta RicaCroatiaCubaCzechoslovakiaDenmarkDominicaDominican RepublicEastern AfricaEastern AsiaEastern EuropeEcuadorEgyptEl SalvadorEnglandEritreaEthiopiaEuropeFijiFranceGermanyGhanaGreeceGrenadaGuatemalaGuyanaHaitiHondurasHong KongHungaryIndiaIndonesiaIranIraqIrelandIsraelItalyJamaicaJapanJordanKazakhstanKenyaKoreaKuwaitLaosLatin AmericaLatviaLebanonLiberiaLithuaniaMalaysiaMexicoMicronesiaMiddle AfricaMoldovaMoroccoNepalNetherlandsNicaraguaNigeriaNorth AmericaNorth MacedoniaNorthern AfricaNorthern EuropeNorwayOceaniaPakistanPanamaPeruPhilippinesPolandPortugalRomaniaRussiaSaudi ArabiaScotlandSenegalSerbiaSierra LeoneSingaporeSomaliaSouth AfricaSouth AmericaSouth Central AsiaSouth Eastern AsiaSouthern EuropeSpainSri LankaSt. Vincent and the GrenadinesSudanSwedenSwitzerlandSyriaTaiwanThailandTrinidad and TobagoTurkeyUgandaUkraineUruguayUzbekistanVenezuelaVietnamWest IndiesWestern AfricaWestern AsiaWestern EuropeYemenZaireZimbabweAzores
Immigrants from Bangladesh
Race
Ancestry
AfghanAfricanAlaska NativeAlaskan AthabascanAlbanianAleutAlsatianAmericanApacheArabArapahoArgentineanArmenianAssyrian/Chaldean/SyriacAustralianAustrianBahamianBangladeshiBarbadianBasqueBelgianBelizeanBermudanBhutaneseBlackfeetBolivianBrazilianBritishBritish West IndianBulgarianBurmeseCajunCambodianCanadianCape VerdeanCarpatho RusynCelticCentral AmericanCentral American IndianCherokeeCheyenneChickasawChileanChineseChippewaChoctawColombianColvilleComancheCosta RicanCreeCreekCroatianCrowCubanCypriotCzechCzechoslovakianDanishDelawareDominicanDutchDutch West IndianEastern EuropeanEcuadorianEgyptianEnglishEstonianEthiopianEuropeanFijianFilipinoFinnishFrenchFrench American IndianFrench CanadianGermanGerman RussianGhanaianGreekGuamanian/ChamorroGuatemalanGuyaneseHaitianHmongHonduranHopiHoumaHungarianIcelanderIndian (Asian)IndonesianInupiatIranianIraqiIrishIroquoisIsraeliItalianJamaicanJapaneseJordanianKenyanKiowaKoreanLaotianLatvianLebaneseLiberianLithuanianLumbeeLuxembourgerMacedonianMalaysianMalteseMarshalleseMenomineeMexicanMexican American IndianMongolianMoroccanNative HawaiianNavajoNepaleseNew ZealanderNicaraguanNigerianNorthern EuropeanNorwegianOkinawanOsageOttawaPaiutePakistaniPalestinianPanamanianParaguayanPennsylvania GermanPeruvianPimaPolishPortuguesePotawatomiPuebloPuerto RicanPuget Sound SalishRomanianRussianSalvadoranSamoanScandinavianScotch-IrishScottishSeminoleSenegaleseSerbianShoshoneSierra LeoneanSiouxSlavicSlovakSloveneSomaliSouth AfricanSouth AmericanSouth American IndianSoviet UnionSpaniardSpanishSpanish AmericanSpanish American IndianSri LankanSubsaharan AfricanSudaneseSwedishSwissSyrianTaiwaneseThaiTlingit-HaidaTohono O'OdhamTonganTrinidadian and TobagonianTsimshianTurkishU.S. Virgin IslanderUgandanUkrainianUruguayanUteVenezuelanVietnameseWelshWest IndianYakamaYaquiYugoslavianYumanYup'ikZimbabwean
Immigration
NonimmigrantsImmigrantsAfghanistanAfricaAlbaniaArgentinaArmeniaAsiaAustraliaAustriaBahamasBangladeshBarbadosBelarusBelgiumBelizeBoliviaBosnia and HerzegovinaBrazilBulgariaBurma/MyanmarCambodiaCameroonCanadaCaribbeanCentral AmericaChileChinaColombiaCongoCosta RicaCroatiaCubaCzechoslovakiaDenmarkDominicaDominican RepublicEastern AfricaEastern AsiaEastern EuropeEcuadorEgyptEl SalvadorEnglandEritreaEthiopiaEuropeFijiFranceGermanyGhanaGreeceGrenadaGuatemalaGuyanaHaitiHondurasHong KongHungaryIndiaIndonesiaIranIraqIrelandIsraelItalyJamaicaJapanJordanKazakhstanKenyaKoreaKuwaitLaosLatin AmericaLatviaLebanonLiberiaLithuaniaMalaysiaMexicoMicronesiaMiddle AfricaMoldovaMoroccoNepalNetherlandsNicaraguaNigeriaNorth AmericaNorth MacedoniaNorthern AfricaNorthern EuropeNorwayOceaniaPakistanPanamaPeruPhilippinesPolandPortugalRomaniaRussiaSaudi ArabiaScotlandSenegalSerbiaSierra LeoneSingaporeSomaliaSouth AfricaSouth AmericaSouth Central AsiaSouth Eastern AsiaSouthern EuropeSpainSri LankaSt. Vincent and the GrenadinesSudanSwedenSwitzerlandSyriaTaiwanThailandTrinidad and TobagoTurkeyUgandaUkraineUruguayUzbekistanVenezuelaVietnamWest IndiesWestern AfricaWestern AsiaWestern EuropeYemenZaireZimbabweAzores
Disability Age Under 5
Income
Poverty
Unemployment
Labor Participation
Family Structure
Vehicle Availability
Education Level
Disability

Disability Age Under 5 Comparison

Immigrants from Cabo Verde

Immigrants from Bangladesh

Tragic
Exceptional
1.7%
DISABILITY AGE UNDER 5
0.0/ 100
METRIC RATING
316th/ 347
METRIC RANK
0.85%
DISABILITY AGE UNDER 5
100.0/ 100
METRIC RATING
5th/ 347
METRIC RANK

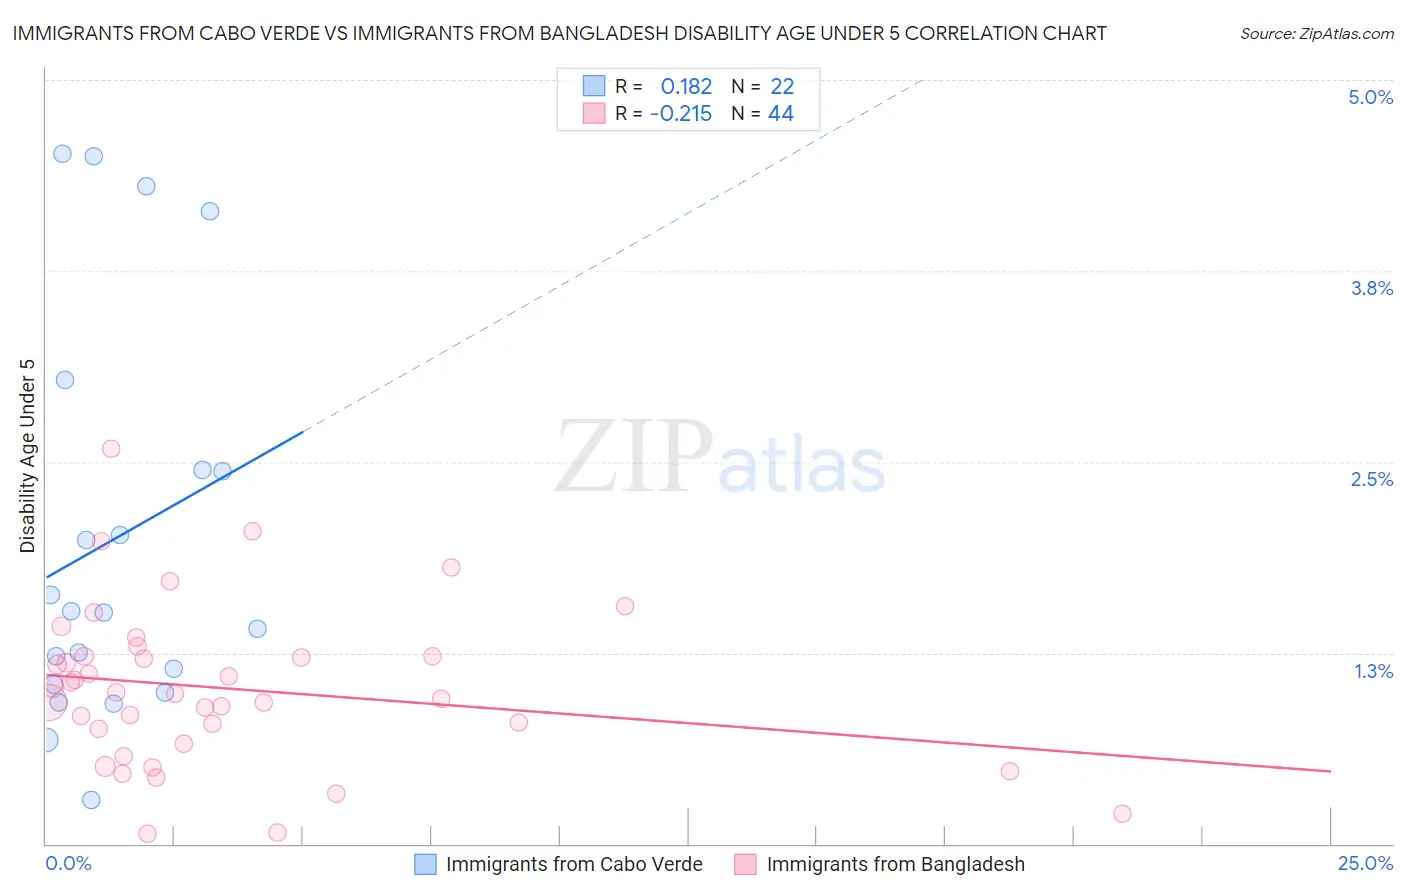
Immigrants from Cabo Verde vs Immigrants from Bangladesh Disability Age Under 5 Correlation Chart

The statistical analysis conducted on geographies consisting of 31,314,274 people shows a poor positive correlation between the proportion of Immigrants from Cabo Verde and percentage of population with a disability under the age of 5 in the United States with a correlation coefficient (R) of 0.182 and weighted average of 1.7%. Similarly, the statistical analysis conducted on geographies consisting of 131,826,697 people shows a weak negative correlation between the proportion of Immigrants from Bangladesh and percentage of population with a disability under the age of 5 in the United States with a correlation coefficient (R) of -0.215 and weighted average of 0.85%, a difference of 97.4%.
Immigrants from Cabo Verde vs Immigrants from Bangladesh Disability Age Under 5

Disability Age Under 5 Correlation Summary

MeasurementImmigrants from Cabo VerdeImmigrants from Bangladesh
Minimum0.28%0.063%
Maximum4.5%2.6%
Range4.2%2.5%
Mean2.0%1.0%
Median1.5%0.99%
Interquartile 25% (IQ1)1.0%0.70%
Interquartile 75% (IQ3)2.4%1.2%
Interquartile Range (IQR)1.4%0.53%
Standard Deviation (Sample)1.3%0.52%
Standard Deviation (Population)1.3%0.52%

Similar Demographics by Disability Age Under 5

Demographics Similar to Immigrants from Cabo Verde by Disability Age Under 5

In terms of disability age under 5, the demographic groups most similar to Immigrants from Cabo Verde are Dutch (1.7%, a difference of 0.18%), French (1.7%, a difference of 0.42%), Norwegian (1.7%, a difference of 0.44%), Celtic (1.7%, a difference of 0.60%), and Irish (1.7%, a difference of 0.69%).
DemographicsRating | RankDisability Age Under 5
Cape Verdeans
0.0
/100
|
#309
Tragic
1.7%
Whites/Caucasians
0.0
/100
|
#310
Tragic
1.7%
English
0.0
/100
|
#311
Tragic
1.7%
Puerto Ricans
0.0
/100
|
#312
Tragic
1.7%
Celtics
0.0
/100
|
#313
Tragic
1.7%
Norwegians
0.0
/100
|
#314
Tragic
1.7%
Dutch
0.0
/100
|
#315
Tragic
1.7%
Immigrants | Cabo Verde
0.0
/100
|
#316
Tragic
1.7%
French
0.0
/100
|
#317
Tragic
1.7%
Irish
0.0
/100
|
#318
Tragic
1.7%
Slovaks
0.0
/100
|
#319
Tragic
1.7%
Scotch-Irish
0.0
/100
|
#320
Tragic
1.7%
Ottawa
0.0
/100
|
#321
Tragic
1.7%
Germans
0.0
/100
|
#322
Tragic
1.7%
Chickasaw
0.0
/100
|
#323
Tragic
1.7%

Demographics Similar to Immigrants from Bangladesh by Disability Age Under 5

In terms of disability age under 5, the demographic groups most similar to Immigrants from Bangladesh are Immigrants from Uzbekistan (0.85%, a difference of 0.41%), Ute (0.86%, a difference of 0.93%), Vietnamese (0.81%, a difference of 5.0%), Immigrants from Afghanistan (0.91%, a difference of 6.3%), and Immigrants from Yemen (0.91%, a difference of 6.4%).
DemographicsRating | RankDisability Age Under 5
Immigrants | Armenia
100.0
/100
|
#1
Exceptional
0.76%
Immigrants | St. Vincent and the Grenadines
100.0
/100
|
#2
Exceptional
0.79%
Vietnamese
100.0
/100
|
#3
Exceptional
0.81%
Immigrants | Uzbekistan
100.0
/100
|
#4
Exceptional
0.85%
Immigrants | Bangladesh
100.0
/100
|
#5
Exceptional
0.85%
Ute
100.0
/100
|
#6
Exceptional
0.86%
Immigrants | Afghanistan
100.0
/100
|
#7
Exceptional
0.91%
Immigrants | Yemen
100.0
/100
|
#8
Exceptional
0.91%
Immigrants | Fiji
100.0
/100
|
#9
Exceptional
0.92%
Marshallese
100.0
/100
|
#10
Exceptional
0.94%
Afghans
100.0
/100
|
#11
Exceptional
0.94%
Immigrants | Grenada
100.0
/100
|
#12
Exceptional
0.94%
Soviet Union
100.0
/100
|
#13
Exceptional
0.95%
Yuman
100.0
/100
|
#14
Exceptional
0.95%
Immigrants | Hong Kong
100.0
/100
|
#15
Exceptional
0.95%