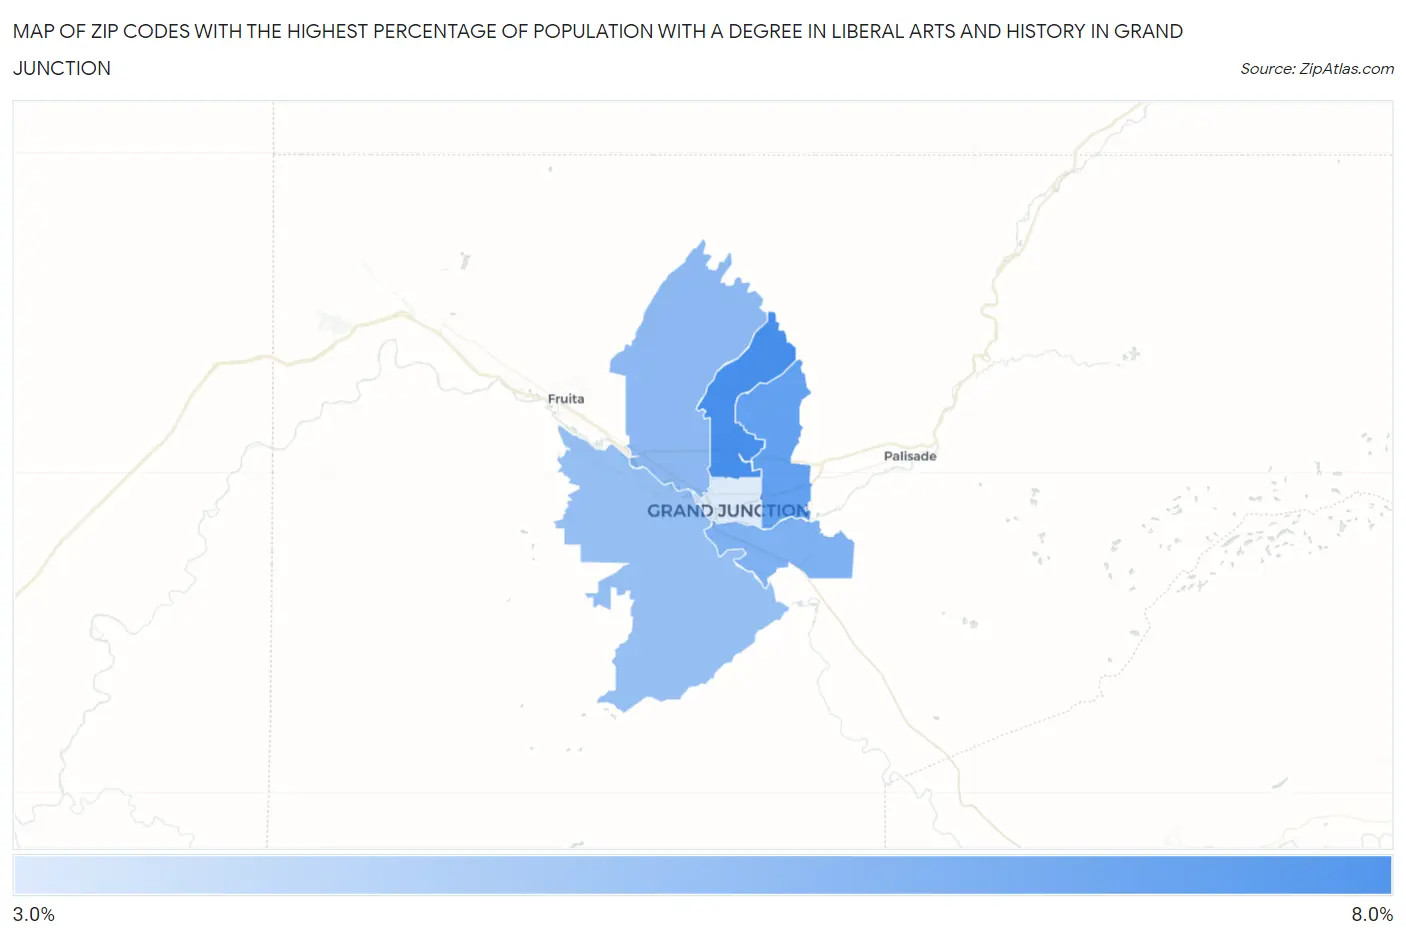
Zip Codes with the Highest Percentage of Population with a Degree in Liberal Arts and History in Grand Junction, CO
RELATED REPORTS & OPTIONS
Liberal Arts and History
Grand Junction
Compare Zip Codes
Map of Zip Codes with the Highest Percentage of Population with a Degree in Liberal Arts and History in Grand Junction
3.1%
6.3%
Zip Codes with the Highest Percentage of Population with a Degree in Liberal Arts and History in Grand Junction, CO
| Zip Code | % Graduates | vs State | vs National | |
| 1. | 81506 | 6.3% | 4.6%(+1.70)#95 | 4.9%(+1.46)#7,704 |
| 2. | 81504 | 5.7% | 4.6%(+1.10)#118 | 4.9%(+0.858)#9,215 |
| 3. | 81503 | 5.2% | 4.6%(+0.519)#147 | 4.9%(+0.278)#10,873 |
| 4. | 81505 | 4.9% | 4.6%(+0.224)#161 | 4.9%(-0.018)#11,799 |
| 5. | 81507 | 4.6% | 4.6%(+0.008)#175 | 4.9%(-0.233)#12,521 |
| 6. | 81501 | 3.1% | 4.6%(-1.53)#294 | 4.9%(-1.77)#17,994 |
1
Common Questions
What are the Top 5 Zip Codes with the Highest Percentage of Population with a Degree in Liberal Arts and History in Grand Junction, CO?
Top 5 Zip Codes with the Highest Percentage of Population with a Degree in Liberal Arts and History in Grand Junction, CO are:
What zip code has the Highest Percentage of Population with a Degree in Liberal Arts and History in Grand Junction, CO?
81506 has the Highest Percentage of Population with a Degree in Liberal Arts and History in Grand Junction, CO with 6.3%.
What is the Percentage of Population with a Degree in Liberal Arts and History in Grand Junction, CO?
Percentage of Population with a Degree in Liberal Arts and History in Grand Junction is 4.7%.
What is the Percentage of Population with a Degree in Liberal Arts and History in Colorado?
Percentage of Population with a Degree in Liberal Arts and History in Colorado is 4.6%.
What is the Percentage of Population with a Degree in Liberal Arts and History in the United States?
Percentage of Population with a Degree in Liberal Arts and History in the United States is 4.9%.