Zip Codes with the Highest Percentage of Population with a Degree in Liberal Arts and History in Fort Collins, CO
RELATED REPORTS & OPTIONS
Liberal Arts and History
Fort Collins
Compare Zip Codes
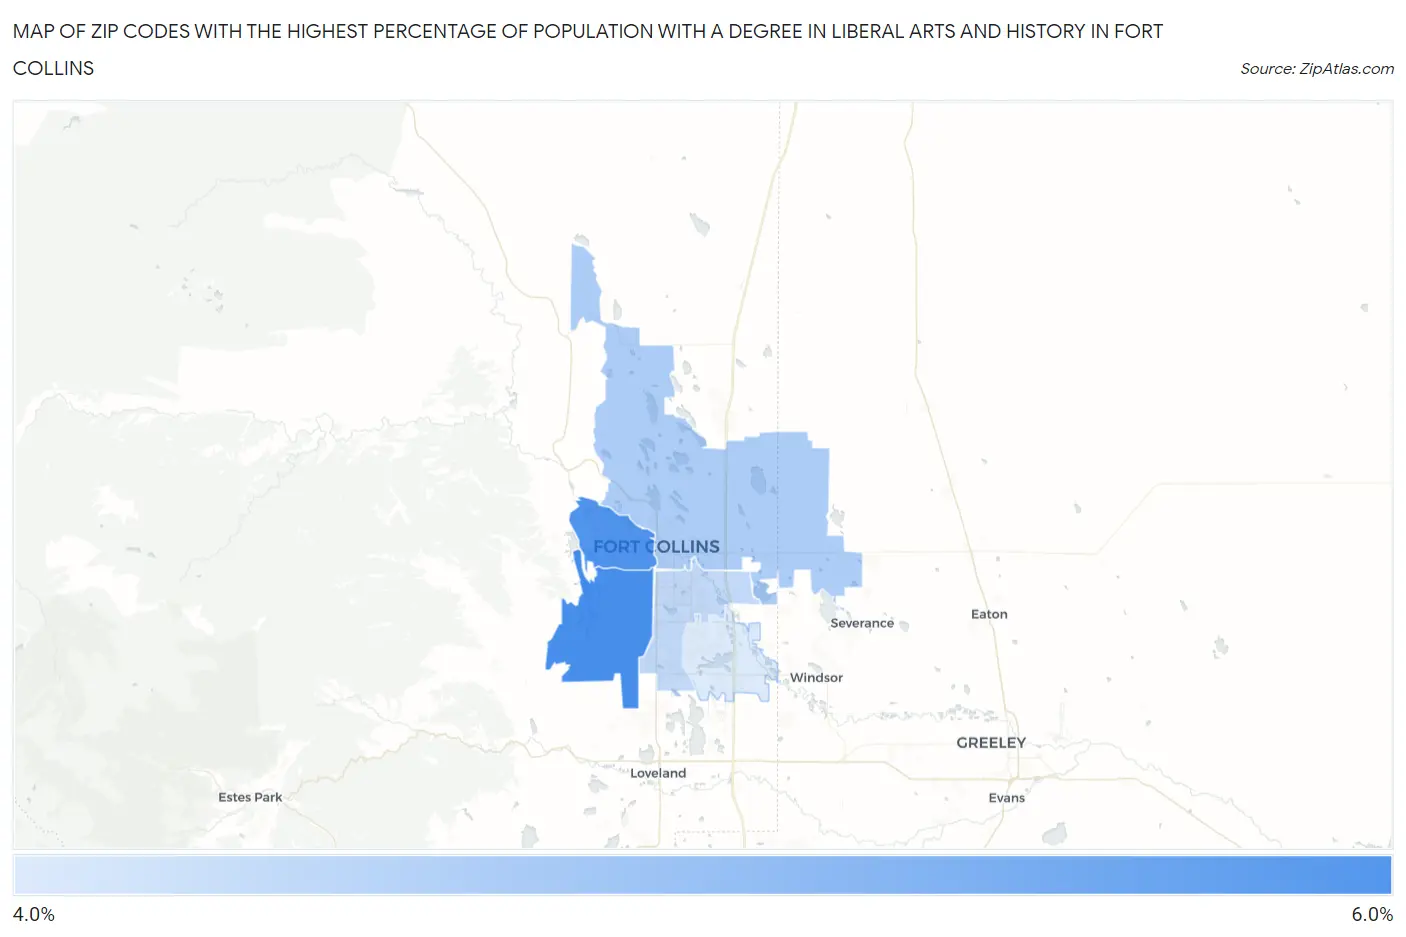
Map of Zip Codes with the Highest Percentage of Population with a Degree in Liberal Arts and History in Fort Collins
4.2%
5.4%
Zip Codes with the Highest Percentage of Population with a Degree in Liberal Arts and History in Fort Collins, CO
| Zip Code | % Graduates | vs State | vs National | |
| 1. | 80526 | 5.4% | 4.6%(+0.788)#132 | 4.9%(+0.547)#10,089 |
| 2. | 80521 | 5.4% | 4.6%(+0.733)#135 | 4.9%(+0.491)#10,230 |
| 3. | 80524 | 4.6% | 4.6%(-0.066)#178 | 4.9%(-0.308)#12,749 |
| 4. | 80525 | 4.4% | 4.6%(-0.231)#193 | 4.9%(-0.472)#13,293 |
| 5. | 80528 | 4.2% | 4.6%(-0.460)#210 | 4.9%(-0.701)#14,125 |
1
Common Questions
What are the Top 3 Zip Codes with the Highest Percentage of Population with a Degree in Liberal Arts and History in Fort Collins, CO?
Top 3 Zip Codes with the Highest Percentage of Population with a Degree in Liberal Arts and History in Fort Collins, CO are:
What zip code has the Highest Percentage of Population with a Degree in Liberal Arts and History in Fort Collins, CO?
80526 has the Highest Percentage of Population with a Degree in Liberal Arts and History in Fort Collins, CO with 5.4%.
What is the Percentage of Population with a Degree in Liberal Arts and History in Fort Collins, CO?
Percentage of Population with a Degree in Liberal Arts and History in Fort Collins is 4.9%.
What is the Percentage of Population with a Degree in Liberal Arts and History in Colorado?
Percentage of Population with a Degree in Liberal Arts and History in Colorado is 4.6%.
What is the Percentage of Population with a Degree in Liberal Arts and History in the United States?
Percentage of Population with a Degree in Liberal Arts and History in the United States is 4.9%.