Zip Codes with the Highest Percentage of Population Employed in Food Preparation & Serving in Pueblo, CO
RELATED REPORTS & OPTIONS
Food Preparation & Serving
Pueblo
Compare Zip Codes
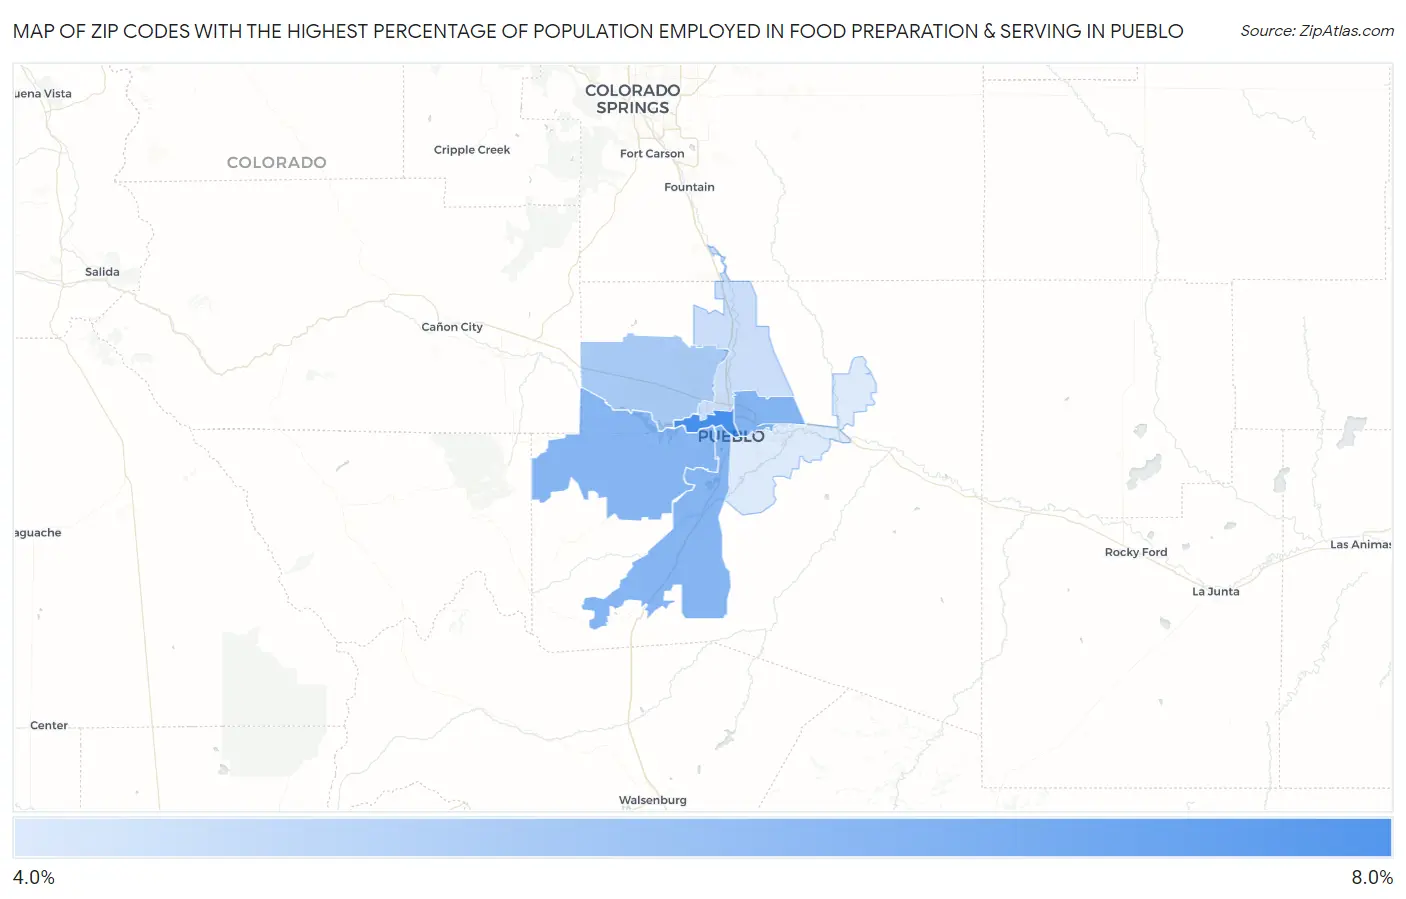
Map of Zip Codes with the Highest Percentage of Population Employed in Food Preparation & Serving in Pueblo
4.1%
7.4%
Zip Codes with the Highest Percentage of Population Employed in Food Preparation & Serving in Pueblo, CO
| Zip Code | % Employed | vs State | vs National | |
| 1. | 81003 | 7.4% | 5.2%(+2.22)#86 | 5.3%(+2.12)#5,741 |
| 2. | 81001 | 6.1% | 5.2%(+0.875)#131 | 5.3%(+0.770)#9,155 |
| 3. | 81004 | 6.0% | 5.2%(+0.838)#137 | 5.3%(+0.734)#9,282 |
| 4. | 81005 | 6.0% | 5.2%(+0.828)#138 | 5.3%(+0.724)#9,313 |
| 5. | 81007 | 5.3% | 5.2%(+0.074)#181 | 5.3%(-0.031)#11,942 |
| 6. | 81008 | 4.5% | 5.2%(-0.704)#229 | 5.3%(-0.808)#15,110 |
| 7. | 81006 | 4.1% | 5.2%(-1.11)#255 | 5.3%(-1.21)#16,818 |
1
Common Questions
What are the Top 5 Zip Codes with the Highest Percentage of Population Employed in Food Preparation & Serving in Pueblo, CO?
Top 5 Zip Codes with the Highest Percentage of Population Employed in Food Preparation & Serving in Pueblo, CO are:
What zip code has the Highest Percentage of Population Employed in Food Preparation & Serving in Pueblo, CO?
81003 has the Highest Percentage of Population Employed in Food Preparation & Serving in Pueblo, CO with 7.4%.
What is the Percentage of Population Employed in Food Preparation & Serving in Pueblo, CO?
Percentage of Population Employed in Food Preparation & Serving in Pueblo is 5.9%.
What is the Percentage of Population Employed in Food Preparation & Serving in Colorado?
Percentage of Population Employed in Food Preparation & Serving in Colorado is 5.2%.
What is the Percentage of Population Employed in Food Preparation & Serving in the United States?
Percentage of Population Employed in Food Preparation & Serving in the United States is 5.3%.