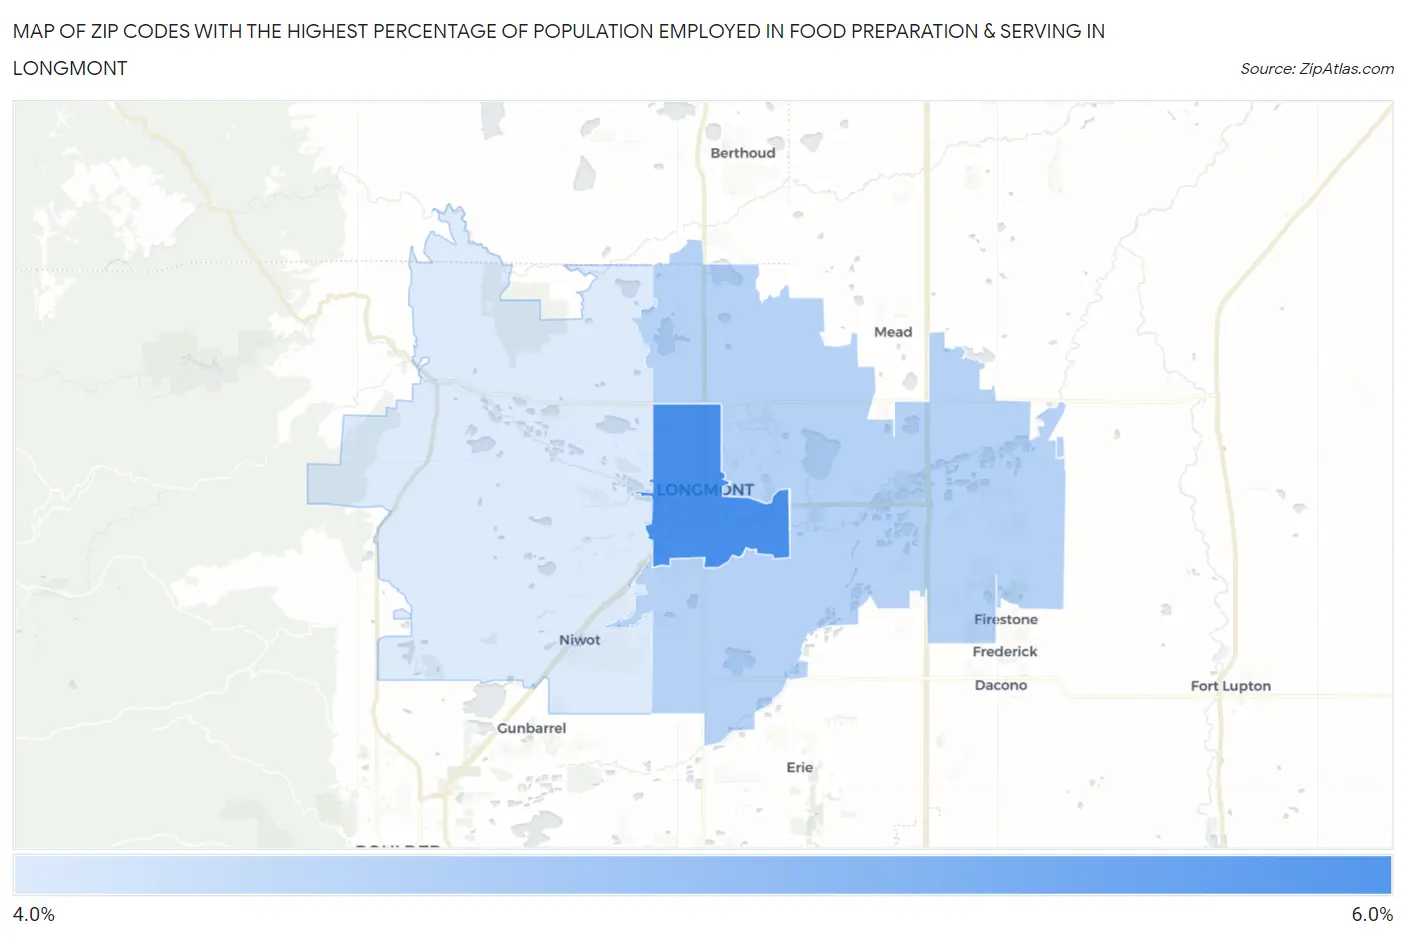
Zip Codes with the Highest Percentage of Population Employed in Food Preparation & Serving in Longmont, CO
RELATED REPORTS & OPTIONS
Food Preparation & Serving
Longmont
Compare Zip Codes
Map of Zip Codes with the Highest Percentage of Population Employed in Food Preparation & Serving in Longmont
4.2%
5.4%
Zip Codes with the Highest Percentage of Population Employed in Food Preparation & Serving in Longmont, CO
| Zip Code | % Employed | vs State | vs National | |
| 1. | 80501 | 5.4% | 5.2%(+0.187)#173 | 5.3%(+0.083)#11,515 |
| 2. | 80504 | 4.5% | 5.2%(-0.697)#227 | 5.3%(-0.801)#15,089 |
| 3. | 80503 | 4.2% | 5.2%(-1.02)#248 | 5.3%(-1.12)#16,459 |
1
Common Questions
What are the Top Zip Codes with the Highest Percentage of Population Employed in Food Preparation & Serving in Longmont, CO?
Top Zip Codes with the Highest Percentage of Population Employed in Food Preparation & Serving in Longmont, CO are:
What zip code has the Highest Percentage of Population Employed in Food Preparation & Serving in Longmont, CO?
80501 has the Highest Percentage of Population Employed in Food Preparation & Serving in Longmont, CO with 5.4%.
What is the Percentage of Population Employed in Food Preparation & Serving in Longmont, CO?
Percentage of Population Employed in Food Preparation & Serving in Longmont is 4.8%.
What is the Percentage of Population Employed in Food Preparation & Serving in Colorado?
Percentage of Population Employed in Food Preparation & Serving in Colorado is 5.2%.
What is the Percentage of Population Employed in Food Preparation & Serving in the United States?
Percentage of Population Employed in Food Preparation & Serving in the United States is 5.3%.