Zip Codes with the Highest Percentage of Population Employed in Administrative & Support Services in Longmont, CO
RELATED REPORTS & OPTIONS
Administrative & Support Services
Longmont
Compare Zip Codes
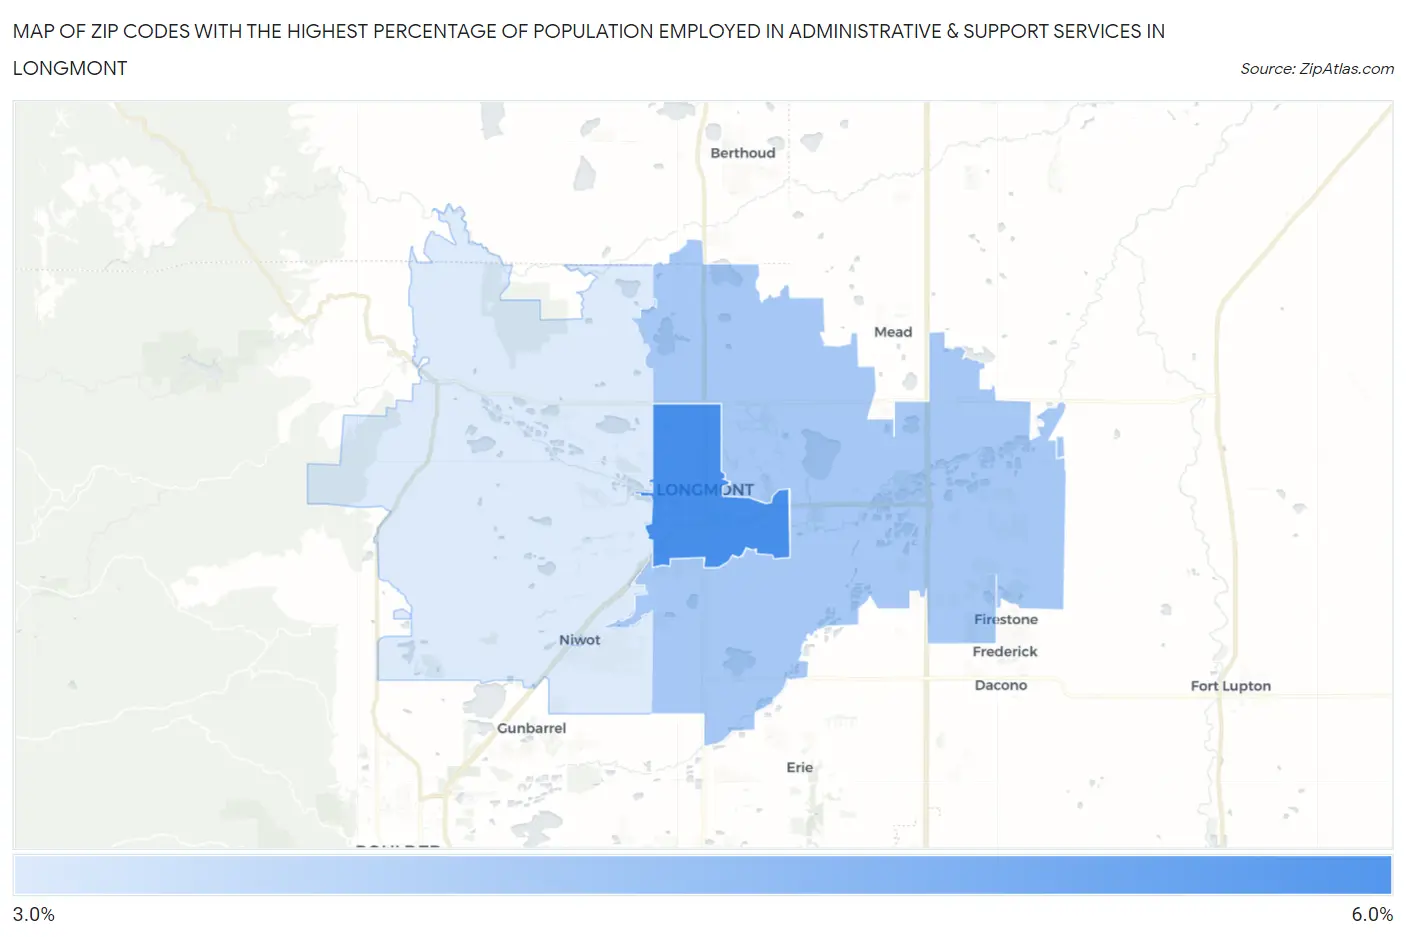
Map of Zip Codes with the Highest Percentage of Population Employed in Administrative & Support Services in Longmont
3.6%
6.0%
Zip Codes with the Highest Percentage of Population Employed in Administrative & Support Services in Longmont, CO
| Zip Code | % Employed | vs State | vs National | |
| 1. | 80501 | 6.0% | 4.1%(+1.86)#74 | 4.1%(+1.80)#4,871 |
| 2. | 80504 | 4.5% | 4.1%(+0.359)#142 | 4.1%(+0.301)#8,879 |
| 3. | 80503 | 3.6% | 4.1%(-0.493)#194 | 4.1%(-0.551)#12,485 |
1
Common Questions
What are the Top Zip Codes with the Highest Percentage of Population Employed in Administrative & Support Services in Longmont, CO?
Top Zip Codes with the Highest Percentage of Population Employed in Administrative & Support Services in Longmont, CO are:
What zip code has the Highest Percentage of Population Employed in Administrative & Support Services in Longmont, CO?
80501 has the Highest Percentage of Population Employed in Administrative & Support Services in Longmont, CO with 6.0%.
What is the Percentage of Population Employed in Administrative & Support Services in Longmont, CO?
Percentage of Population Employed in Administrative & Support Services in Longmont is 4.9%.
What is the Percentage of Population Employed in Administrative & Support Services in Colorado?
Percentage of Population Employed in Administrative & Support Services in Colorado is 4.1%.
What is the Percentage of Population Employed in Administrative & Support Services in the United States?
Percentage of Population Employed in Administrative & Support Services in the United States is 4.1%.