Zip Codes with the Highest Poverty Level Among Children Under the Age of 5 in Colorado Springs, CO

RELATED REPORTS & OPTIONS

Highest Poverty | Child 0-5
Population
Families and Households
Female Fertility
Female Fertility (Unmarried)
Race (Community Size)
Race (Percentage)
Ancestry (Community Size)
AfghanAfricanAlaskan AthabascanAlbanianAlsatianAmericanApacheArabArapahoArgentineanArmenianAustralianAustrianBangladeshiBarbadianBasqueBelgianBelizeanBermudanBhutaneseBlackfeetBolivianBrazilianBritishBritish West IndianBulgarianBurmeseCajunCambodianCanadianCape VerdeanCarpatho RusynCelticCentral AmericanCentral American IndianCherokeeCheyenneChickasawChileanChineseChippewaChoctawColombianComancheCosta RicanCreeCreekCroatianCubanCzechCzechoslovakianDanishDelawareDominicanDutchEastern EuropeanEcuadorianEgyptianEnglishEstonianEthiopianEuropeanFilipinoFinnishFrenchFrench CanadianGermanGerman RussianGhanaianGreekGuamanian / ChamorroGuatemalanHaitianHonduranHopiHungarianIcelanderIndian (Asian)IndonesianInupiatIranianIraqiIrishIroquoisIsraeliItalianJamaicanJapaneseJordanianKenyanKoreanLaotianLatvianLebaneseLiberianLithuanianLuxembourgerMacedonianMalaysianMexicanMexican American IndianNative HawaiianNavajoNew ZealanderNicaraguanNigerianNorthern EuropeanNorwegianOkinawanOsagePakistaniPalestinianPanamanianPennsylvania GermanPeruvianPolishPortuguesePotawatomiPuebloPuerto RicanRomanianRussianSalvadoranSamoanScandinavianScotch-IrishScottishSeminoleSerbianShoshoneSiouxSlavicSlovakSloveneSomaliSouth AfricanSouth AmericanSouth American IndianSpaniardSpanishSpanish AmericanSpanish American IndianSri LankanSubsaharan AfricanSudaneseSwedishSwissSyrianThaiTohono O'OdhamTrinidadian and TobagonianTurkishUkrainianUteVenezuelanWelshWest IndianYaquiYugoslavian
Ancestry (Percentage)
AfghanAfricanAlaskan AthabascanAlbanianAlsatianAmericanApacheArabArapahoArgentineanArmenianAustralianAustrianBangladeshiBarbadianBasqueBelgianBelizeanBermudanBhutaneseBlackfeetBolivianBrazilianBritishBritish West IndianBulgarianBurmeseCajunCambodianCanadianCape VerdeanCarpatho RusynCelticCentral AmericanCentral American IndianCherokeeCheyenneChickasawChileanChineseChippewaChoctawColombianComancheCosta RicanCreeCreekCroatianCubanCzechCzechoslovakianDanishDelawareDominicanDutchEastern EuropeanEcuadorianEgyptianEnglishEstonianEthiopianEuropeanFilipinoFinnishFrenchFrench CanadianGermanGerman RussianGhanaianGreekGuamanian / ChamorroGuatemalanHaitianHonduranHopiHungarianIcelanderIndian (Asian)IndonesianInupiatIranianIraqiIrishIroquoisIsraeliItalianJamaicanJapaneseJordanianKenyanKoreanLaotianLatvianLebaneseLiberianLithuanianLuxembourgerMacedonianMalaysianMexicanMexican American IndianNative HawaiianNavajoNew ZealanderNicaraguanNigerianNorthern EuropeanNorwegianOkinawanOsagePakistaniPalestinianPanamanianPennsylvania GermanPeruvianPolishPortuguesePotawatomiPuebloPuerto RicanRomanianRussianSalvadoranSamoanScandinavianScotch-IrishScottishSeminoleSerbianShoshoneSiouxSlavicSlovakSloveneSomaliSouth AfricanSouth AmericanSouth American IndianSpaniardSpanishSpanish AmericanSpanish American IndianSri LankanSubsaharan AfricanSudaneseSwedishSwissSyrianThaiTohono O'OdhamTrinidadian and TobagonianTurkishUkrainianUteVenezuelanWelshWest IndianYaquiYugoslavian
Immigrant Origin (Total)
AfghanistanAfricaArgentinaArmeniaAsiaAustraliaAustriaBangladeshBarbadosBelarusBoliviaBosnia and HerzegovinaBrazilBulgariaBurma / MyanmarCambodiaCameroonCanadaCaribbeanCentral AmericaChileChinaColombiaCosta RicaCroatiaCubaCzechoslovakiaDenmarkDominican RepublicEastern AfricaEastern AsiaEastern EuropeEcuadorEgyptEl SalvadorEnglandEritreaEthiopiaEuropeFranceGermanyGhanaGuatemalaGuyanaHaitiHondurasHong KongHungaryIndiaIndonesiaIranIraqIrelandIsraelItalyJamaicaJapanKazakhstanKenyaKoreaLaosLatin AmericaLebanonLiberiaLithuaniaMexicoMiddle AfricaMoldovaNepalNetherlandsNicaraguaNigeriaNorth MacedoniaNorthern AfricaNorthern EuropeNorwayOceaniaPakistanPanamaPeruPhilippinesPolandRomaniaRussiaScotlandSingaporeSomaliaSouth AfricaSouth AmericaSouth Central AsiaSouth Eastern AsiaSouthern EuropeSpainSt. Vincent and the GrenadinesSwedenSwitzerlandSyriaTaiwanThailandTrinidad and TobagoTurkeyUgandaUkraineUzbekistanVenezuelaVietnamWest IndiesWestern AfricaWestern AsiaWestern EuropeZaireZimbabwe
Immigrant Origin (Percentage)
AfghanistanAfricaArgentinaArmeniaAsiaAustraliaAustriaBangladeshBarbadosBelarusBoliviaBosnia and HerzegovinaBrazilBulgariaBurma / MyanmarCambodiaCameroonCanadaCaribbeanCentral AmericaChileChinaColombiaCosta RicaCroatiaCubaCzechoslovakiaDenmarkDominican RepublicEastern AfricaEastern AsiaEastern EuropeEcuadorEgyptEl SalvadorEnglandEritreaEthiopiaEuropeFranceGermanyGhanaGuatemalaGuyanaHaitiHondurasHong KongHungaryIndiaIndonesiaIranIraqIrelandIsraelItalyJamaicaJapanKazakhstanKenyaKoreaLaosLatin AmericaLebanonLiberiaLithuaniaMexicoMiddle AfricaMoldovaNepalNetherlandsNicaraguaNigeriaNorth MacedoniaNorthern AfricaNorthern EuropeNorwayOceaniaPakistanPanamaPeruPhilippinesPolandRomaniaRussiaScotlandSingaporeSomaliaSouth AfricaSouth AmericaSouth Central AsiaSouth Eastern AsiaSouthern EuropeSpainSt. Vincent and the GrenadinesSwedenSwitzerlandSyriaTaiwanThailandTrinidad and TobagoTurkeyUgandaUkraineUzbekistanVenezuelaVietnamWest IndiesWestern AfricaWestern AsiaWestern EuropeZaireZimbabwe
Income
Income (Families)
Income (Households)
Poverty
Poverty (Families)
Unemployment
Employment Occupations
Employment Industries
Employer Class
Commute Time
Commute Means
School Enrollment
Education by Degree Field
Occupancy
Finances
Physical Characteristics
Colorado Springs
Compare Zip Codes
Comparison Subject

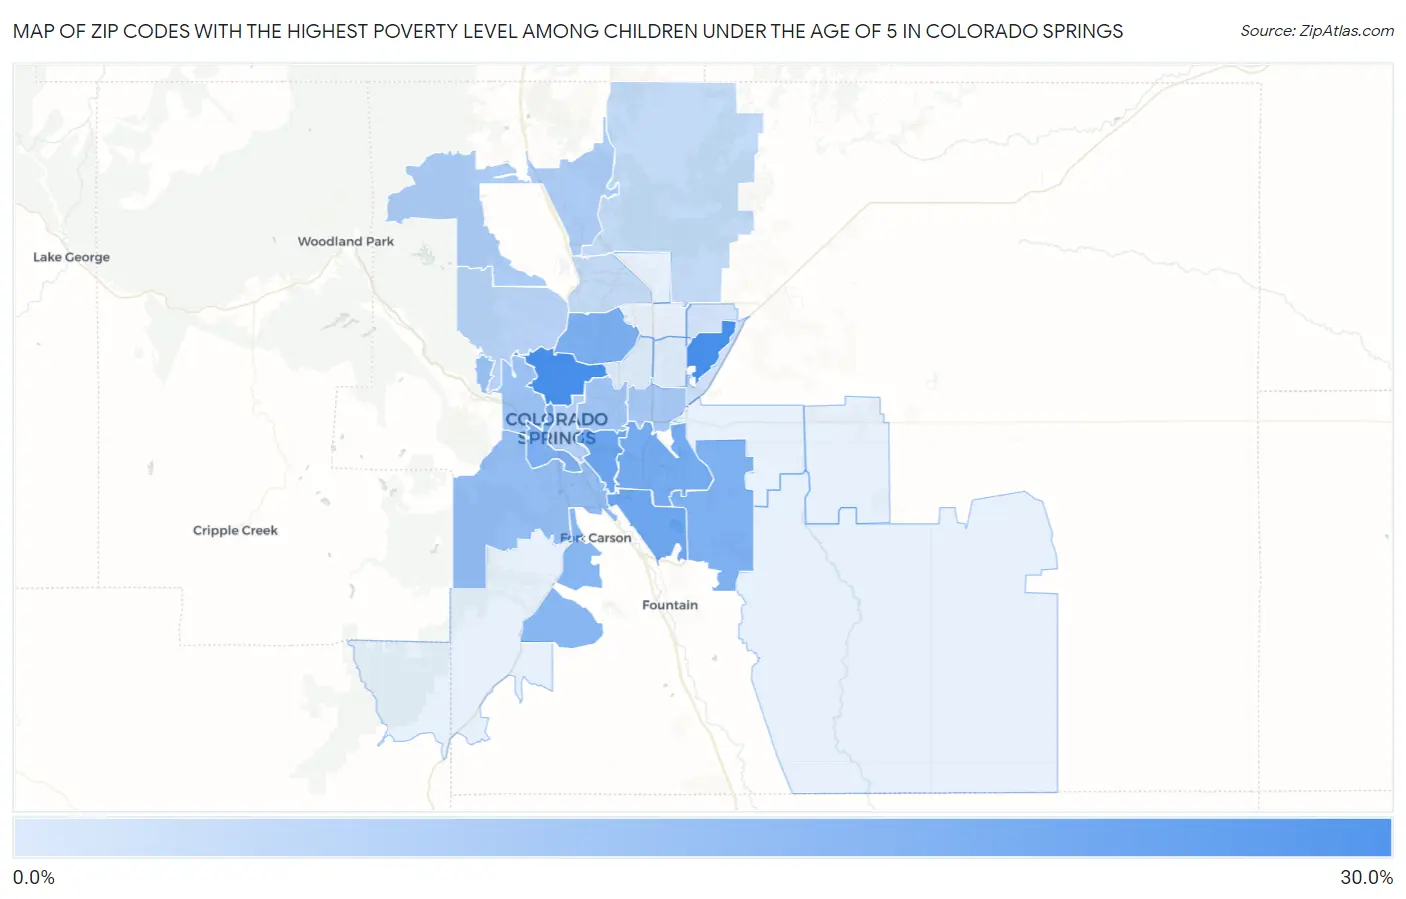
Map of Zip Codes with the Highest Poverty Level Among Children Under the Age of 5 in Colorado Springs

0.0%
30.0%
Zip Codes with the Highest Poverty Level Among Children Under the Age of 5 in Colorado Springs Map

Zip Codes with the Highest Poverty Level Among Children Under the Age of 5 in Colorado Springs, CO

Zip Code Child Poverty vs State vs National
1.8090728.5%11.9%(+16.6)#5718.1%(+10.4)#6,831
2.8093828.4%11.9%(+16.5)#5818.1%(+10.4)#6,846
3.8091021.5%11.9%(+9.58)#8618.1%(+3.40)#9,403
4.8091120.6%11.9%(+8.76)#9518.1%(+2.58)#9,746
5.8091619.8%11.9%(+7.88)#10118.1%(+1.69)#10,155
6.8091818.1%11.9%(+6.25)#11018.1%(+0.061)#10,905
7.8090518.0%11.9%(+6.10)#11118.1%(-0.088)#10,968
8.8092517.9%11.9%(+5.98)#11218.1%(-0.206)#11,022
9.8090216.1%11.9%(+4.25)#12318.1%(-1.93)#11,842
10.8090614.2%11.9%(+2.30)#13618.1%(-3.88)#12,940
11.8090412.8%11.9%(+0.922)#14618.1%(-5.26)#13,743
12.8090911.7%11.9%(-0.145)#15618.1%(-6.33)#14,381
13.8091510.9%11.9%(-0.976)#16418.1%(-7.16)#14,897
14.809219.6%11.9%(-2.31)#18018.1%(-8.49)#15,654
15.809038.4%11.9%(-3.45)#19318.1%(-9.63)#16,470
16.809197.8%11.9%(-4.08)#20118.1%(-10.3)#16,877
17.809206.0%11.9%(-5.91)#21918.1%(-12.1)#18,095
18.809085.8%11.9%(-6.05)#22218.1%(-12.2)#18,204
19.809514.1%11.9%(-7.79)#24318.1%(-14.0)#19,439
20.809273.5%11.9%(-8.35)#25018.1%(-14.5)#19,832
21.809171.7%11.9%(-10.2)#26718.1%(-16.3)#21,017
22.809221.7%11.9%(-10.2)#26818.1%(-16.4)#21,029

Common Questions

What are the Top 10 Zip Codes with the Highest Poverty Level Among Children Under the Age of 5 in Colorado Springs, CO?
Top 10 Zip Codes with the Highest Poverty Level Among Children Under the Age of 5 in Colorado Springs, CO are:
#1
28.5%
#2
28.4%
#3
21.5%
#4
20.6%
#5
19.8%
#6
18.1%
#7
18.0%
#8
17.9%
#9
16.1%
#10
14.2%
What zip code has the Highest Poverty Level Among Children Under the Age of 5 in Colorado Springs, CO?
80907 has the Highest Poverty Level Among Children Under the Age of 5 in Colorado Springs, CO with 28.5%.
What is the Poverty Level Among Children Under the Age of 5 in Colorado Springs, CO?
Poverty Level Among Children Under the Age of 5 in Colorado Springs is 11.6%.
What is the Poverty Level Among Children Under the Age of 5 in Colorado?
Poverty Level Among Children Under the Age of 5 in Colorado is 11.9%.
What is the Poverty Level Among Children Under the Age of 5 in the United States?
Poverty Level Among Children Under the Age of 5 in the United States is 18.1%.