Zip Codes with the Highest Percentage of Population Employed in Community & Social Service in San Jacinto, CA
RELATED REPORTS & OPTIONS
Community & Social Service
San Jacinto
Compare Zip Codes
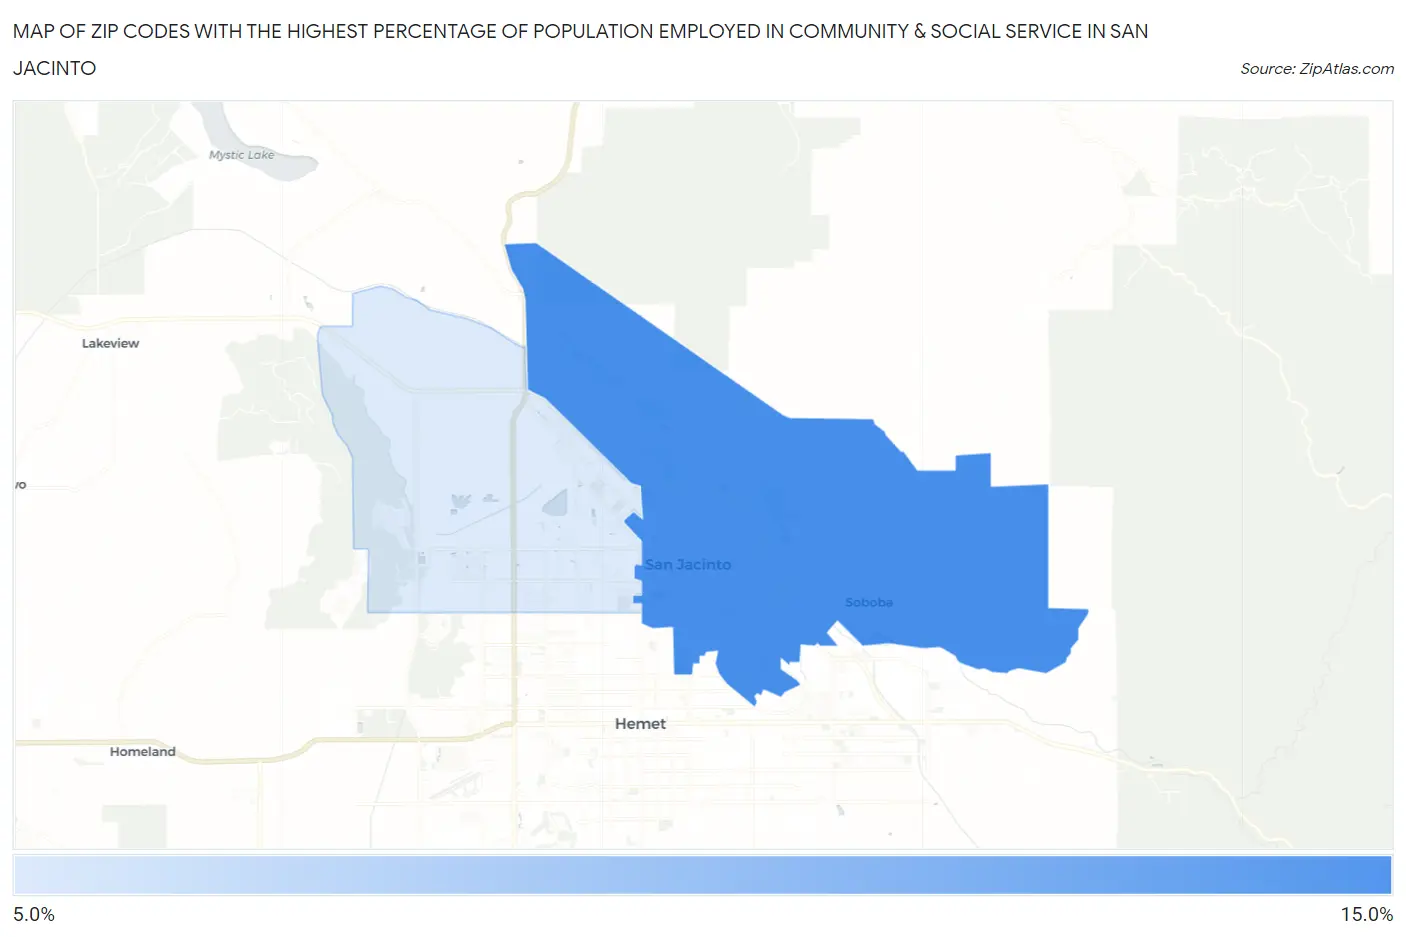
Map of Zip Codes with the Highest Percentage of Population Employed in Community & Social Service in San Jacinto
7.4%
11.7%
Zip Codes with the Highest Percentage of Population Employed in Community & Social Service in San Jacinto, CA
| Zip Code | % Employed | vs State | vs National | |
| 1. | 92583 | 11.7% | 11.5%(+0.241)#697 | 11.2%(+0.511)#9,934 |
| 2. | 92582 | 7.4% | 11.5%(-4.04)#1,228 | 11.2%(-3.77)#21,037 |
1
Common Questions
What are the Top Zip Codes with the Highest Percentage of Population Employed in Community & Social Service in San Jacinto, CA?
Top Zip Codes with the Highest Percentage of Population Employed in Community & Social Service in San Jacinto, CA are:
What zip code has the Highest Percentage of Population Employed in Community & Social Service in San Jacinto, CA?
92583 has the Highest Percentage of Population Employed in Community & Social Service in San Jacinto, CA with 11.7%.
What is the Percentage of Population Employed in Community & Social Service in San Jacinto, CA?
Percentage of Population Employed in Community & Social Service in San Jacinto is 8.4%.
What is the Percentage of Population Employed in Community & Social Service in California?
Percentage of Population Employed in Community & Social Service in California is 11.5%.
What is the Percentage of Population Employed in Community & Social Service in the United States?
Percentage of Population Employed in Community & Social Service in the United States is 11.2%.