San Jacinto, CA Map & Demographics
San Jacinto Map
San Jacinto Overview
$24,560
PER CAPITA INCOME
$79,560
AVG FAMILY INCOME
$73,682
AVG HOUSEHOLD INCOME
21.8%
WAGE / INCOME GAP [ % ]
78.2¢/ $1
WAGE / INCOME GAP [ $ ]
$12,007
FAMILY INCOME DEFICIT
0.40
INEQUALITY / GINI INDEX
54,077
TOTAL POPULATION
27,236
MALE POPULATION
26,841
FEMALE POPULATION
101.47
MALES / 100 FEMALES
98.55
FEMALES / 100 MALES
31.3
MEDIAN AGE
4.2
AVG FAMILY SIZE
3.7
AVG HOUSEHOLD SIZE
23,526
LABOR FORCE [ PEOPLE ]
58.3%
PERCENT IN LABOR FORCE
8.3%
UNEMPLOYMENT RATE
Income in San Jacinto
Income Overview in San Jacinto
Per Capita Income in San Jacinto is $24,560, while median incomes of families and households are $79,560 and $73,682 respectively.
| Characteristic | Number | Measure |
| Per Capita Income | 54,077 | $24,560 |
| Median Family Income | 11,336 | $79,560 |
| Mean Family Income | 11,336 | $90,693 |
| Median Household Income | 14,426 | $73,682 |
| Mean Household Income | 14,426 | $86,727 |
| Income Deficit | 11,336 | $12,007 |
| Wage / Income Gap (%) | 54,077 | 21.81% |
| Wage / Income Gap ($) | 54,077 | 78.19¢ per $1 |
| Gini / Inequality Index | 54,077 | 0.40 |
Earnings by Sex in San Jacinto
Average Earnings in San Jacinto are $39,313, $44,341 for men and $34,672 for women, a difference of 21.8%.
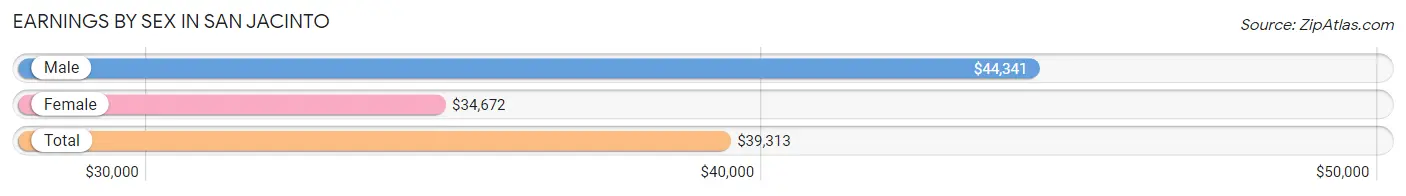
| Sex | Number | Average Earnings |
| Male | 13,415 (57.8%) | $44,341 |
| Female | 9,788 (42.2%) | $34,672 |
| Total | 23,203 (100.0%) | $39,313 |
Earnings by Sex by Income Bracket in San Jacinto
The most common earnings brackets in San Jacinto are $75,000 to $99,999 for men (1,825 | 13.6%) and $75,000 to $99,999 for women (986 | 10.1%).
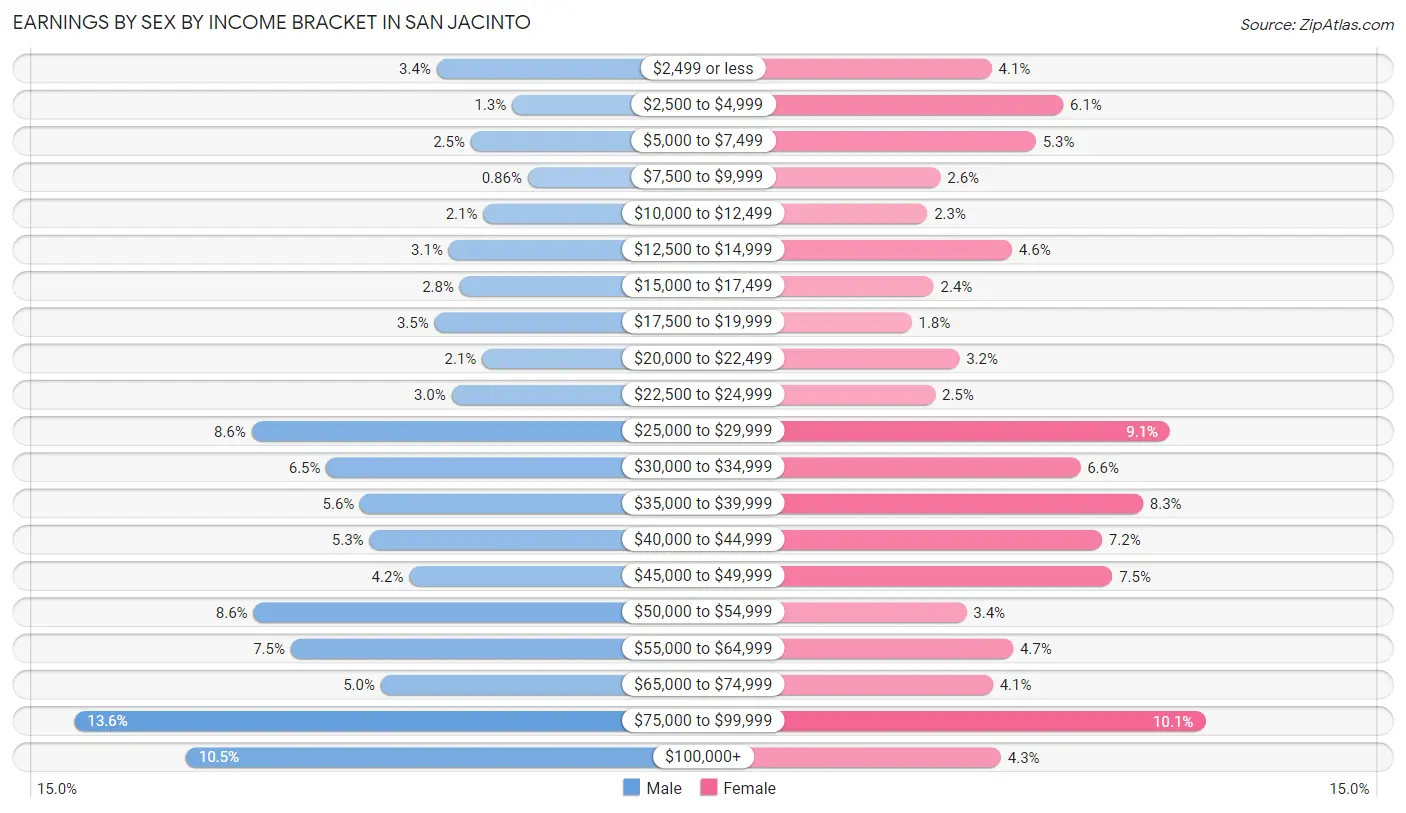
| Income | Male | Female |
| $2,499 or less | 459 (3.4%) | 398 (4.1%) |
| $2,500 to $4,999 | 175 (1.3%) | 595 (6.1%) |
| $5,000 to $7,499 | 330 (2.5%) | 520 (5.3%) |
| $7,500 to $9,999 | 115 (0.9%) | 257 (2.6%) |
| $10,000 to $12,499 | 283 (2.1%) | 221 (2.3%) |
| $12,500 to $14,999 | 413 (3.1%) | 454 (4.6%) |
| $15,000 to $17,499 | 372 (2.8%) | 239 (2.4%) |
| $17,500 to $19,999 | 467 (3.5%) | 178 (1.8%) |
| $20,000 to $22,499 | 287 (2.1%) | 309 (3.2%) |
| $22,500 to $24,999 | 403 (3.0%) | 243 (2.5%) |
| $25,000 to $29,999 | 1,156 (8.6%) | 889 (9.1%) |
| $30,000 to $34,999 | 875 (6.5%) | 642 (6.6%) |
| $35,000 to $39,999 | 747 (5.6%) | 814 (8.3%) |
| $40,000 to $44,999 | 712 (5.3%) | 702 (7.2%) |
| $45,000 to $49,999 | 562 (4.2%) | 730 (7.5%) |
| $50,000 to $54,999 | 1,150 (8.6%) | 329 (3.4%) |
| $55,000 to $64,999 | 1,009 (7.5%) | 457 (4.7%) |
| $65,000 to $74,999 | 670 (5.0%) | 401 (4.1%) |
| $75,000 to $99,999 | 1,825 (13.6%) | 986 (10.1%) |
| $100,000+ | 1,405 (10.5%) | 424 (4.3%) |
| Total | 13,415 (100.0%) | 9,788 (100.0%) |
Earnings by Sex by Educational Attainment in San Jacinto
Average earnings in San Jacinto are $50,868 for men and $38,569 for women, a difference of 24.2%. Men with an educational attainment of graduate degree enjoy the highest average annual earnings of $89,044, while those with less than high school education earn the least with $36,058. Women with an educational attainment of graduate degree earn the most with the average annual earnings of $81,483, while those with high school diploma education have the smallest earnings of $33,839.
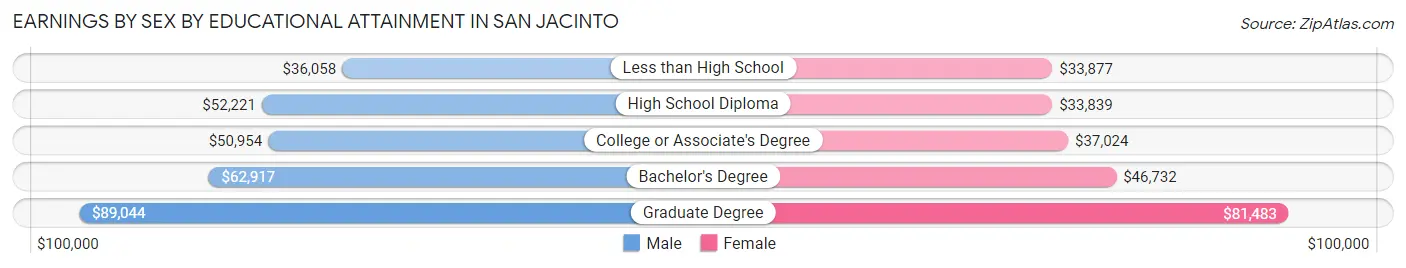
| Educational Attainment | Male Income | Female Income |
| Less than High School | $36,058 | $33,877 |
| High School Diploma | $52,221 | $33,839 |
| College or Associate's Degree | $50,954 | $37,024 |
| Bachelor's Degree | $62,917 | $46,732 |
| Graduate Degree | $89,044 | $81,483 |
| Total | $50,868 | $38,569 |
Family Income in San Jacinto
Family Income Brackets in San Jacinto
According to the San Jacinto family income data, there are 2,245 families falling into the $100,000 to $149,999 income range, which is the most common income bracket and makes up 19.8% of all families. Conversely, the $10,000 to $14,999 income bracket is the least frequent group with only 125 families (1.1%) belonging to this category.
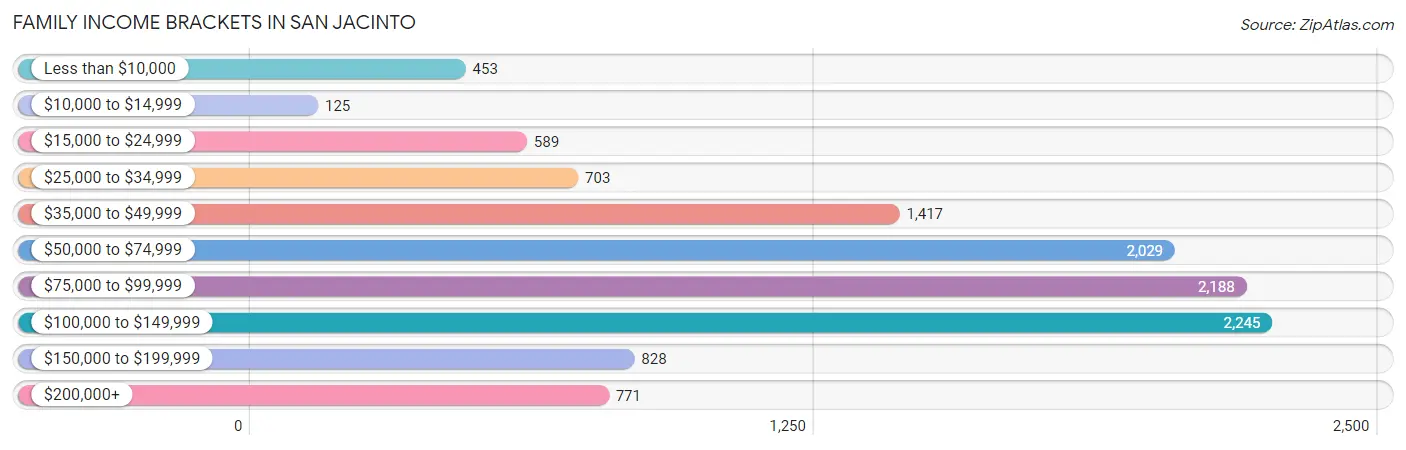
| Income Bracket | # Families | % Families |
| Less than $10,000 | 453 | 4.0% |
| $10,000 to $14,999 | 125 | 1.1% |
| $15,000 to $24,999 | 589 | 5.2% |
| $25,000 to $34,999 | 703 | 6.2% |
| $35,000 to $49,999 | 1,417 | 12.5% |
| $50,000 to $74,999 | 2,029 | 17.9% |
| $75,000 to $99,999 | 2,188 | 19.3% |
| $100,000 to $149,999 | 2,245 | 19.8% |
| $150,000 to $199,999 | 828 | 7.3% |
| $200,000+ | 771 | 6.8% |
Family Income by Famaliy Size in San Jacinto
7+ person families (838 | 7.4%) account for the highest median family income in San Jacinto with $100,946 per family, while 2-person families (3,097 | 27.3%) have the highest median income of $28,729 per family member.
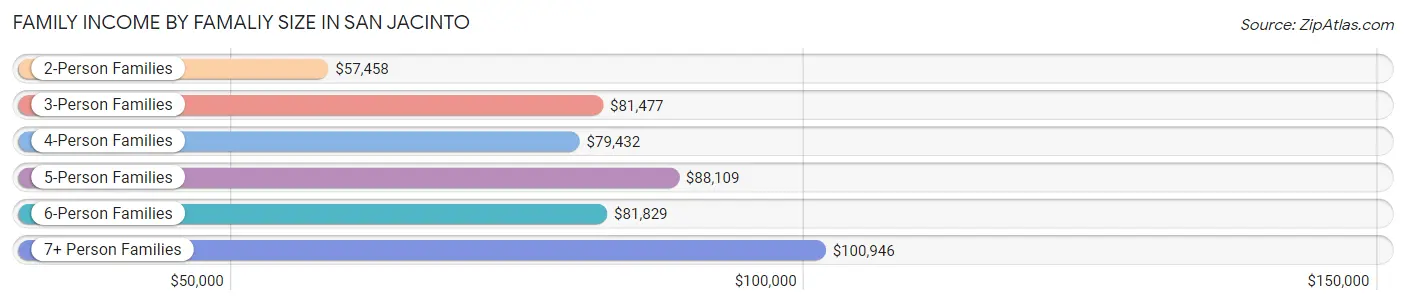
| Income Bracket | # Families | Median Income |
| 2-Person Families | 3,097 (27.3%) | $57,458 |
| 3-Person Families | 2,293 (20.2%) | $81,477 |
| 4-Person Families | 2,477 (21.8%) | $79,432 |
| 5-Person Families | 1,863 (16.4%) | $88,109 |
| 6-Person Families | 768 (6.8%) | $81,829 |
| 7+ Person Families | 838 (7.4%) | $100,946 |
| Total | 11,336 (100.0%) | $79,560 |
Family Income by Number of Earners in San Jacinto
The median family income in San Jacinto is $79,560, with families comprising 3+ earners (2,035) having the highest median family income of $131,599, while families with no earners (1,464) have the lowest median family income of $33,587, accounting for 17.9% and 12.9% of families, respectively.
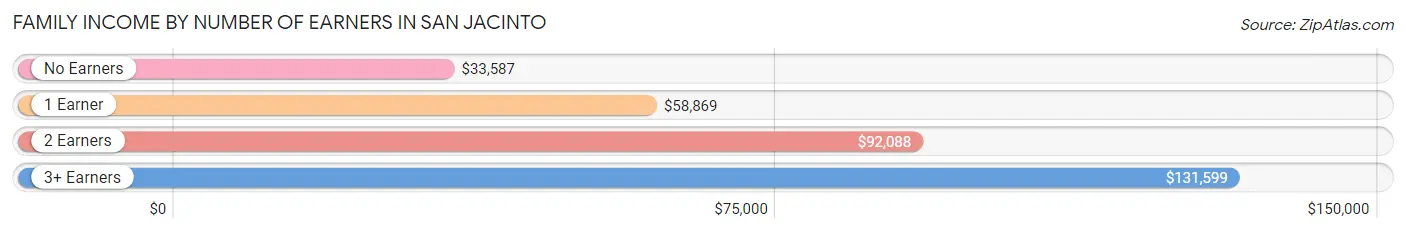
| Number of Earners | # Families | Median Income |
| No Earners | 1,464 (12.9%) | $33,587 |
| 1 Earner | 4,267 (37.6%) | $58,869 |
| 2 Earners | 3,570 (31.5%) | $92,088 |
| 3+ Earners | 2,035 (17.9%) | $131,599 |
| Total | 11,336 (100.0%) | $79,560 |
Household Income in San Jacinto
Household Income Brackets in San Jacinto
With 2,827 households falling in the category, the $100,000 to $149,999 income range is the most frequent in San Jacinto, accounting for 19.6% of all households. In contrast, only 519 households (3.6%) fall into the $10,000 to $14,999 income bracket, making it the least populous group.
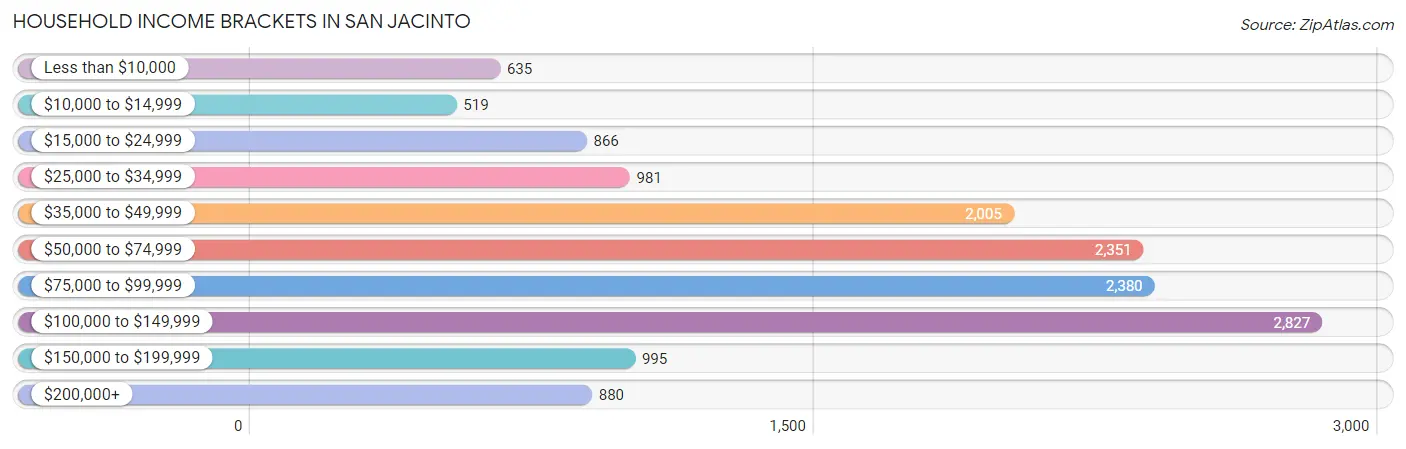
| Income Bracket | # Households | % Households |
| Less than $10,000 | 635 | 4.4% |
| $10,000 to $14,999 | 519 | 3.6% |
| $15,000 to $24,999 | 866 | 6.0% |
| $25,000 to $34,999 | 981 | 6.8% |
| $35,000 to $49,999 | 2,005 | 13.9% |
| $50,000 to $74,999 | 2,351 | 16.3% |
| $75,000 to $99,999 | 2,380 | 16.5% |
| $100,000 to $149,999 | 2,827 | 19.6% |
| $150,000 to $199,999 | 995 | 6.9% |
| $200,000+ | 880 | 6.1% |
Household Income by Householder Age in San Jacinto
The median household income in San Jacinto is $73,682, with the highest median household income of $87,017 found in the 45 to 64 years age bracket for the primary householder. A total of 5,629 households (39.0%) fall into this category. Meanwhile, the 15 to 24 years age bracket for the primary householder has the lowest median household income of $0, with 172 households (1.2%) in this group.
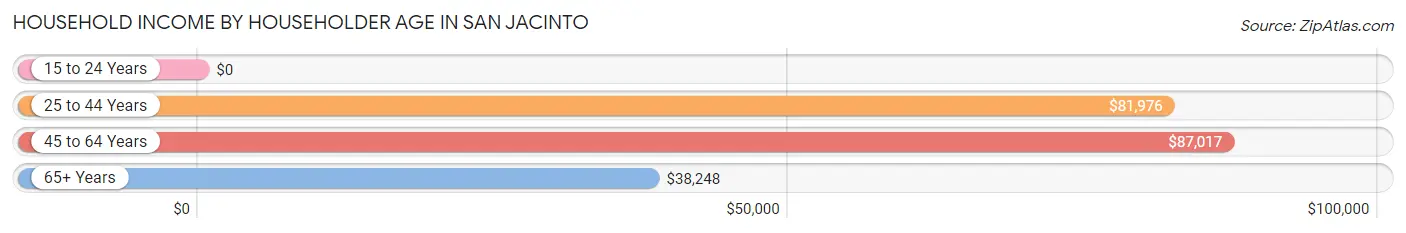
| Income Bracket | # Households | Median Income |
| 15 to 24 Years | 172 (1.2%) | $0 |
| 25 to 44 Years | 5,350 (37.1%) | $81,976 |
| 45 to 64 Years | 5,629 (39.0%) | $87,017 |
| 65+ Years | 3,275 (22.7%) | $38,248 |
| Total | 14,426 (100.0%) | $73,682 |
Poverty in San Jacinto
Income Below Poverty by Sex and Age in San Jacinto
With 14.6% poverty level for males and 19.6% for females among the residents of San Jacinto, 16 and 17 year old males and 5 year old females are the most vulnerable to poverty, with 553 males (40.8%) and 121 females (45.3%) in their respective age groups living below the poverty level.
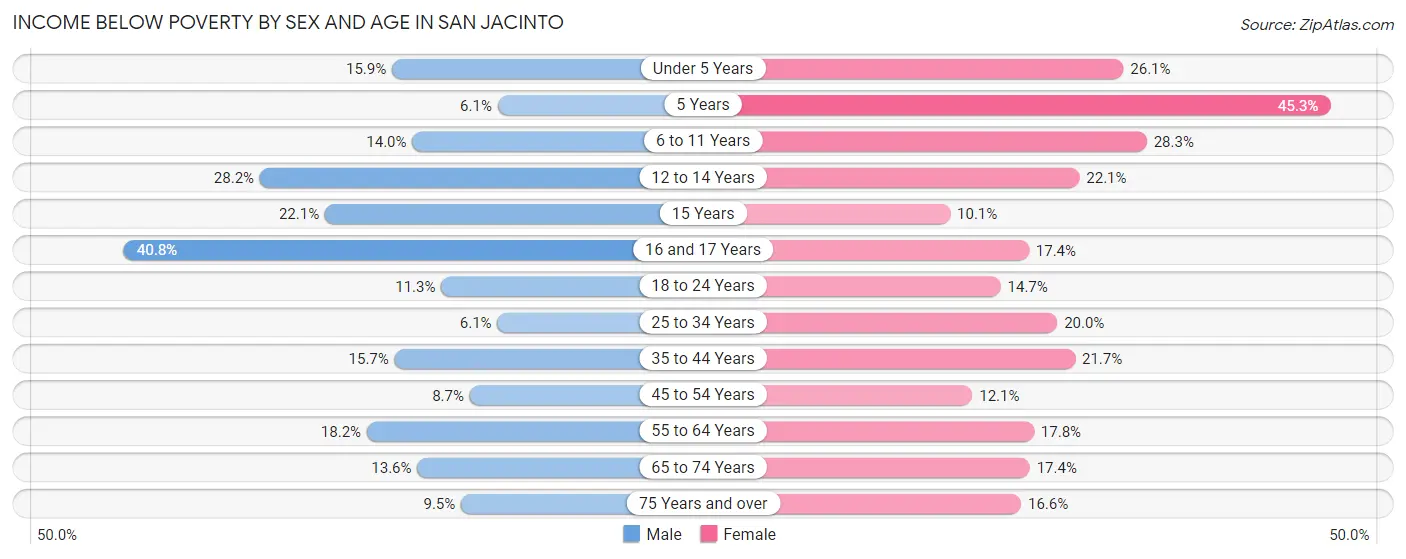
| Age Bracket | Male | Female |
| Under 5 Years | 347 (15.9%) | 496 (26.1%) |
| 5 Years | 17 (6.1%) | 121 (45.3%) |
| 6 to 11 Years | 353 (14.0%) | 618 (28.3%) |
| 12 to 14 Years | 388 (28.2%) | 441 (22.1%) |
| 15 Years | 123 (22.1%) | 39 (10.1%) |
| 16 and 17 Years | 553 (40.8%) | 179 (17.4%) |
| 18 to 24 Years | 341 (11.3%) | 383 (14.7%) |
| 25 to 34 Years | 266 (6.1%) | 738 (20.0%) |
| 35 to 44 Years | 565 (15.7%) | 819 (21.6%) |
| 45 to 54 Years | 254 (8.7%) | 342 (12.1%) |
| 55 to 64 Years | 467 (18.2%) | 448 (17.8%) |
| 65 to 74 Years | 224 (13.6%) | 374 (17.4%) |
| 75 Years and over | 80 (9.5%) | 235 (16.6%) |
| Total | 3,978 (14.6%) | 5,233 (19.6%) |
Income Above Poverty by Sex and Age in San Jacinto
According to the poverty statistics in San Jacinto, males aged 5 years and females aged 15 years are the age groups that are most secure financially, with 93.9% of males and 89.9% of females in these age groups living above the poverty line.
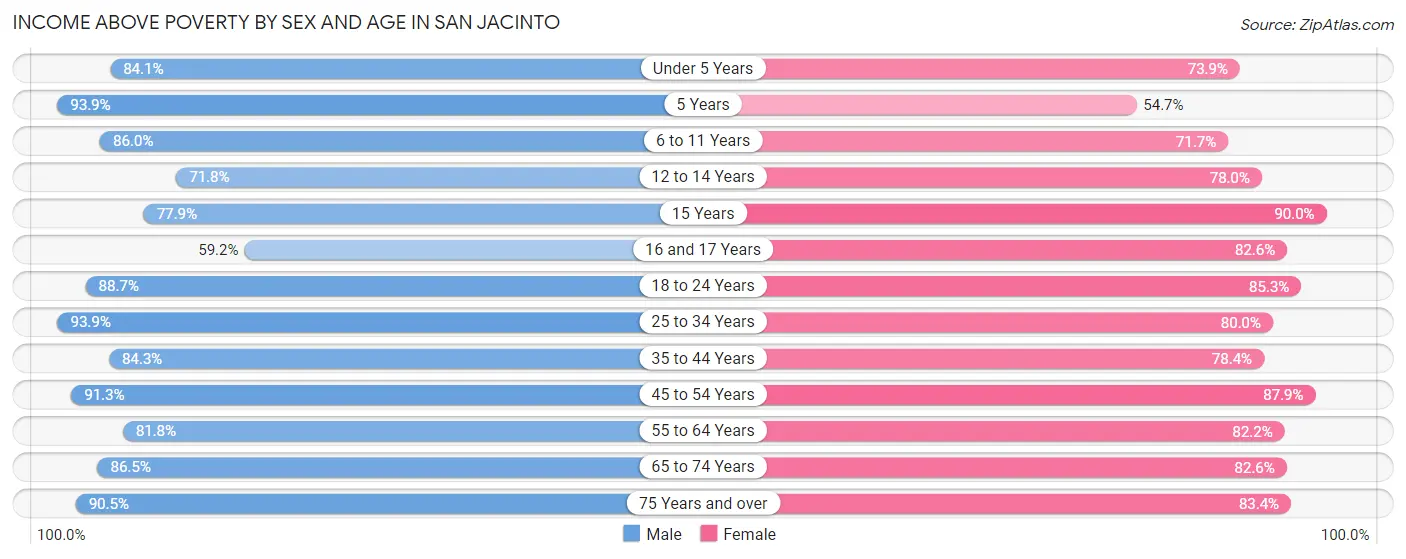
| Age Bracket | Male | Female |
| Under 5 Years | 1,836 (84.1%) | 1,402 (73.9%) |
| 5 Years | 262 (93.9%) | 146 (54.7%) |
| 6 to 11 Years | 2,167 (86.0%) | 1,566 (71.7%) |
| 12 to 14 Years | 990 (71.8%) | 1,559 (77.9%) |
| 15 Years | 433 (77.9%) | 349 (89.9%) |
| 16 and 17 Years | 803 (59.2%) | 852 (82.6%) |
| 18 to 24 Years | 2,670 (88.7%) | 2,215 (85.3%) |
| 25 to 34 Years | 4,080 (93.9%) | 2,954 (80.0%) |
| 35 to 44 Years | 3,043 (84.3%) | 2,964 (78.3%) |
| 45 to 54 Years | 2,673 (91.3%) | 2,482 (87.9%) |
| 55 to 64 Years | 2,095 (81.8%) | 2,065 (82.2%) |
| 65 to 74 Years | 1,429 (86.5%) | 1,771 (82.6%) |
| 75 Years and over | 763 (90.5%) | 1,177 (83.4%) |
| Total | 23,244 (85.4%) | 21,502 (80.4%) |
Income Below Poverty Among Married-Couple Families in San Jacinto
The poverty statistics for married-couple families in San Jacinto show that 7.2% or 551 of the total 7,625 families live below the poverty line. Families with 5 or more children have the highest poverty rate of 19.2%, comprising of 28 families. On the other hand, families with 1 or 2 children have the lowest poverty rate of 4.4%, which includes 134 families.
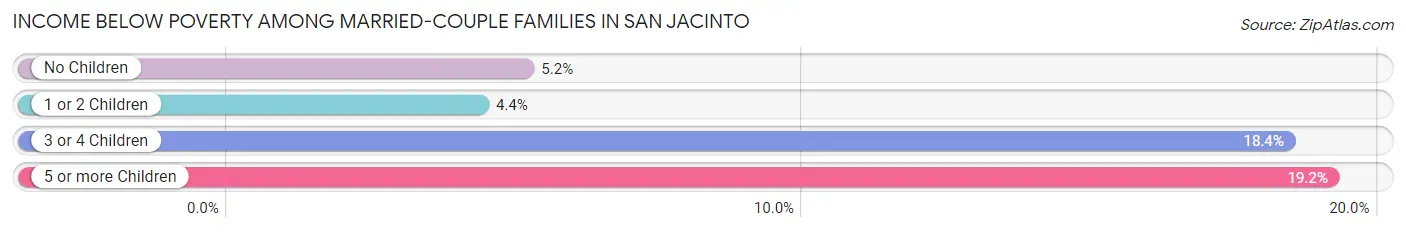
| Children | Above Poverty | Below Poverty |
| No Children | 3,034 (94.8%) | 165 (5.2%) |
| 1 or 2 Children | 2,929 (95.6%) | 134 (4.4%) |
| 3 or 4 Children | 993 (81.6%) | 224 (18.4%) |
| 5 or more Children | 118 (80.8%) | 28 (19.2%) |
| Total | 7,074 (92.8%) | 551 (7.2%) |
Income Below Poverty Among Single-Parent Households in San Jacinto
According to the poverty data in San Jacinto, 12.2% or 157 single-father households and 28.9% or 701 single-mother households are living below the poverty line. Among single-father households, those with 3 or 4 children have the highest poverty rate, with 74 households (39.8%) experiencing poverty. Likewise, among single-mother households, those with 5 or more children have the highest poverty rate, with 70 households (77.8%) falling below the poverty line.
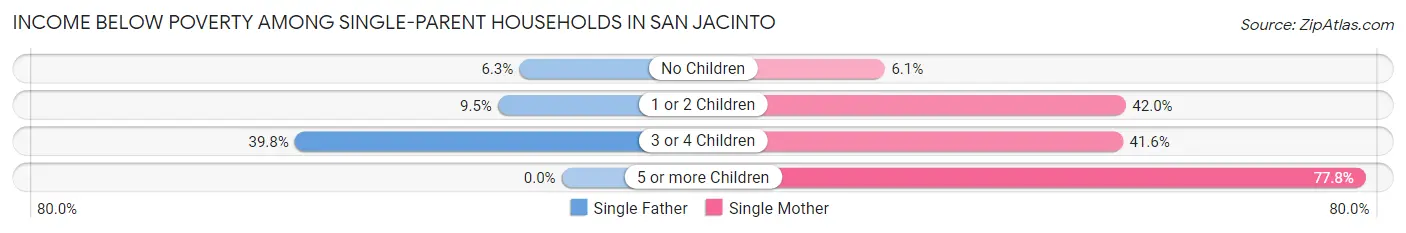
| Children | Single Father | Single Mother |
| No Children | 22 (6.3%) | 59 (6.1%) |
| 1 or 2 Children | 61 (9.5%) | 395 (42.0%) |
| 3 or 4 Children | 74 (39.8%) | 177 (41.5%) |
| 5 or more Children | 0 (0.0%) | 70 (77.8%) |
| Total | 157 (12.2%) | 701 (28.9%) |
Income Below Poverty Among Married-Couple vs Single-Parent Households in San Jacinto
The poverty data for San Jacinto shows that 551 of the married-couple family households (7.2%) and 858 of the single-parent households (23.1%) are living below the poverty level. Within the married-couple family households, those with 5 or more children have the highest poverty rate, with 28 households (19.2%) falling below the poverty line. Among the single-parent households, those with 3 or 4 children have the highest poverty rate, with 251 household (41.0%) living below poverty.
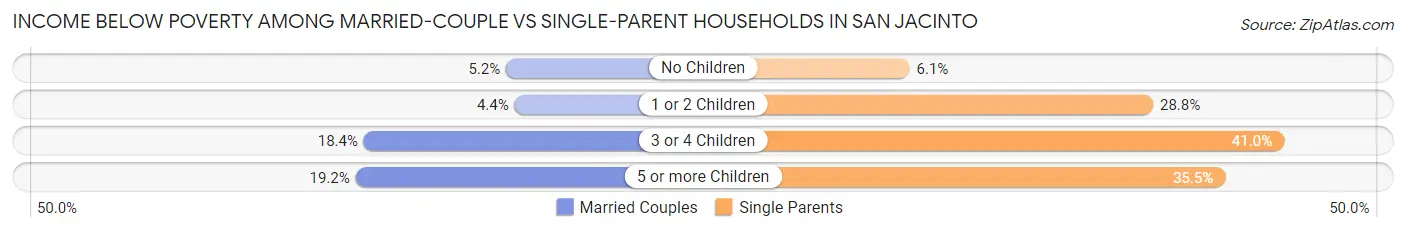
| Children | Married-Couple Families | Single-Parent Households |
| No Children | 165 (5.2%) | 81 (6.1%) |
| 1 or 2 Children | 134 (4.4%) | 456 (28.8%) |
| 3 or 4 Children | 224 (18.4%) | 251 (41.0%) |
| 5 or more Children | 28 (19.2%) | 70 (35.5%) |
| Total | 551 (7.2%) | 858 (23.1%) |
Race in San Jacinto
The most populous races in San Jacinto are Hispanic or Latino (33,111 | 61.2%), White / Caucasian (22,544 | 41.7%), and Some other Race (13,379 | 24.7%).
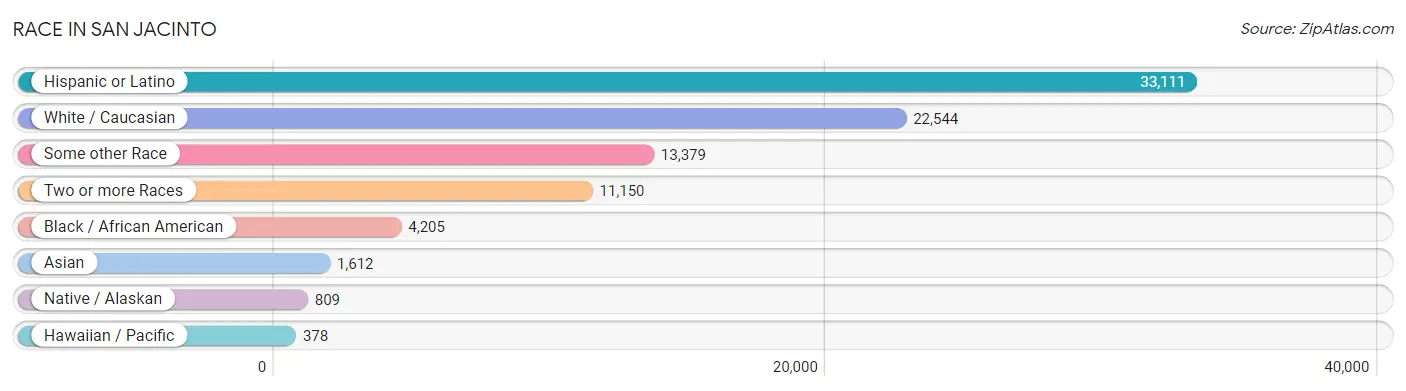
| Race | # Population | % Population |
| Asian | 1,612 | 3.0% |
| Black / African American | 4,205 | 7.8% |
| Hawaiian / Pacific | 378 | 0.7% |
| Hispanic or Latino | 33,111 | 61.2% |
| Native / Alaskan | 809 | 1.5% |
| White / Caucasian | 22,544 | 41.7% |
| Two or more Races | 11,150 | 20.6% |
| Some other Race | 13,379 | 24.7% |
| Total | 54,077 | 100.0% |
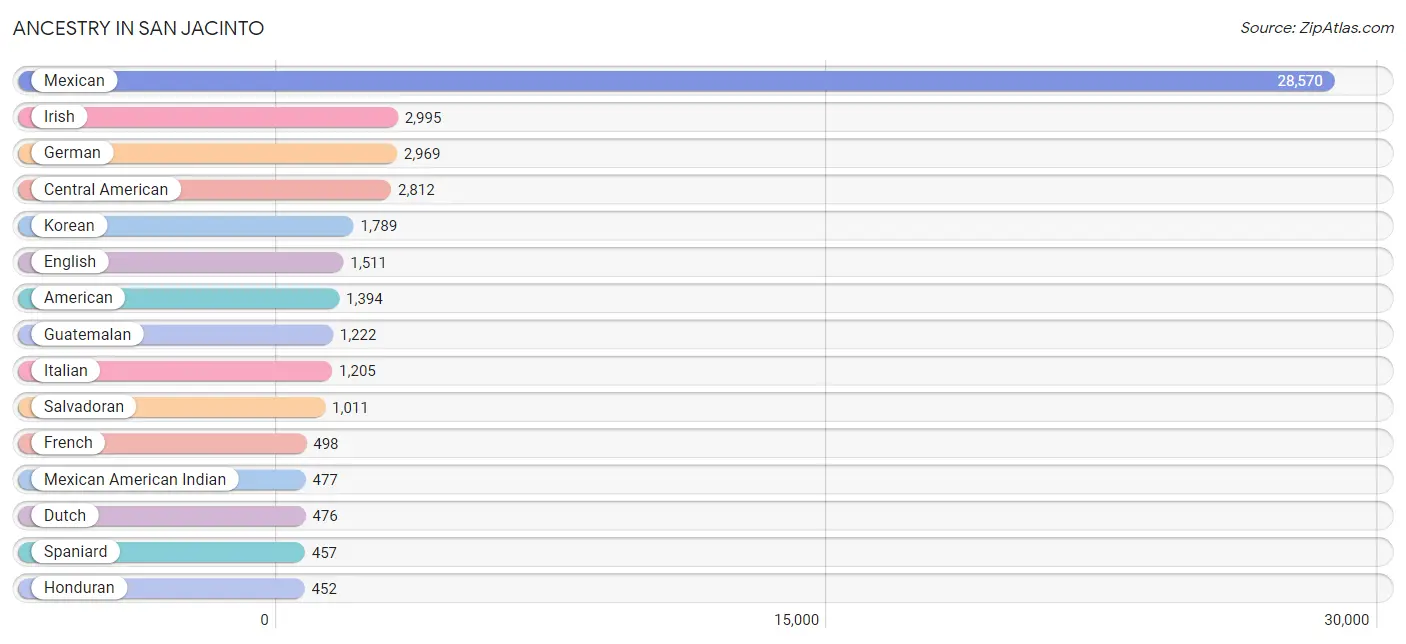
Ancestry in San Jacinto
The most populous ancestries reported in San Jacinto are Mexican (28,570 | 52.8%), Irish (2,995 | 5.5%), German (2,969 | 5.5%), Central American (2,812 | 5.2%), and Korean (1,789 | 3.3%), together accounting for 72.4% of all San Jacinto residents.
| Ancestry | # Population | % Population |
| Afghan | 48 | 0.1% |
| African | 215 | 0.4% |
| American | 1,394 | 2.6% |
| Apache | 52 | 0.1% |
| Arab | 126 | 0.2% |
| Armenian | 26 | 0.1% |
| Austrian | 18 | 0.0% |
| Bhutanese | 19 | 0.0% |
| British | 173 | 0.3% |
| Burmese | 13 | 0.0% |
| Canadian | 11 | 0.0% |
| Central American | 2,812 | 5.2% |
| Central American Indian | 102 | 0.2% |
| Cherokee | 51 | 0.1% |
| Choctaw | 316 | 0.6% |
| Colombian | 61 | 0.1% |
| Costa Rican | 18 | 0.0% |
| Croatian | 12 | 0.0% |
| Cuban | 51 | 0.1% |
| Czech | 161 | 0.3% |
| Czechoslovakian | 213 | 0.4% |
| Danish | 70 | 0.1% |
| Dominican | 109 | 0.2% |
| Dutch | 476 | 0.9% |
| Eastern European | 84 | 0.2% |
| Egyptian | 13 | 0.0% |
| English | 1,511 | 2.8% |
| European | 313 | 0.6% |
| French | 498 | 0.9% |
| French American Indian | 13 | 0.0% |
| French Canadian | 71 | 0.1% |
| German | 2,969 | 5.5% |
| German Russian | 6 | 0.0% |
| Greek | 25 | 0.1% |
| Guamanian / Chamorro | 55 | 0.1% |
| Guatemalan | 1,222 | 2.3% |
| Honduran | 452 | 0.8% |
| Hungarian | 36 | 0.1% |
| Icelander | 9 | 0.0% |
| Indian (Asian) | 245 | 0.4% |
| Inupiat | 32 | 0.1% |
| Iranian | 23 | 0.0% |
| Irish | 2,995 | 5.5% |
| Italian | 1,205 | 2.2% |
| Jamaican | 51 | 0.1% |
| Japanese | 40 | 0.1% |
| Kiowa | 35 | 0.1% |
| Korean | 1,789 | 3.3% |
| Laotian | 97 | 0.2% |
| Lebanese | 24 | 0.0% |
| Lithuanian | 49 | 0.1% |
| Lumbee | 120 | 0.2% |
| Malaysian | 28 | 0.1% |
| Mexican | 28,570 | 52.8% |
| Mexican American Indian | 477 | 0.9% |
| Mongolian | 7 | 0.0% |
| Native Hawaiian | 83 | 0.2% |
| Nicaraguan | 99 | 0.2% |
| Nigerian | 80 | 0.2% |
| Northern European | 183 | 0.3% |
| Norwegian | 305 | 0.6% |
| Panamanian | 10 | 0.0% |
| Pennsylvania German | 17 | 0.0% |
| Peruvian | 62 | 0.1% |
| Polish | 261 | 0.5% |
| Portuguese | 35 | 0.1% |
| Puerto Rican | 431 | 0.8% |
| Romanian | 50 | 0.1% |
| Russian | 89 | 0.2% |
| Salvadoran | 1,011 | 1.9% |
| Samoan | 408 | 0.7% |
| Scandinavian | 98 | 0.2% |
| Scotch-Irish | 245 | 0.4% |
| Scottish | 445 | 0.8% |
| Seminole | 30 | 0.1% |
| Sioux | 41 | 0.1% |
| Slavic | 10 | 0.0% |
| Slovak | 35 | 0.1% |
| Slovene | 10 | 0.0% |
| South American | 125 | 0.2% |
| Spaniard | 457 | 0.9% |
| Spanish | 91 | 0.2% |
| Sri Lankan | 258 | 0.5% |
| Subsaharan African | 295 | 0.5% |
| Swedish | 441 | 0.8% |
| Swiss | 121 | 0.2% |
| Thai | 56 | 0.1% |
| Tongan | 13 | 0.0% |
| Ukrainian | 49 | 0.1% |
| Venezuelan | 2 | 0.0% |
| Welsh | 96 | 0.2% |
| West Indian | 12 | 0.0% | View All 92 Rows |
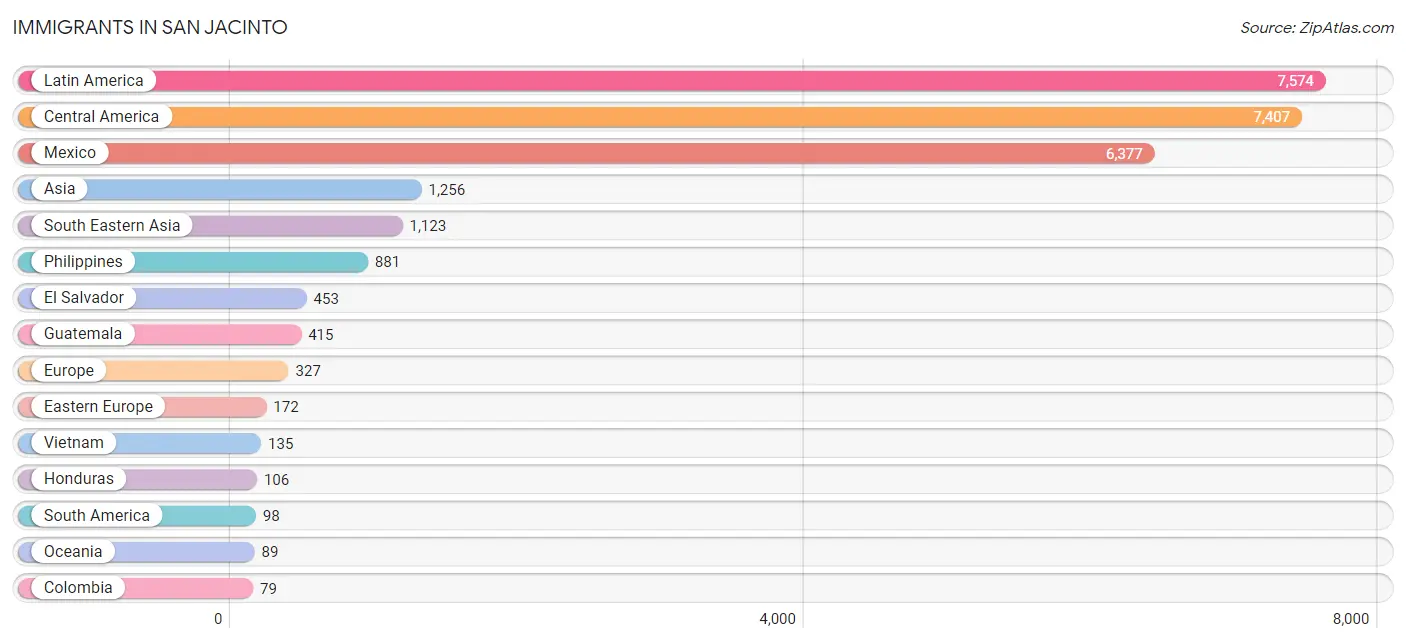
Immigrants in San Jacinto
The most numerous immigrant groups reported in San Jacinto came from Latin America (7,574 | 14.0%), Central America (7,407 | 13.7%), Mexico (6,377 | 11.8%), Asia (1,256 | 2.3%), and South Eastern Asia (1,123 | 2.1%), together accounting for 43.9% of all San Jacinto residents.
| Immigration Origin | # Population | % Population |
| Afghanistan | 15 | 0.0% |
| Africa | 62 | 0.1% |
| Asia | 1,256 | 2.3% |
| Cambodia | 17 | 0.0% |
| Canada | 52 | 0.1% |
| Caribbean | 69 | 0.1% |
| Central America | 7,407 | 13.7% |
| Chile | 17 | 0.0% |
| Colombia | 79 | 0.2% |
| Cuba | 31 | 0.1% |
| Czechoslovakia | 43 | 0.1% |
| Eastern Asia | 37 | 0.1% |
| Eastern Europe | 172 | 0.3% |
| Egypt | 21 | 0.0% |
| El Salvador | 453 | 0.8% |
| Europe | 327 | 0.6% |
| Germany | 42 | 0.1% |
| Ghana | 9 | 0.0% |
| Guatemala | 415 | 0.8% |
| Honduras | 106 | 0.2% |
| Indonesia | 50 | 0.1% |
| Iran | 23 | 0.0% |
| Italy | 8 | 0.0% |
| Jamaica | 26 | 0.1% |
| Japan | 24 | 0.0% |
| Korea | 13 | 0.0% |
| Laos | 28 | 0.1% |
| Latin America | 7,574 | 14.0% |
| Lebanon | 6 | 0.0% |
| Malaysia | 7 | 0.0% |
| Mexico | 6,377 | 11.8% |
| Netherlands | 19 | 0.0% |
| Nicaragua | 56 | 0.1% |
| Nigeria | 32 | 0.1% |
| Northern Africa | 21 | 0.0% |
| Northern Europe | 24 | 0.0% |
| Oceania | 89 | 0.2% |
| Philippines | 881 | 1.6% |
| Poland | 39 | 0.1% |
| Portugal | 18 | 0.0% |
| Romania | 41 | 0.1% |
| South America | 98 | 0.2% |
| South Central Asia | 38 | 0.1% |
| South Eastern Asia | 1,123 | 2.1% |
| Southern Europe | 70 | 0.1% |
| Spain | 44 | 0.1% |
| Thailand | 5 | 0.0% |
| Ukraine | 49 | 0.1% |
| Venezuela | 2 | 0.0% |
| Vietnam | 135 | 0.3% |
| West Indies | 12 | 0.0% |
| Western Africa | 41 | 0.1% |
| Western Asia | 23 | 0.0% |
| Western Europe | 61 | 0.1% | View All 54 Rows |
Sex and Age in San Jacinto
Sex and Age in San Jacinto
The most populous age groups in San Jacinto are 15 to 19 Years (2,758 | 10.1%) for men and 10 to 14 Years (3,092 | 11.5%) for women.
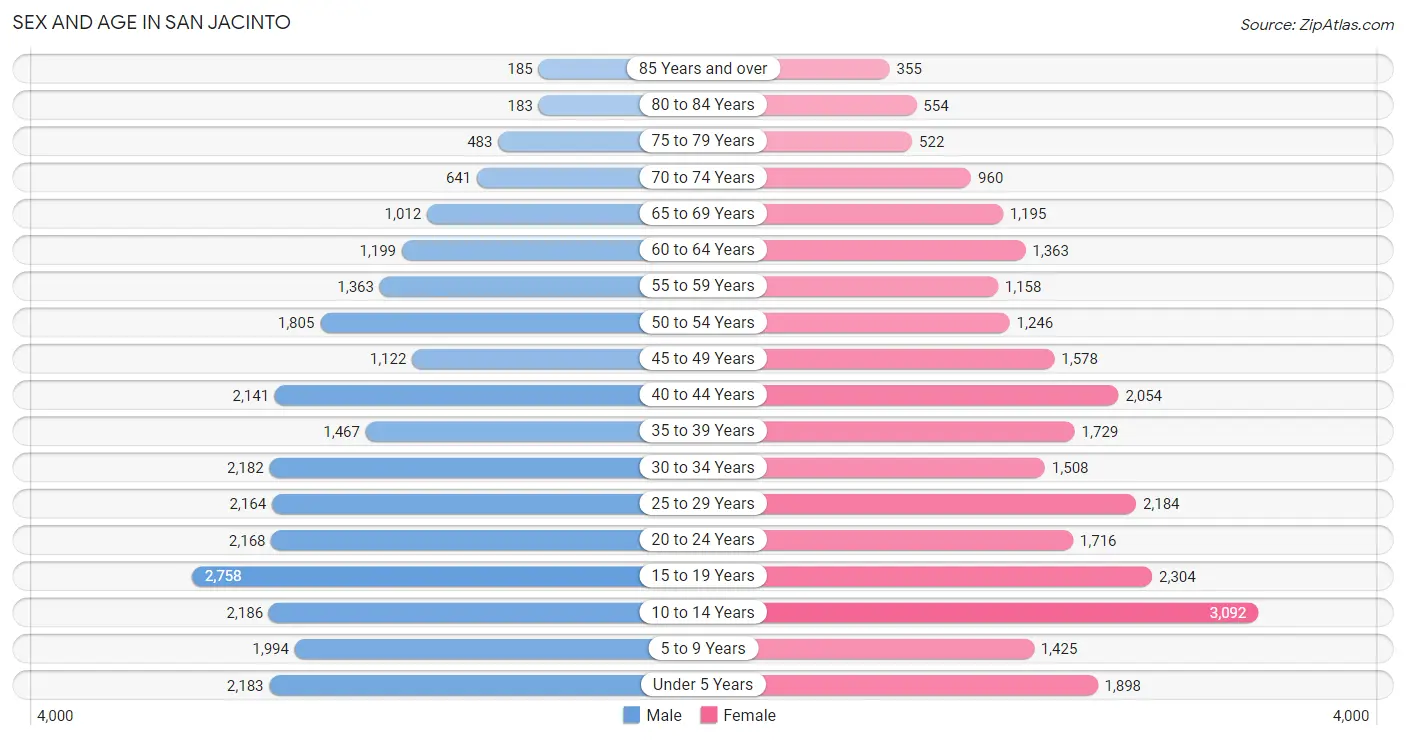
| Age Bracket | Male | Female |
| Under 5 Years | 2,183 (8.0%) | 1,898 (7.1%) |
| 5 to 9 Years | 1,994 (7.3%) | 1,425 (5.3%) |
| 10 to 14 Years | 2,186 (8.0%) | 3,092 (11.5%) |
| 15 to 19 Years | 2,758 (10.1%) | 2,304 (8.6%) |
| 20 to 24 Years | 2,168 (8.0%) | 1,716 (6.4%) |
| 25 to 29 Years | 2,164 (8.0%) | 2,184 (8.1%) |
| 30 to 34 Years | 2,182 (8.0%) | 1,508 (5.6%) |
| 35 to 39 Years | 1,467 (5.4%) | 1,729 (6.4%) |
| 40 to 44 Years | 2,141 (7.9%) | 2,054 (7.6%) |
| 45 to 49 Years | 1,122 (4.1%) | 1,578 (5.9%) |
| 50 to 54 Years | 1,805 (6.6%) | 1,246 (4.6%) |
| 55 to 59 Years | 1,363 (5.0%) | 1,158 (4.3%) |
| 60 to 64 Years | 1,199 (4.4%) | 1,363 (5.1%) |
| 65 to 69 Years | 1,012 (3.7%) | 1,195 (4.4%) |
| 70 to 74 Years | 641 (2.4%) | 960 (3.6%) |
| 75 to 79 Years | 483 (1.8%) | 522 (1.9%) |
| 80 to 84 Years | 183 (0.7%) | 554 (2.1%) |
| 85 Years and over | 185 (0.7%) | 355 (1.3%) |
| Total | 27,236 (100.0%) | 26,841 (100.0%) |
Families and Households in San Jacinto
Median Family Size in San Jacinto
The median family size in San Jacinto is 4.17 persons per family, with single female/mother families (2,428 | 21.4%) accounting for the largest median family size of 4.22 persons per family. On the other hand, single male/father families (1,283 | 11.3%) represent the smallest median family size with 3.92 persons per family.
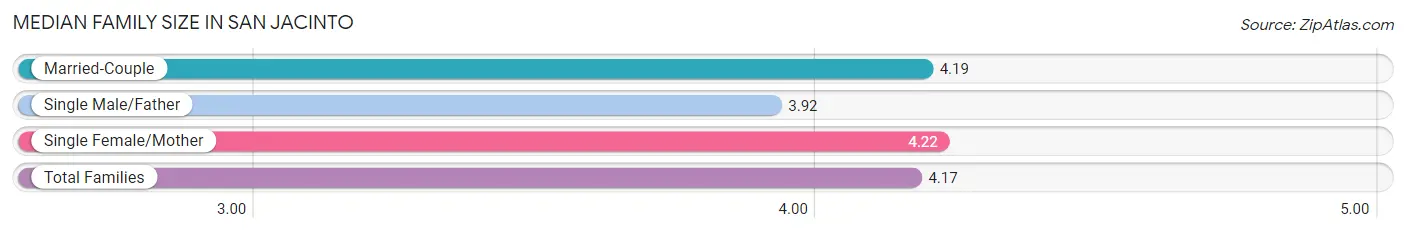
| Family Type | # Families | Family Size |
| Married-Couple | 7,625 (67.3%) | 4.19 |
| Single Male/Father | 1,283 (11.3%) | 3.92 |
| Single Female/Mother | 2,428 (21.4%) | 4.22 |
| Total Families | 11,336 (100.0%) | 4.17 |
Median Household Size in San Jacinto
The median household size in San Jacinto is 3.73 persons per household, with single male/father households (1,283 | 8.9%) accounting for the largest median household size of 4.43 persons per household. non-family households (3,090 | 21.4%) represent the smallest median household size with 1.60 persons per household.
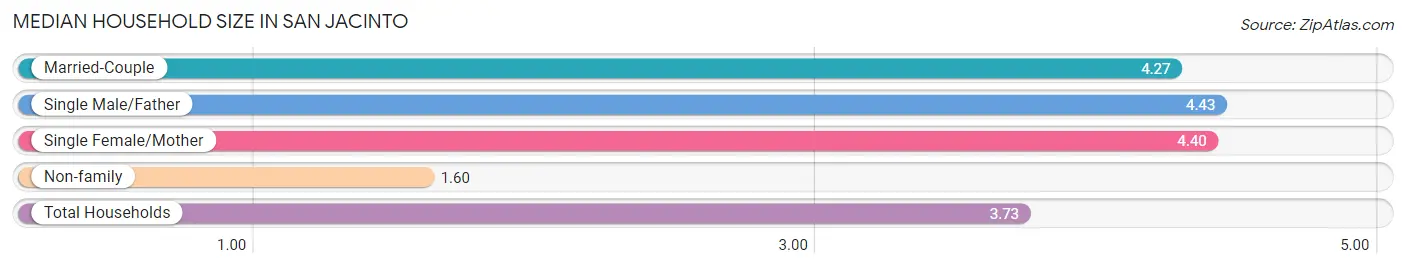
| Household Type | # Households | Household Size |
| Married-Couple | 7,625 (52.9%) | 4.27 |
| Single Male/Father | 1,283 (8.9%) | 4.43 |
| Single Female/Mother | 2,428 (16.8%) | 4.40 |
| Non-family | 3,090 (21.4%) | 1.60 |
| Total Households | 14,426 (100.0%) | 3.73 |
Household Size by Marriage Status in San Jacinto
Out of a total of 14,426 households in San Jacinto, 11,336 (78.6%) are family households, while 3,090 (21.4%) are nonfamily households. The most numerous type of family households are 2-person households, comprising 2,828, and the most common type of nonfamily households are 1-person households, comprising 2,215.
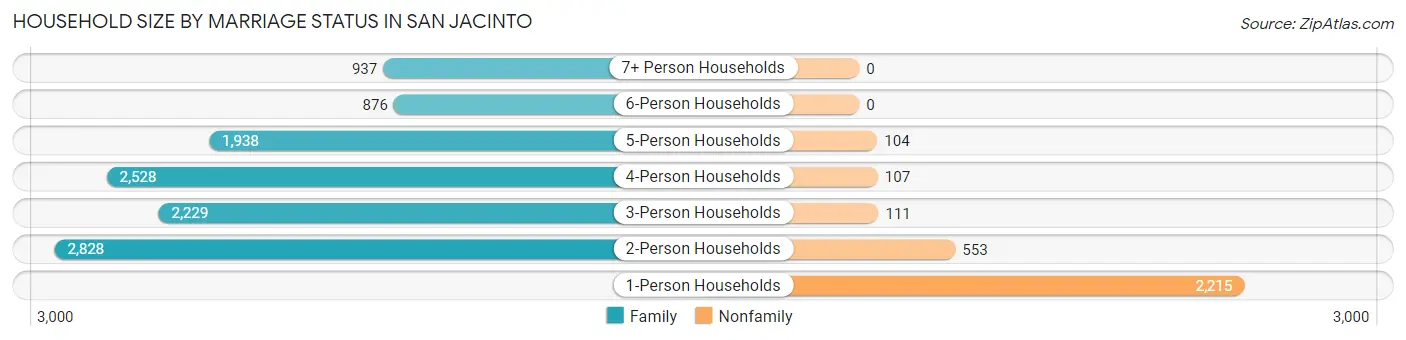
| Household Size | Family Households | Nonfamily Households |
| 1-Person Households | - | 2,215 (15.3%) |
| 2-Person Households | 2,828 (19.6%) | 553 (3.8%) |
| 3-Person Households | 2,229 (15.4%) | 111 (0.8%) |
| 4-Person Households | 2,528 (17.5%) | 107 (0.7%) |
| 5-Person Households | 1,938 (13.4%) | 104 (0.7%) |
| 6-Person Households | 876 (6.1%) | 0 (0.0%) |
| 7+ Person Households | 937 (6.5%) | 0 (0.0%) |
| Total | 11,336 (78.6%) | 3,090 (21.4%) |
Female Fertility in San Jacinto
Fertility by Age in San Jacinto
Average fertility rate in San Jacinto is 47.0 births per 1,000 women. Women in the age bracket of 20 to 34 years have the highest fertility rate with 90.0 births per 1,000 women. Women in the age bracket of 20 to 34 years acount for 77.7% of all women with births.
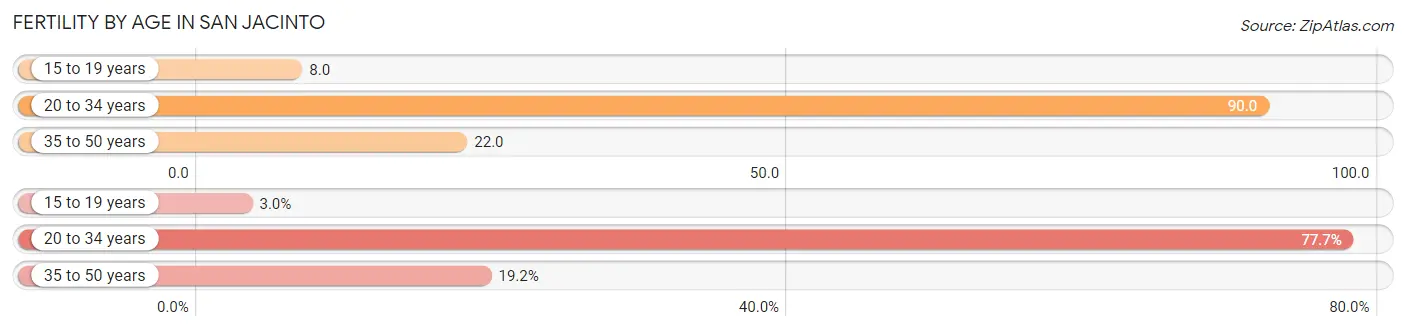
| Age Bracket | Women with Births | Births / 1,000 Women |
| 15 to 19 years | 19 (3.0%) | 8.0 |
| 20 to 34 years | 489 (77.7%) | 90.0 |
| 35 to 50 years | 121 (19.2%) | 22.0 |
| Total | 629 (100.0%) | 47.0 |
Fertility by Age by Marriage Status in San Jacinto
52.5% of women with births (629) in San Jacinto are married. The highest percentage of unmarried women with births falls into 15 to 19 years age bracket with 100.0% of them unmarried at the time of birth, while the lowest percentage of unmarried women with births belong to 20 to 34 years age bracket with 44.2% of them unmarried.

| Age Bracket | Married | Unmarried |
| 15 to 19 years | 0 (0.0%) | 19 (100.0%) |
| 20 to 34 years | 273 (55.8%) | 216 (44.2%) |
| 35 to 50 years | 57 (47.1%) | 64 (52.9%) |
| Total | 330 (52.5%) | 299 (47.5%) |
Fertility by Education in San Jacinto
Average fertility rate in San Jacinto is 47.0 births per 1,000 women. Women with the education attainment of college or associate's degree have the highest fertility rate of 78.0 births per 1,000 women, while women with the education attainment of graduate degree have the lowest fertility at 18.0 births per 1,000 women. Women with the education attainment of college or associate's degree represent 56.8% of all women with births.
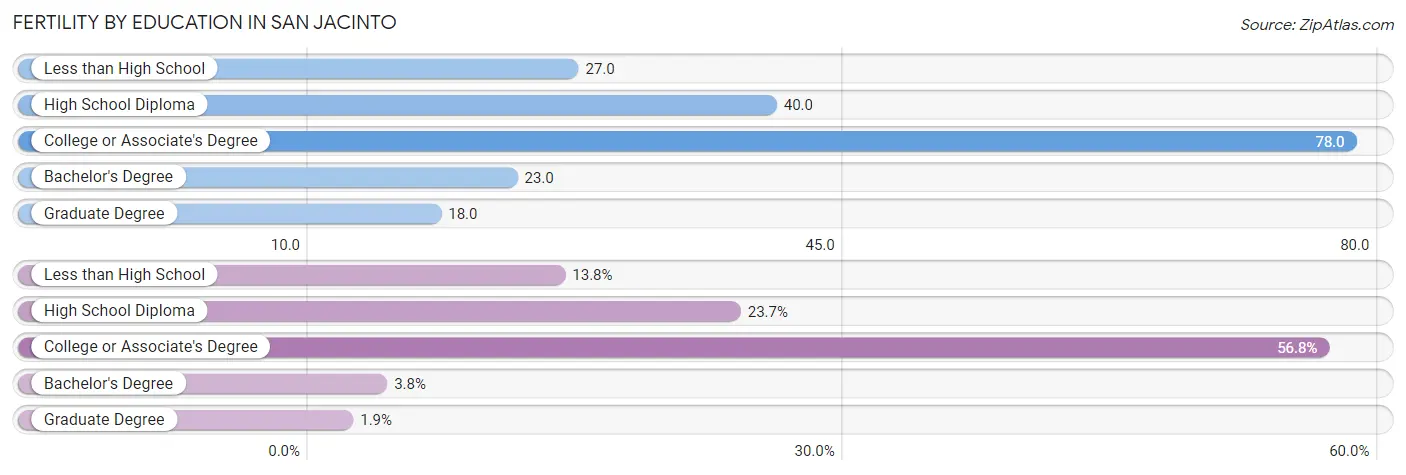
| Educational Attainment | Women with Births | Births / 1,000 Women |
| Less than High School | 87 (13.8%) | 27.0 |
| High School Diploma | 149 (23.7%) | 40.0 |
| College or Associate's Degree | 357 (56.8%) | 78.0 |
| Bachelor's Degree | 24 (3.8%) | 23.0 |
| Graduate Degree | 12 (1.9%) | 18.0 |
| Total | 629 (100.0%) | 47.0 |
Fertility by Education by Marriage Status in San Jacinto
47.5% of women with births in San Jacinto are unmarried. Women with the educational attainment of less than high school are most likely to be married with 82.8% of them married at childbirth, while women with the educational attainment of graduate degree are least likely to be married with 100.0% of them unmarried at childbirth.
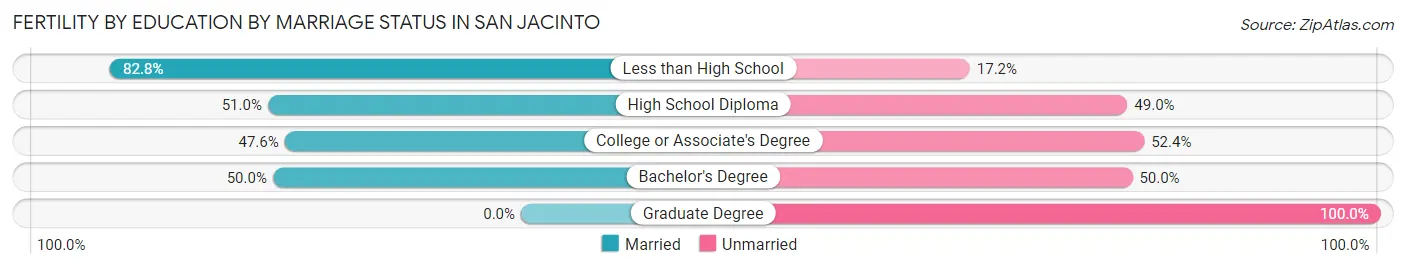
| Educational Attainment | Married | Unmarried |
| Less than High School | 72 (82.8%) | 15 (17.2%) |
| High School Diploma | 76 (51.0%) | 73 (49.0%) |
| College or Associate's Degree | 170 (47.6%) | 187 (52.4%) |
| Bachelor's Degree | 12 (50.0%) | 12 (50.0%) |
| Graduate Degree | 0 (0.0%) | 12 (100.0%) |
| Total | 330 (52.5%) | 299 (47.5%) |
Employment Characteristics in San Jacinto
Employment by Class of Employer in San Jacinto
Among the 20,930 employed individuals in San Jacinto, private company employees (13,753 | 65.7%), local government employees (1,892 | 9.0%), and not-for-profit organizations (1,569 | 7.5%) make up the most common classes of employment.
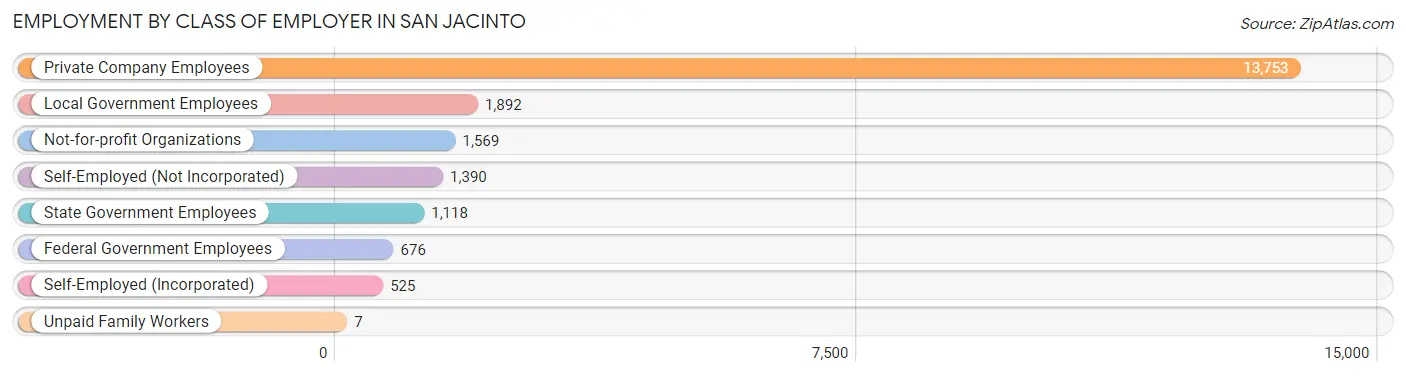
| Employer Class | # Employees | % Employees |
| Private Company Employees | 13,753 | 65.7% |
| Self-Employed (Incorporated) | 525 | 2.5% |
| Self-Employed (Not Incorporated) | 1,390 | 6.6% |
| Not-for-profit Organizations | 1,569 | 7.5% |
| Local Government Employees | 1,892 | 9.0% |
| State Government Employees | 1,118 | 5.3% |
| Federal Government Employees | 676 | 3.2% |
| Unpaid Family Workers | 7 | 0.0% |
| Total | 20,930 | 100.0% |
Employment Status by Age in San Jacinto
According to the labor force statistics for San Jacinto, out of the total population over 16 years of age (40,354), 58.3% or 23,526 individuals are in the labor force, with 8.3% or 1,953 of them unemployed. The age group with the highest labor force participation rate is 30 to 34 years, with 80.1% or 2,956 individuals in the labor force. Within the labor force, the 16 to 19 years age range has the highest percentage of unemployed individuals, with 36.0% or 350 of them being unemployed.
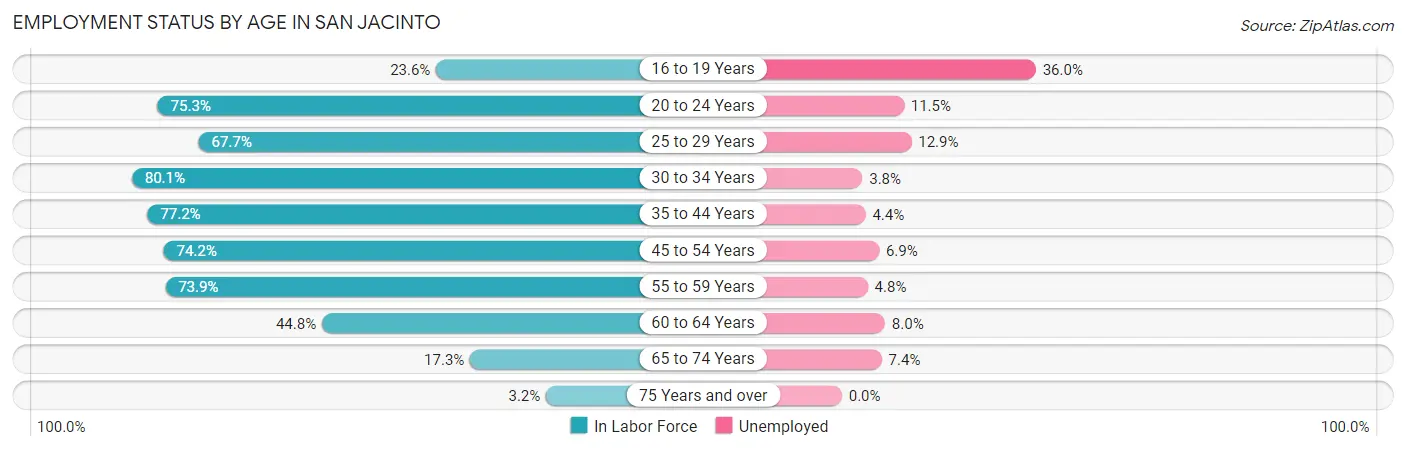
| Age Bracket | In Labor Force | Unemployed |
| 16 to 19 Years | 972 (23.6%) | 350 (36.0%) |
| 20 to 24 Years | 2,925 (75.3%) | 336 (11.5%) |
| 25 to 29 Years | 2,944 (67.7%) | 380 (12.9%) |
| 30 to 34 Years | 2,956 (80.1%) | 112 (3.8%) |
| 35 to 44 Years | 5,706 (77.2%) | 251 (4.4%) |
| 45 to 54 Years | 4,267 (74.2%) | 294 (6.9%) |
| 55 to 59 Years | 1,863 (73.9%) | 89 (4.8%) |
| 60 to 64 Years | 1,148 (44.8%) | 92 (8.0%) |
| 65 to 74 Years | 659 (17.3%) | 49 (7.4%) |
| 75 Years and over | 73 (3.2%) | 0 (0.0%) |
| Total | 23,526 (58.3%) | 1,953 (8.3%) |
Employment Status by Educational Attainment in San Jacinto
According to labor force statistics for San Jacinto, 71.9% of individuals (18,883) out of the total population between 25 and 64 years of age (26,263) are in the labor force, with 6.5% or 1,227 of them being unemployed. The group with the highest labor force participation rate are those with the educational attainment of bachelor's degree or higher, with 87.1% or 2,906 individuals in the labor force. Within the labor force, individuals with less than high school education have the highest percentage of unemployment, with 15.9% or 493 of them being unemployed.
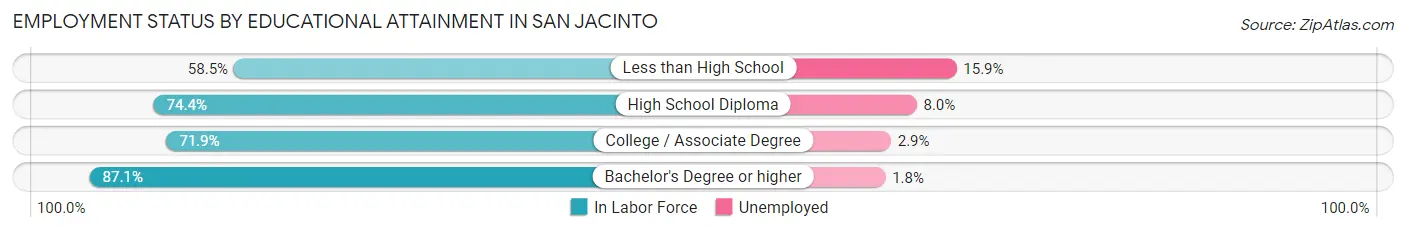
| Educational Attainment | In Labor Force | Unemployed |
| Less than High School | 3,100 (58.5%) | 843 (15.9%) |
| High School Diploma | 5,980 (74.4%) | 643 (8.0%) |
| College / Associate Degree | 6,895 (71.9%) | 278 (2.9%) |
| Bachelor's Degree or higher | 2,906 (87.1%) | 60 (1.8%) |
| Total | 18,883 (71.9%) | 1,707 (6.5%) |
Employment Occupations by Sex in San Jacinto
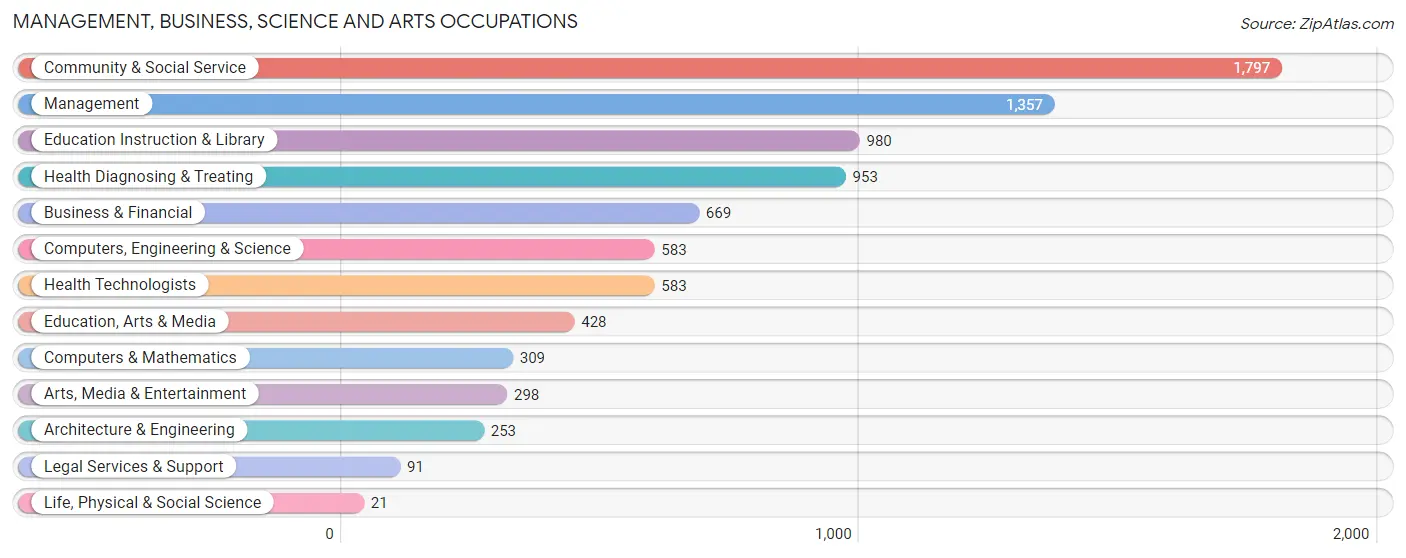
Management, Business, Science and Arts Occupations
The most common Management, Business, Science and Arts occupations in San Jacinto are Community & Social Service (1,797 | 8.4%), Management (1,357 | 6.4%), Education Instruction & Library (980 | 4.6%), Health Diagnosing & Treating (953 | 4.5%), and Business & Financial (669 | 3.1%).
Management, Business, Science and Arts Occupations by Sex
Within the Management, Business, Science and Arts occupations in San Jacinto, the most male-oriented occupations are Architecture & Engineering (100.0%), Computers, Engineering & Science (78.4%), and Computers & Mathematics (66.0%), while the most female-oriented occupations are Life, Physical & Social Science (100.0%), Legal Services & Support (90.1%), and Education Instruction & Library (81.0%).
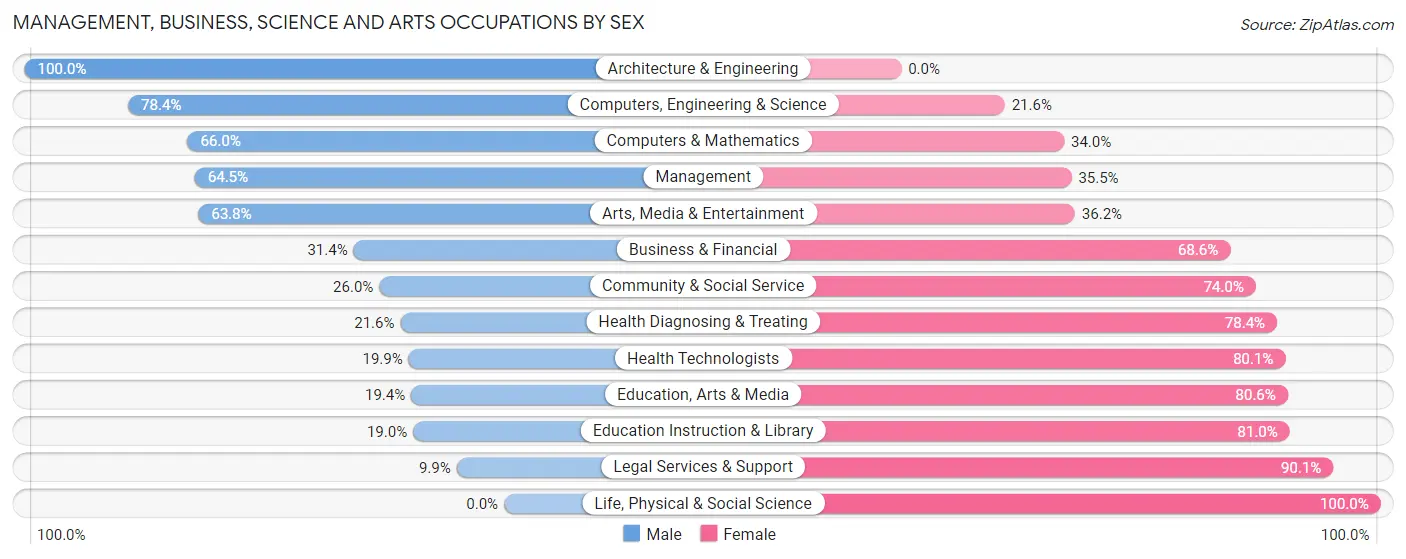
| Occupation | Male | Female |
| Management | 875 (64.5%) | 482 (35.5%) |
| Business & Financial | 210 (31.4%) | 459 (68.6%) |
| Computers, Engineering & Science | 457 (78.4%) | 126 (21.6%) |
| Computers & Mathematics | 204 (66.0%) | 105 (34.0%) |
| Architecture & Engineering | 253 (100.0%) | 0 (0.0%) |
| Life, Physical & Social Science | 0 (0.0%) | 21 (100.0%) |
| Community & Social Service | 468 (26.0%) | 1,329 (74.0%) |
| Education, Arts & Media | 83 (19.4%) | 345 (80.6%) |
| Legal Services & Support | 9 (9.9%) | 82 (90.1%) |
| Education Instruction & Library | 186 (19.0%) | 794 (81.0%) |
| Arts, Media & Entertainment | 190 (63.8%) | 108 (36.2%) |
| Health Diagnosing & Treating | 206 (21.6%) | 747 (78.4%) |
| Health Technologists | 116 (19.9%) | 467 (80.1%) |
| Total (Category) | 2,216 (41.3%) | 3,143 (58.7%) |
| Total (Overall) | 12,568 (58.8%) | 8,799 (41.2%) |
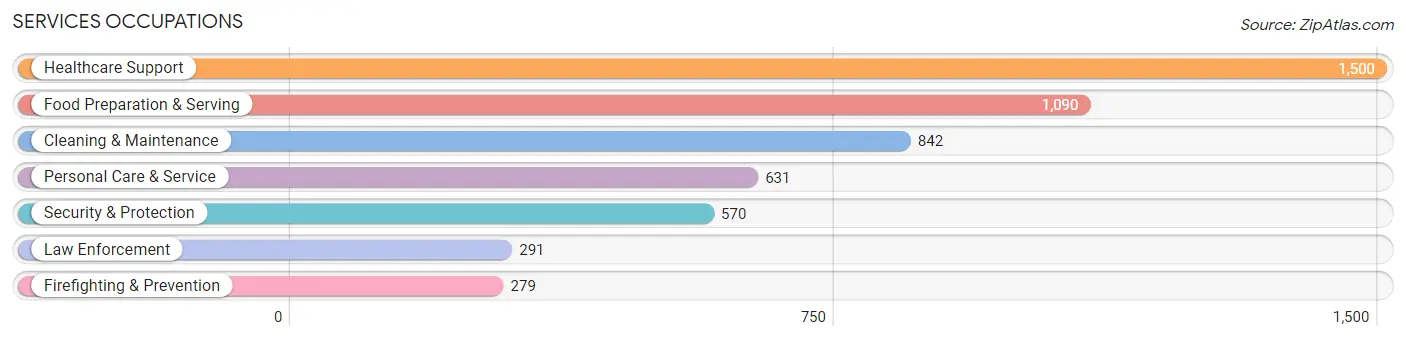
Services Occupations
The most common Services occupations in San Jacinto are Healthcare Support (1,500 | 7.0%), Food Preparation & Serving (1,090 | 5.1%), Cleaning & Maintenance (842 | 3.9%), Personal Care & Service (631 | 2.9%), and Security & Protection (570 | 2.7%).
Services Occupations by Sex
Within the Services occupations in San Jacinto, the most male-oriented occupations are Firefighting & Prevention (92.8%), Security & Protection (87.4%), and Law Enforcement (82.1%), while the most female-oriented occupations are Personal Care & Service (83.7%), Healthcare Support (74.1%), and Food Preparation & Serving (50.0%).
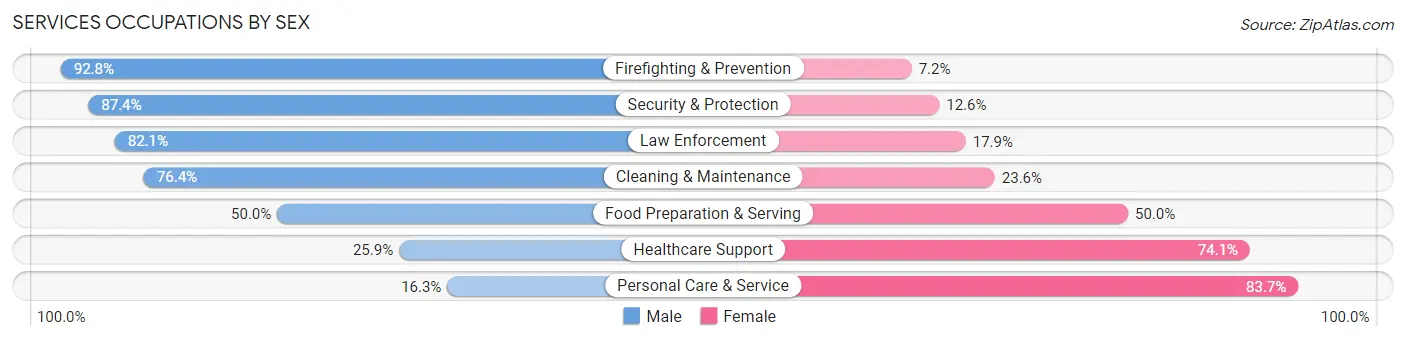
| Occupation | Male | Female |
| Healthcare Support | 388 (25.9%) | 1,112 (74.1%) |
| Security & Protection | 498 (87.4%) | 72 (12.6%) |
| Firefighting & Prevention | 259 (92.8%) | 20 (7.2%) |
| Law Enforcement | 239 (82.1%) | 52 (17.9%) |
| Food Preparation & Serving | 545 (50.0%) | 545 (50.0%) |
| Cleaning & Maintenance | 643 (76.4%) | 199 (23.6%) |
| Personal Care & Service | 103 (16.3%) | 528 (83.7%) |
| Total (Category) | 2,177 (47.0%) | 2,456 (53.0%) |
| Total (Overall) | 12,568 (58.8%) | 8,799 (41.2%) |
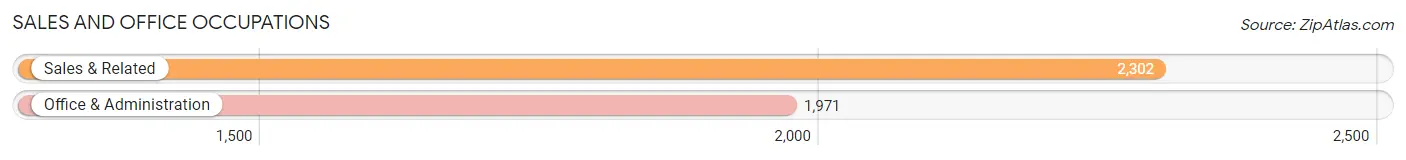
Sales and Office Occupations
The most common Sales and Office occupations in San Jacinto are Sales & Related (2,302 | 10.8%), and Office & Administration (1,971 | 9.2%).
Sales and Office Occupations by Sex
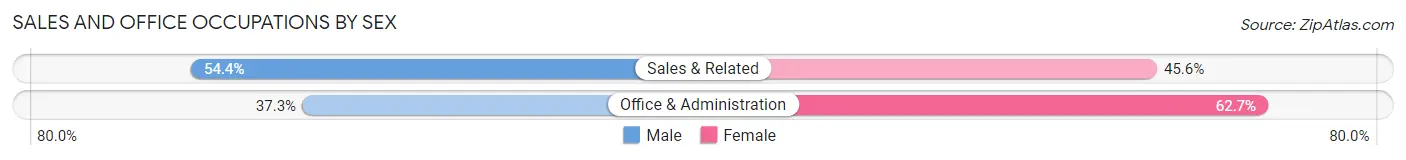
| Occupation | Male | Female |
| Sales & Related | 1,252 (54.4%) | 1,050 (45.6%) |
| Office & Administration | 736 (37.3%) | 1,235 (62.7%) |
| Total (Category) | 1,988 (46.5%) | 2,285 (53.5%) |
| Total (Overall) | 12,568 (58.8%) | 8,799 (41.2%) |
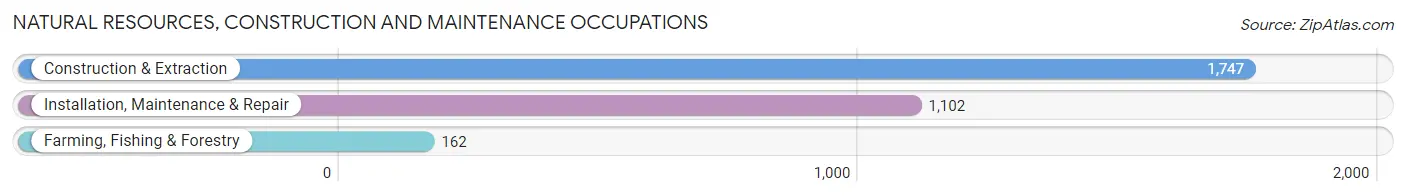
Natural Resources, Construction and Maintenance Occupations
The most common Natural Resources, Construction and Maintenance occupations in San Jacinto are Construction & Extraction (1,747 | 8.2%), Installation, Maintenance & Repair (1,102 | 5.2%), and Farming, Fishing & Forestry (162 | 0.8%).
Natural Resources, Construction and Maintenance Occupations by Sex
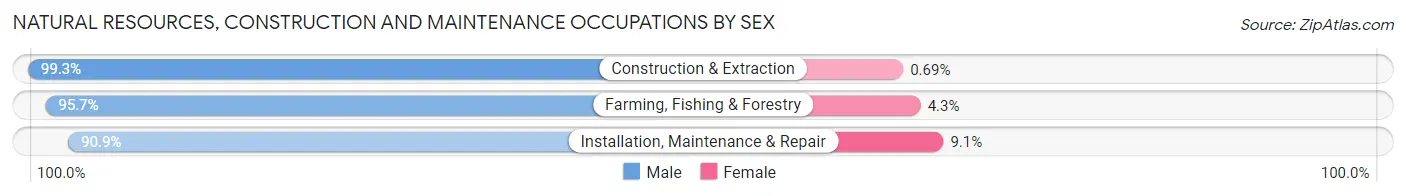
| Occupation | Male | Female |
| Farming, Fishing & Forestry | 155 (95.7%) | 7 (4.3%) |
| Construction & Extraction | 1,735 (99.3%) | 12 (0.7%) |
| Installation, Maintenance & Repair | 1,002 (90.9%) | 100 (9.1%) |
| Total (Category) | 2,892 (96.1%) | 119 (4.0%) |
| Total (Overall) | 12,568 (58.8%) | 8,799 (41.2%) |
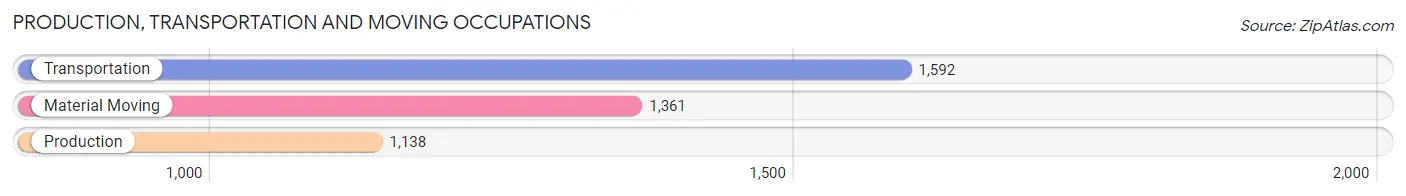
Production, Transportation and Moving Occupations
The most common Production, Transportation and Moving occupations in San Jacinto are Transportation (1,592 | 7.4%), Material Moving (1,361 | 6.4%), and Production (1,138 | 5.3%).
Production, Transportation and Moving Occupations by Sex
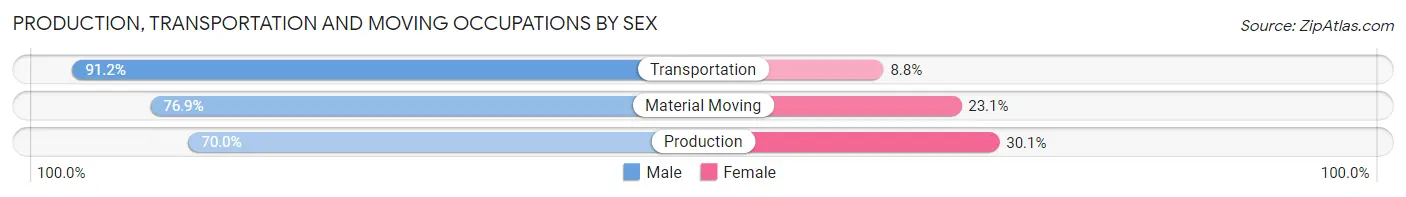
| Occupation | Male | Female |
| Production | 796 (70.0%) | 342 (30.0%) |
| Transportation | 1,452 (91.2%) | 140 (8.8%) |
| Material Moving | 1,047 (76.9%) | 314 (23.1%) |
| Total (Category) | 3,295 (80.5%) | 796 (19.5%) |
| Total (Overall) | 12,568 (58.8%) | 8,799 (41.2%) |
Employment Industries by Sex in San Jacinto
Employment Industries in San Jacinto
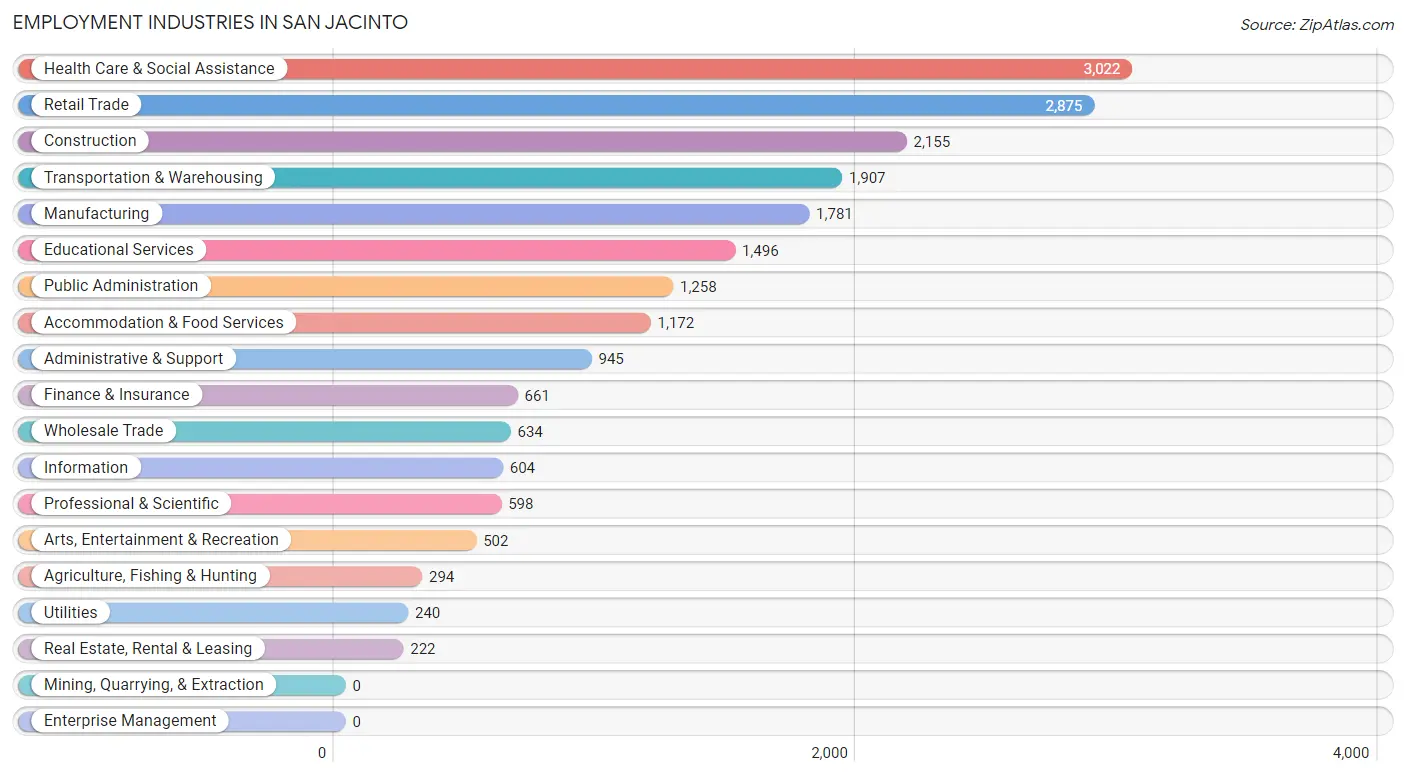
The major employment industries in San Jacinto include Health Care & Social Assistance (3,022 | 14.1%), Retail Trade (2,875 | 13.5%), Construction (2,155 | 10.1%), Transportation & Warehousing (1,907 | 8.9%), and Manufacturing (1,781 | 8.3%).
Employment Industries by Sex in San Jacinto
The San Jacinto industries that see more men than women are Agriculture, Fishing & Hunting (96.9%), Construction (95.8%), and Wholesale Trade (86.4%), whereas the industries that tend to have a higher number of women are Health Care & Social Assistance (77.1%), Information (68.0%), and Educational Services (61.7%).
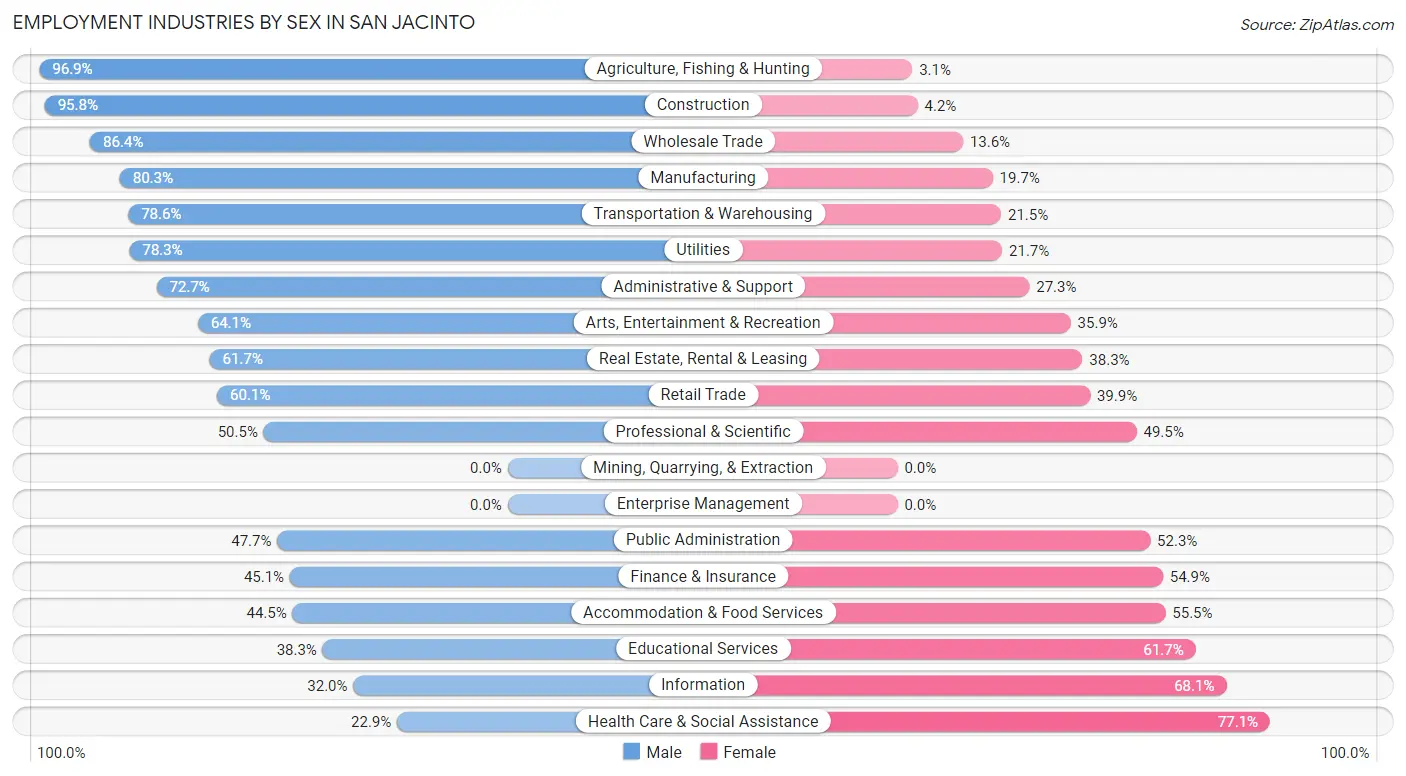
| Industry | Male | Female |
| Agriculture, Fishing & Hunting | 285 (96.9%) | 9 (3.1%) |
| Mining, Quarrying, & Extraction | 0 (0.0%) | 0 (0.0%) |
| Construction | 2,065 (95.8%) | 90 (4.2%) |
| Manufacturing | 1,430 (80.3%) | 351 (19.7%) |
| Wholesale Trade | 548 (86.4%) | 86 (13.6%) |
| Retail Trade | 1,729 (60.1%) | 1,146 (39.9%) |
| Transportation & Warehousing | 1,498 (78.5%) | 409 (21.4%) |
| Utilities | 188 (78.3%) | 52 (21.7%) |
| Information | 193 (32.0%) | 411 (68.0%) |
| Finance & Insurance | 298 (45.1%) | 363 (54.9%) |
| Real Estate, Rental & Leasing | 137 (61.7%) | 85 (38.3%) |
| Professional & Scientific | 302 (50.5%) | 296 (49.5%) |
| Enterprise Management | 0 (0.0%) | 0 (0.0%) |
| Administrative & Support | 687 (72.7%) | 258 (27.3%) |
| Educational Services | 573 (38.3%) | 923 (61.7%) |
| Health Care & Social Assistance | 692 (22.9%) | 2,330 (77.1%) |
| Arts, Entertainment & Recreation | 322 (64.1%) | 180 (35.9%) |
| Accommodation & Food Services | 522 (44.5%) | 650 (55.5%) |
| Public Administration | 600 (47.7%) | 658 (52.3%) |
| Total | 12,568 (58.8%) | 8,799 (41.2%) |
Education in San Jacinto
School Enrollment in San Jacinto
The most common levels of schooling among the 16,019 students in San Jacinto are high school (4,363 | 27.2%), middle school (4,166 | 26.0%), and college / undergraduate (2,751 | 17.2%).
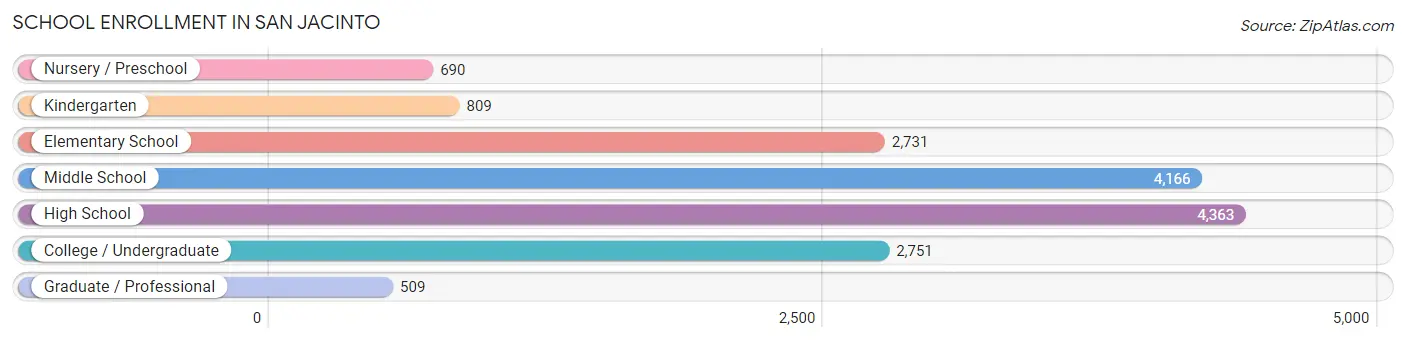
| School Level | # Students | % Students |
| Nursery / Preschool | 690 | 4.3% |
| Kindergarten | 809 | 5.1% |
| Elementary School | 2,731 | 17.1% |
| Middle School | 4,166 | 26.0% |
| High School | 4,363 | 27.2% |
| College / Undergraduate | 2,751 | 17.2% |
| Graduate / Professional | 509 | 3.2% |
| Total | 16,019 | 100.0% |
School Enrollment by Age by Funding Source in San Jacinto
Out of a total of 16,019 students who are enrolled in schools in San Jacinto, 1,282 (8.0%) attend a private institution, while the remaining 14,737 (92.0%) are enrolled in public schools. The age group of 3 to 4 year olds has the highest likelihood of being enrolled in private schools, with 198 (28.2% in the age bracket) enrolled. Conversely, the age group of 15 to 17 year olds has the lowest likelihood of being enrolled in a private school, with 3,175 (98.3% in the age bracket) attending a public institution.
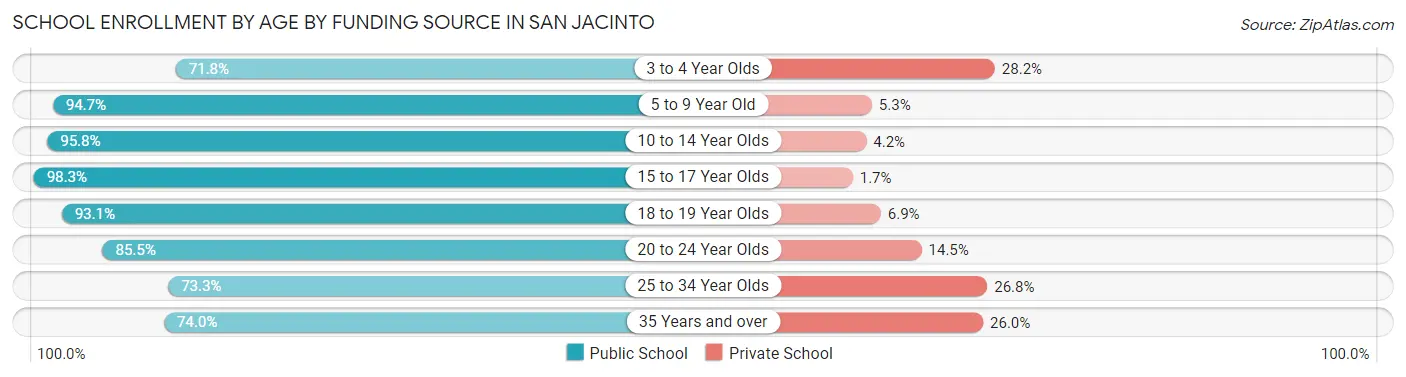
| Age Bracket | Public School | Private School |
| 3 to 4 Year Olds | 505 (71.8%) | 198 (28.2%) |
| 5 to 9 Year Old | 3,005 (94.7%) | 167 (5.3%) |
| 10 to 14 Year Olds | 5,006 (95.8%) | 221 (4.2%) |
| 15 to 17 Year Olds | 3,175 (98.3%) | 55 (1.7%) |
| 18 to 19 Year Olds | 901 (93.1%) | 67 (6.9%) |
| 20 to 24 Year Olds | 989 (85.5%) | 168 (14.5%) |
| 25 to 34 Year Olds | 501 (73.3%) | 183 (26.8%) |
| 35 Years and over | 650 (74.0%) | 228 (26.0%) |
| Total | 14,737 (92.0%) | 1,282 (8.0%) |
Educational Attainment by Field of Study in San Jacinto
Arts & humanities (869 | 19.8%), business (795 | 18.1%), liberal arts & history (503 | 11.5%), social sciences (357 | 8.1%), and science & technology (284 | 6.5%) are the most common fields of study among 4,384 individuals in San Jacinto who have obtained a bachelor's degree or higher.
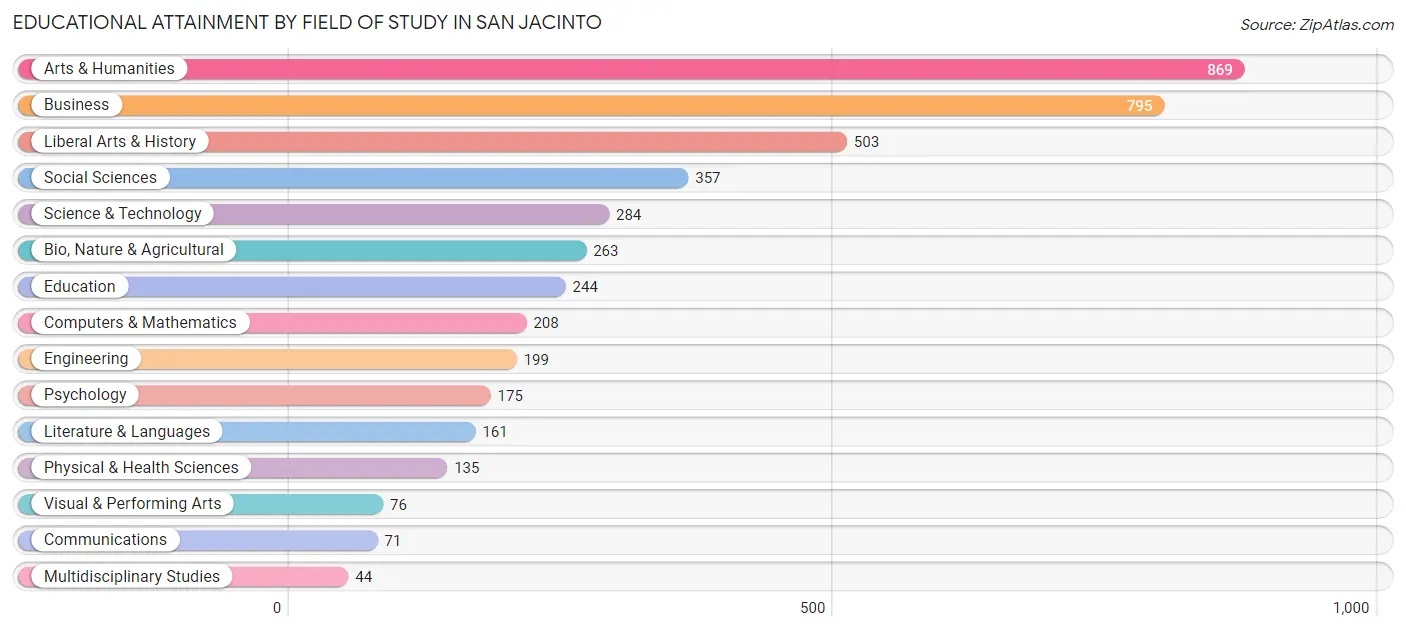
| Field of Study | # Graduates | % Graduates |
| Computers & Mathematics | 208 | 4.7% |
| Bio, Nature & Agricultural | 263 | 6.0% |
| Physical & Health Sciences | 135 | 3.1% |
| Psychology | 175 | 4.0% |
| Social Sciences | 357 | 8.1% |
| Engineering | 199 | 4.5% |
| Multidisciplinary Studies | 44 | 1.0% |
| Science & Technology | 284 | 6.5% |
| Business | 795 | 18.1% |
| Education | 244 | 5.6% |
| Literature & Languages | 161 | 3.7% |
| Liberal Arts & History | 503 | 11.5% |
| Visual & Performing Arts | 76 | 1.7% |
| Communications | 71 | 1.6% |
| Arts & Humanities | 869 | 19.8% |
| Total | 4,384 | 100.0% |
Transportation & Commute in San Jacinto
Vehicle Availability by Sex in San Jacinto
The most prevalent vehicle ownership categories in San Jacinto are males with 2 vehicles (4,084, accounting for 33.1%) and females with 2 vehicles (2,629, making up 48.0%).
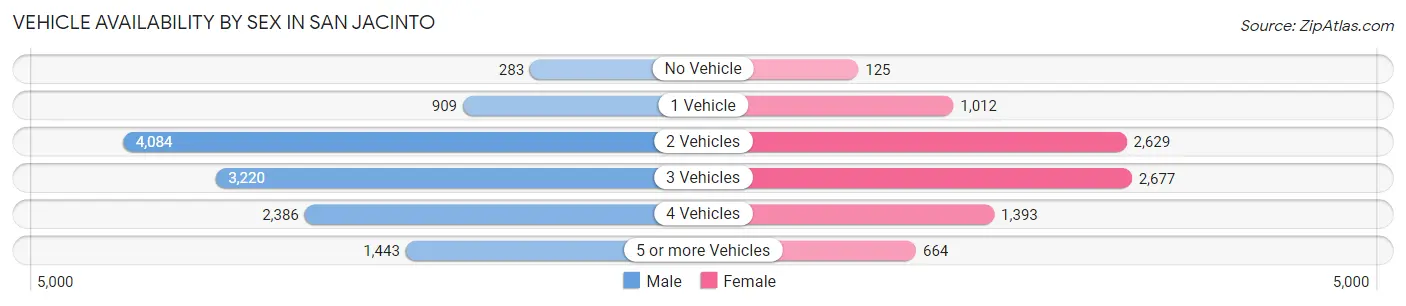
| Vehicles Available | Male | Female |
| No Vehicle | 283 (2.3%) | 125 (1.5%) |
| 1 Vehicle | 909 (7.4%) | 1,012 (11.9%) |
| 2 Vehicles | 4,084 (33.1%) | 2,629 (30.9%) |
| 3 Vehicles | 3,220 (26.1%) | 2,677 (31.5%) |
| 4 Vehicles | 2,386 (19.4%) | 1,393 (16.4%) |
| 5 or more Vehicles | 1,443 (11.7%) | 664 (7.8%) |
| Total | 12,325 (100.0%) | 8,500 (100.0%) |
Commute Time in San Jacinto
The most frequently occuring commute durations in San Jacinto are 90 or more minutes (2,643 commuters, 13.7%), 60 to 89 minutes (2,586 commuters, 13.4%), and 45 to 59 minutes (2,313 commuters, 12.0%).
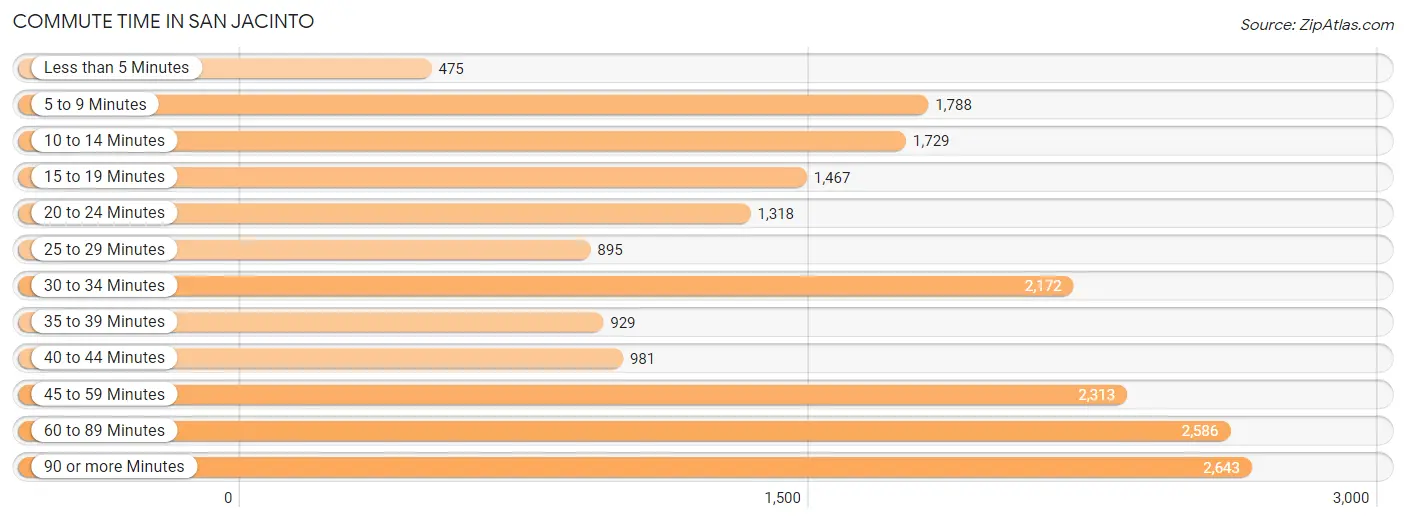
| Commute Time | # Commuters | % Commuters |
| Less than 5 Minutes | 475 | 2.5% |
| 5 to 9 Minutes | 1,788 | 9.3% |
| 10 to 14 Minutes | 1,729 | 9.0% |
| 15 to 19 Minutes | 1,467 | 7.6% |
| 20 to 24 Minutes | 1,318 | 6.8% |
| 25 to 29 Minutes | 895 | 4.6% |
| 30 to 34 Minutes | 2,172 | 11.3% |
| 35 to 39 Minutes | 929 | 4.8% |
| 40 to 44 Minutes | 981 | 5.1% |
| 45 to 59 Minutes | 2,313 | 12.0% |
| 60 to 89 Minutes | 2,586 | 13.4% |
| 90 or more Minutes | 2,643 | 13.7% |
Commute Time by Sex in San Jacinto
The most common commute times in San Jacinto are 60 to 89 minutes (1,958 commuters, 17.1%) for males and 5 to 9 minutes (1,152 commuters, 14.7%) for females.
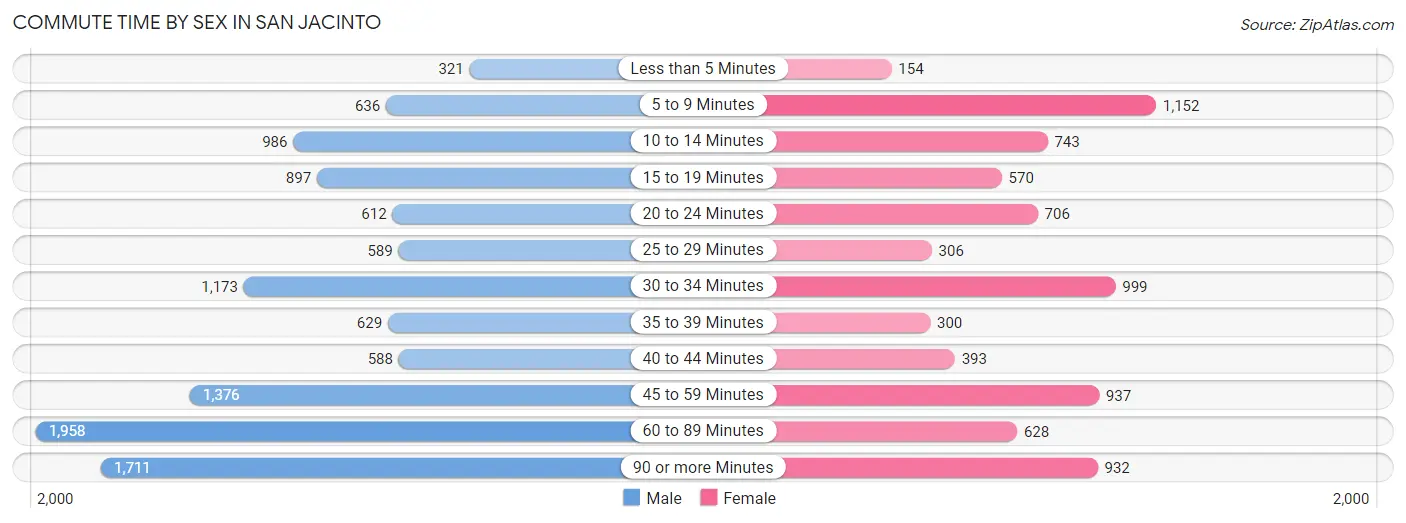
| Commute Time | Male | Female |
| Less than 5 Minutes | 321 (2.8%) | 154 (2.0%) |
| 5 to 9 Minutes | 636 (5.5%) | 1,152 (14.7%) |
| 10 to 14 Minutes | 986 (8.6%) | 743 (9.5%) |
| 15 to 19 Minutes | 897 (7.8%) | 570 (7.3%) |
| 20 to 24 Minutes | 612 (5.3%) | 706 (9.0%) |
| 25 to 29 Minutes | 589 (5.1%) | 306 (3.9%) |
| 30 to 34 Minutes | 1,173 (10.2%) | 999 (12.8%) |
| 35 to 39 Minutes | 629 (5.5%) | 300 (3.8%) |
| 40 to 44 Minutes | 588 (5.1%) | 393 (5.0%) |
| 45 to 59 Minutes | 1,376 (12.0%) | 937 (12.0%) |
| 60 to 89 Minutes | 1,958 (17.1%) | 628 (8.0%) |
| 90 or more Minutes | 1,711 (14.9%) | 932 (11.9%) |
Time of Departure to Work by Sex in San Jacinto
The most frequent times of departure to work in San Jacinto are 12:00 AM to 4:59 AM (2,487, 21.7%) for males and 7:00 AM to 7:29 AM (1,072, 13.7%) for females.
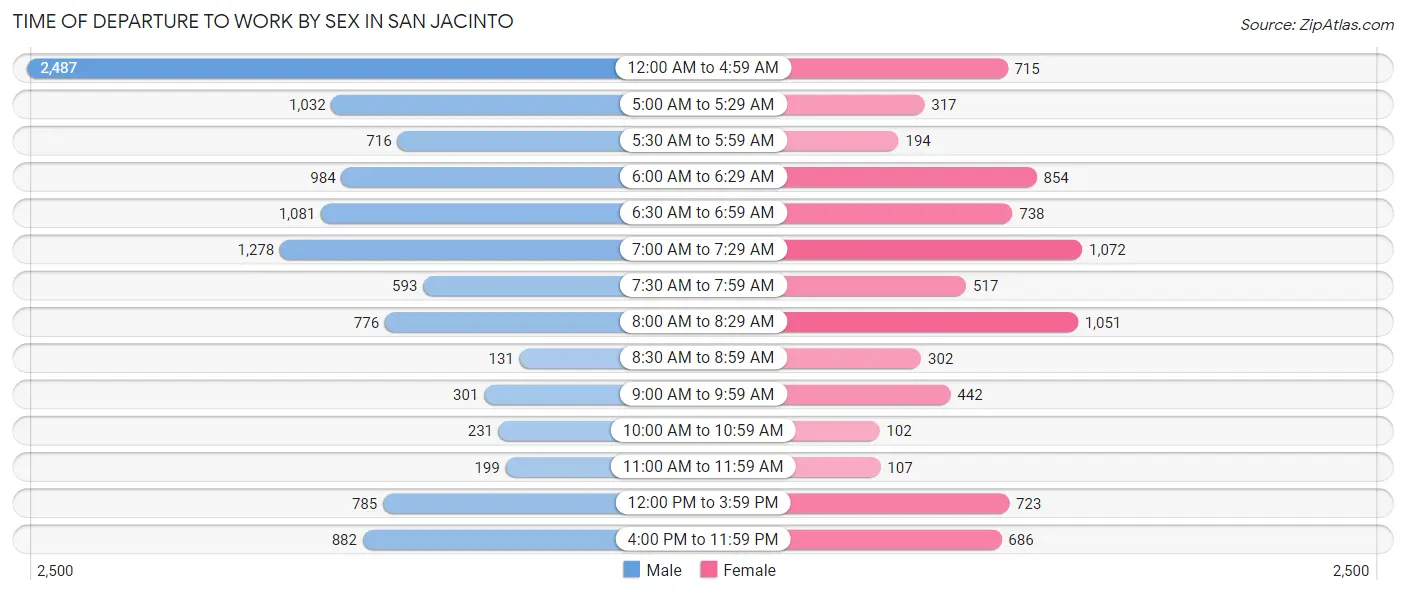
| Time of Departure | Male | Female |
| 12:00 AM to 4:59 AM | 2,487 (21.7%) | 715 (9.1%) |
| 5:00 AM to 5:29 AM | 1,032 (9.0%) | 317 (4.1%) |
| 5:30 AM to 5:59 AM | 716 (6.2%) | 194 (2.5%) |
| 6:00 AM to 6:29 AM | 984 (8.6%) | 854 (10.9%) |
| 6:30 AM to 6:59 AM | 1,081 (9.4%) | 738 (9.4%) |
| 7:00 AM to 7:29 AM | 1,278 (11.1%) | 1,072 (13.7%) |
| 7:30 AM to 7:59 AM | 593 (5.2%) | 517 (6.6%) |
| 8:00 AM to 8:29 AM | 776 (6.8%) | 1,051 (13.4%) |
| 8:30 AM to 8:59 AM | 131 (1.1%) | 302 (3.9%) |
| 9:00 AM to 9:59 AM | 301 (2.6%) | 442 (5.7%) |
| 10:00 AM to 10:59 AM | 231 (2.0%) | 102 (1.3%) |
| 11:00 AM to 11:59 AM | 199 (1.7%) | 107 (1.4%) |
| 12:00 PM to 3:59 PM | 785 (6.8%) | 723 (9.2%) |
| 4:00 PM to 11:59 PM | 882 (7.7%) | 686 (8.8%) |
| Total | 11,476 (100.0%) | 7,820 (100.0%) |
Housing Occupancy in San Jacinto
Occupancy by Ownership in San Jacinto
Of the total 14,426 dwellings in San Jacinto, owner-occupied units account for 10,320 (71.5%), while renter-occupied units make up 4,106 (28.5%).
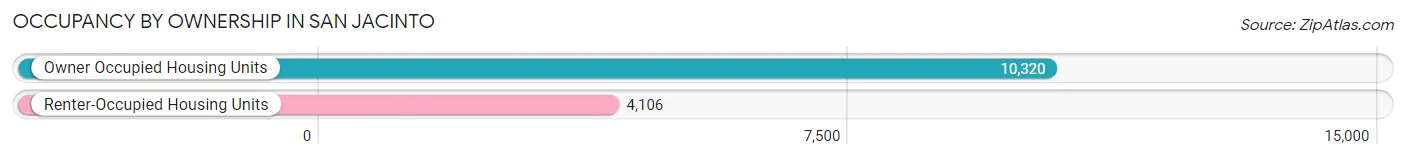
| Occupancy | # Housing Units | % Housing Units |
| Owner Occupied Housing Units | 10,320 | 71.5% |
| Renter-Occupied Housing Units | 4,106 | 28.5% |
| Total Occupied Housing Units | 14,426 | 100.0% |
Occupancy by Household Size in San Jacinto
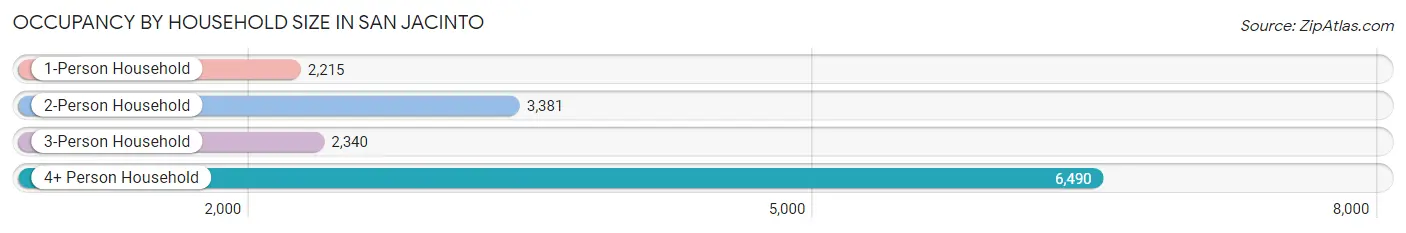
| Household Size | # Housing Units | % Housing Units |
| 1-Person Household | 2,215 | 15.3% |
| 2-Person Household | 3,381 | 23.4% |
| 3-Person Household | 2,340 | 16.2% |
| 4+ Person Household | 6,490 | 45.0% |
| Total Housing Units | 14,426 | 100.0% |
Occupancy by Ownership by Household Size in San Jacinto
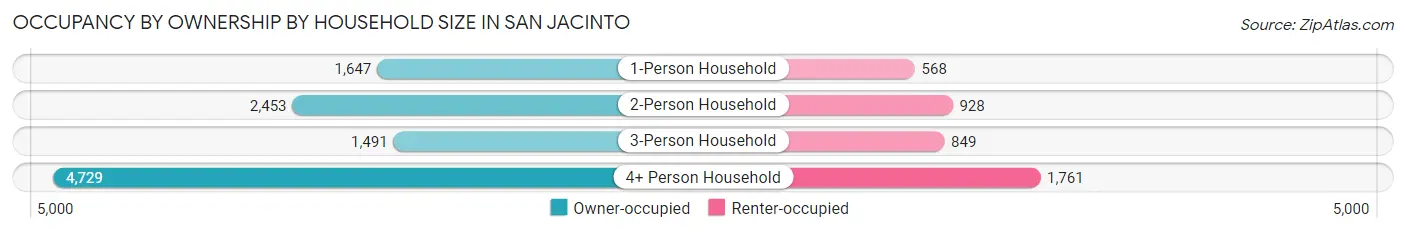
| Household Size | Owner-occupied | Renter-occupied |
| 1-Person Household | 1,647 (74.4%) | 568 (25.6%) |
| 2-Person Household | 2,453 (72.6%) | 928 (27.5%) |
| 3-Person Household | 1,491 (63.7%) | 849 (36.3%) |
| 4+ Person Household | 4,729 (72.9%) | 1,761 (27.1%) |
| Total Housing Units | 10,320 (71.5%) | 4,106 (28.5%) |
Occupancy by Educational Attainment in San Jacinto
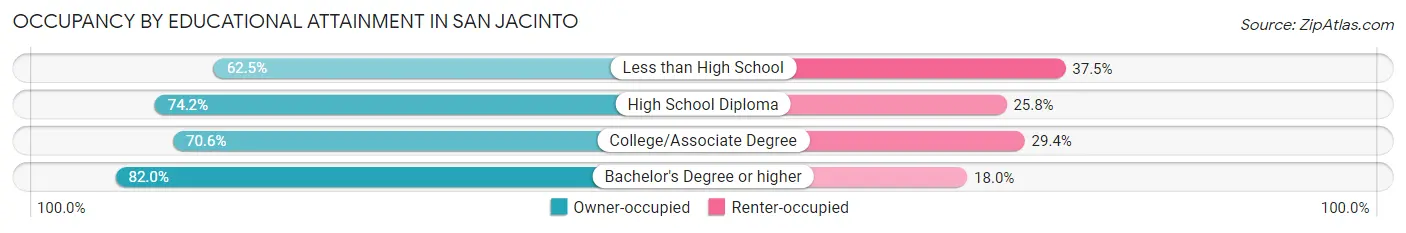
| Household Size | Owner-occupied | Renter-occupied |
| Less than High School | 1,834 (62.5%) | 1,101 (37.5%) |
| High School Diploma | 2,688 (74.2%) | 936 (25.8%) |
| College/Associate Degree | 4,021 (70.6%) | 1,678 (29.4%) |
| Bachelor's Degree or higher | 1,777 (82.0%) | 391 (18.0%) |
Occupancy by Age of Householder in San Jacinto
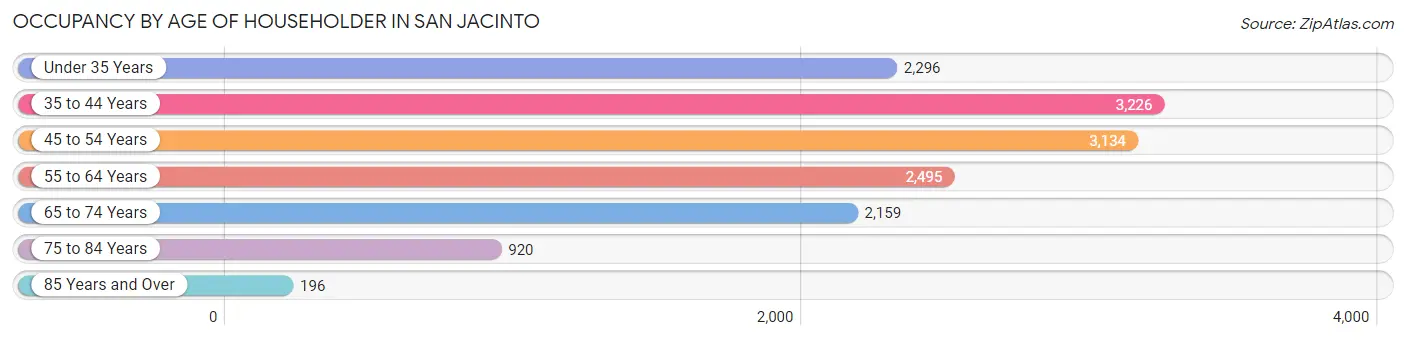
| Age Bracket | # Households | % Households |
| Under 35 Years | 2,296 | 15.9% |
| 35 to 44 Years | 3,226 | 22.4% |
| 45 to 54 Years | 3,134 | 21.7% |
| 55 to 64 Years | 2,495 | 17.3% |
| 65 to 74 Years | 2,159 | 15.0% |
| 75 to 84 Years | 920 | 6.4% |
| 85 Years and Over | 196 | 1.4% |
| Total | 14,426 | 100.0% |
Housing Finances in San Jacinto
Median Income by Occupancy in San Jacinto
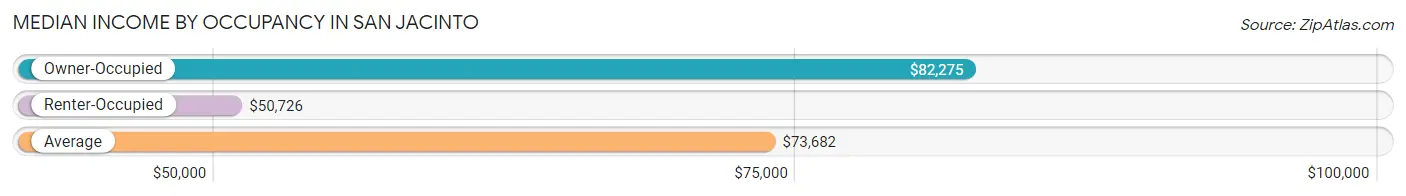
| Occupancy Type | # Households | Median Income |
| Owner-Occupied | 10,320 (71.5%) | $82,275 |
| Renter-Occupied | 4,106 (28.5%) | $50,726 |
| Average | 14,426 (100.0%) | $73,682 |
Occupancy by Householder Income Bracket in San Jacinto
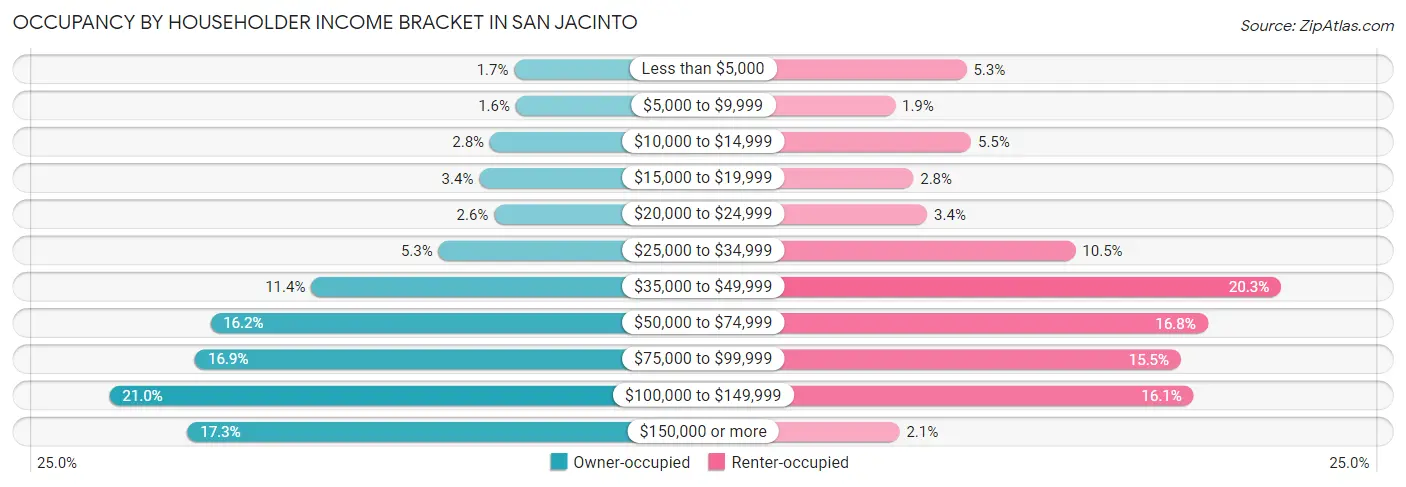
| Income Bracket | Owner-occupied | Renter-occupied |
| Less than $5,000 | 173 (1.7%) | 217 (5.3%) |
| $5,000 to $9,999 | 166 (1.6%) | 77 (1.9%) |
| $10,000 to $14,999 | 293 (2.8%) | 226 (5.5%) |
| $15,000 to $19,999 | 346 (3.4%) | 113 (2.8%) |
| $20,000 to $24,999 | 272 (2.6%) | 140 (3.4%) |
| $25,000 to $34,999 | 546 (5.3%) | 430 (10.5%) |
| $35,000 to $49,999 | 1,171 (11.4%) | 832 (20.3%) |
| $50,000 to $74,999 | 1,668 (16.2%) | 688 (16.8%) |
| $75,000 to $99,999 | 1,742 (16.9%) | 636 (15.5%) |
| $100,000 to $149,999 | 2,163 (21.0%) | 661 (16.1%) |
| $150,000 or more | 1,780 (17.2%) | 86 (2.1%) |
| Total | 10,320 (100.0%) | 4,106 (100.0%) |
Monthly Housing Cost Tiers in San Jacinto
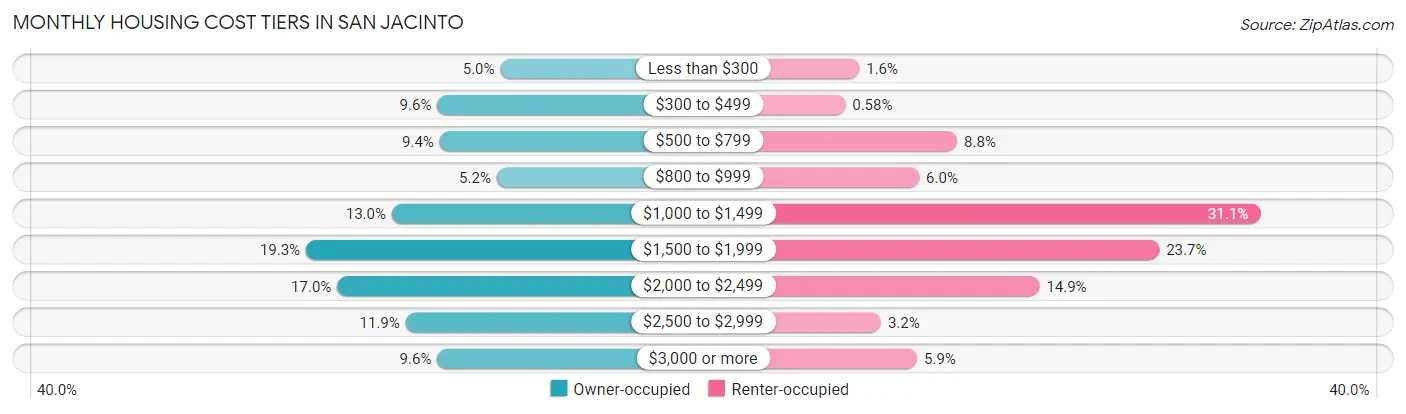
| Monthly Cost | Owner-occupied | Renter-occupied |
| Less than $300 | 512 (5.0%) | 66 (1.6%) |
| $300 to $499 | 992 (9.6%) | 24 (0.6%) |
| $500 to $799 | 973 (9.4%) | 362 (8.8%) |
| $800 to $999 | 540 (5.2%) | 247 (6.0%) |
| $1,000 to $1,499 | 1,337 (13.0%) | 1,278 (31.1%) |
| $1,500 to $1,999 | 1,990 (19.3%) | 973 (23.7%) |
| $2,000 to $2,499 | 1,752 (17.0%) | 611 (14.9%) |
| $2,500 to $2,999 | 1,232 (11.9%) | 132 (3.2%) |
| $3,000 or more | 992 (9.6%) | 241 (5.9%) |
| Total | 10,320 (100.0%) | 4,106 (100.0%) |
Physical Housing Characteristics in San Jacinto
Housing Structures in San Jacinto
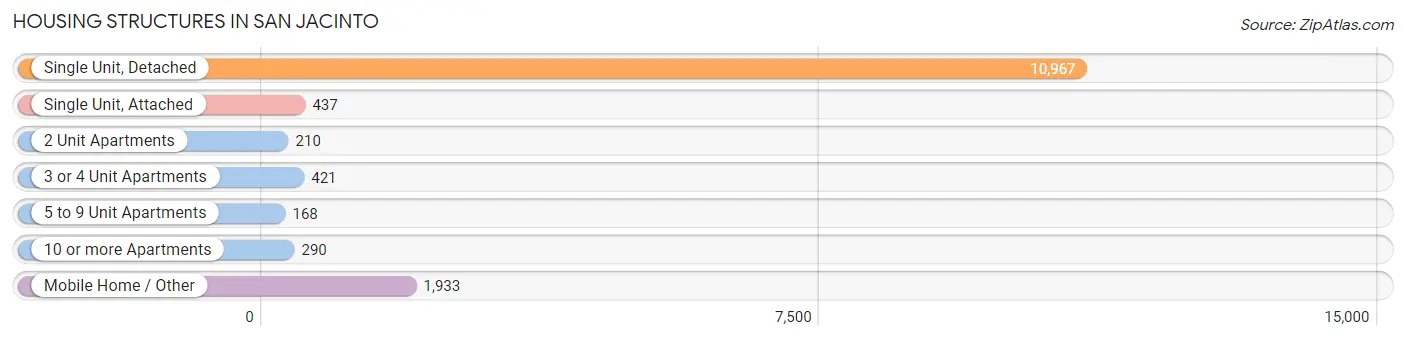
| Structure Type | # Housing Units | % Housing Units |
| Single Unit, Detached | 10,967 | 76.0% |
| Single Unit, Attached | 437 | 3.0% |
| 2 Unit Apartments | 210 | 1.5% |
| 3 or 4 Unit Apartments | 421 | 2.9% |
| 5 to 9 Unit Apartments | 168 | 1.2% |
| 10 or more Apartments | 290 | 2.0% |
| Mobile Home / Other | 1,933 | 13.4% |
| Total | 14,426 | 100.0% |
Housing Structures by Occupancy in San Jacinto
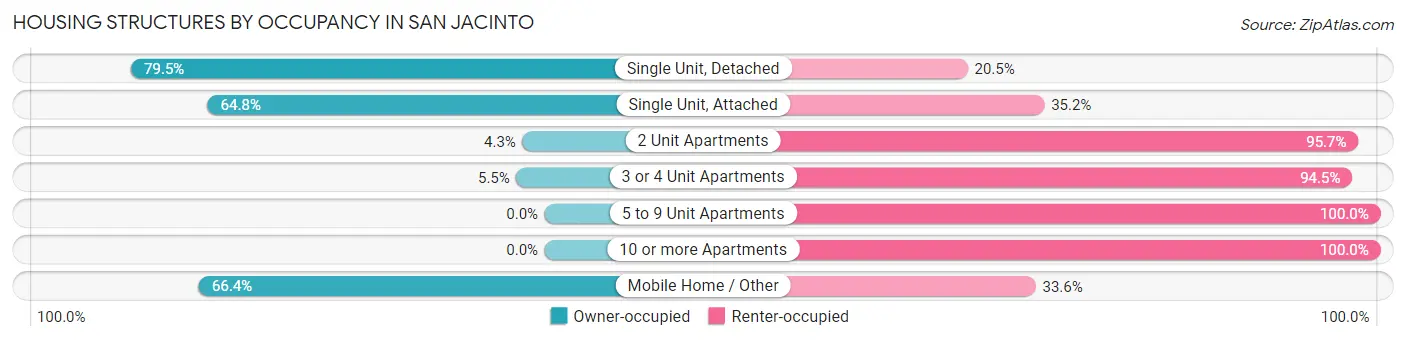
| Structure Type | Owner-occupied | Renter-occupied |
| Single Unit, Detached | 8,721 (79.5%) | 2,246 (20.5%) |
| Single Unit, Attached | 283 (64.8%) | 154 (35.2%) |
| 2 Unit Apartments | 9 (4.3%) | 201 (95.7%) |
| 3 or 4 Unit Apartments | 23 (5.5%) | 398 (94.5%) |
| 5 to 9 Unit Apartments | 0 (0.0%) | 168 (100.0%) |
| 10 or more Apartments | 0 (0.0%) | 290 (100.0%) |
| Mobile Home / Other | 1,284 (66.4%) | 649 (33.6%) |
| Total | 10,320 (71.5%) | 4,106 (28.5%) |
Housing Structures by Number of Rooms in San Jacinto
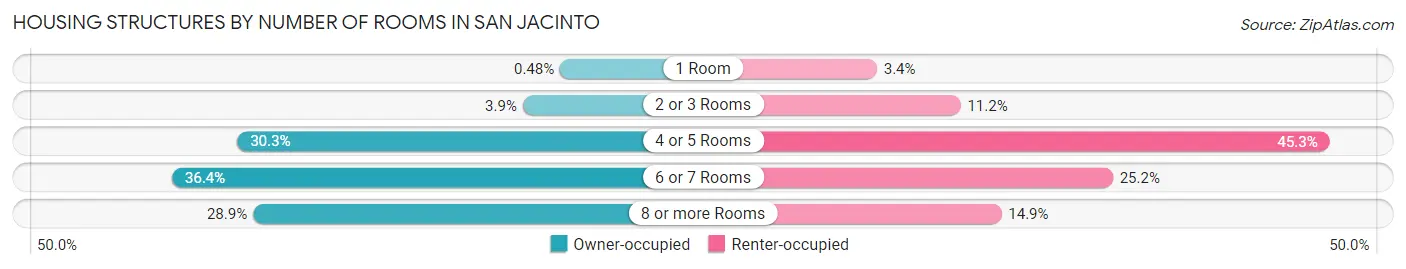
| Number of Rooms | Owner-occupied | Renter-occupied |
| 1 Room | 50 (0.5%) | 140 (3.4%) |
| 2 or 3 Rooms | 406 (3.9%) | 458 (11.2%) |
| 4 or 5 Rooms | 3,130 (30.3%) | 1,859 (45.3%) |
| 6 or 7 Rooms | 3,754 (36.4%) | 1,036 (25.2%) |
| 8 or more Rooms | 2,980 (28.9%) | 613 (14.9%) |
| Total | 10,320 (100.0%) | 4,106 (100.0%) |
Housing Structure by Heating Type in San Jacinto
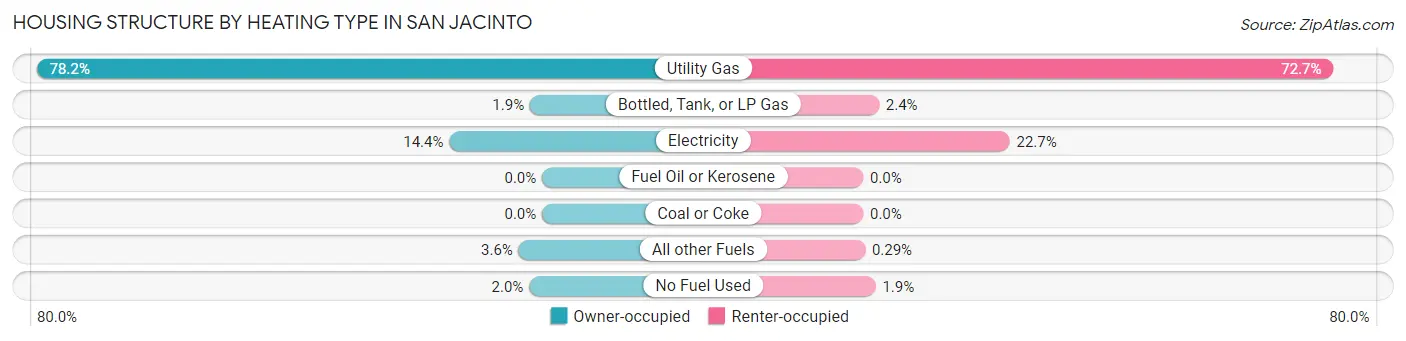
| Heating Type | Owner-occupied | Renter-occupied |
| Utility Gas | 8,066 (78.2%) | 2,985 (72.7%) |
| Bottled, Tank, or LP Gas | 193 (1.9%) | 100 (2.4%) |
| Electricity | 1,481 (14.3%) | 930 (22.7%) |
| Fuel Oil or Kerosene | 0 (0.0%) | 0 (0.0%) |
| Coal or Coke | 0 (0.0%) | 0 (0.0%) |
| All other Fuels | 374 (3.6%) | 12 (0.3%) |
| No Fuel Used | 206 (2.0%) | 79 (1.9%) |
| Total | 10,320 (100.0%) | 4,106 (100.0%) |
Household Vehicle Usage in San Jacinto
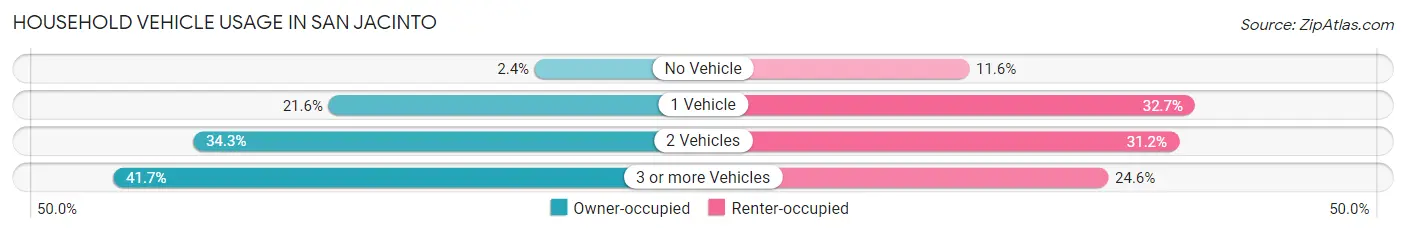
| Vehicles per Household | Owner-occupied | Renter-occupied |
| No Vehicle | 244 (2.4%) | 476 (11.6%) |
| 1 Vehicle | 2,230 (21.6%) | 1,341 (32.7%) |
| 2 Vehicles | 3,538 (34.3%) | 1,280 (31.2%) |
| 3 or more Vehicles | 4,308 (41.7%) | 1,009 (24.6%) |
| Total | 10,320 (100.0%) | 4,106 (100.0%) |
Real Estate & Mortgages in San Jacinto
Real Estate and Mortgage Overview in San Jacinto
| Characteristic | Without Mortgage | With Mortgage |
| Housing Units | 2,953 | 7,367 |
| Median Property Value | $222,700 | $368,200 |
| Median Household Income | $51,116 | $1,495 |
| Monthly Housing Costs | $516 | $983 |
| Real Estate Taxes | $1,900 | $69 |
Property Value by Mortgage Status in San Jacinto
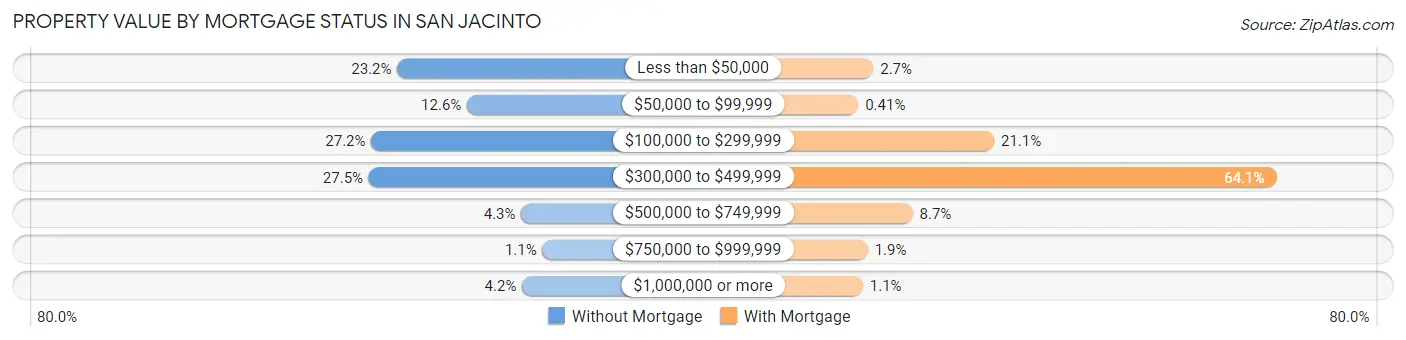
| Property Value | Without Mortgage | With Mortgage |
| Less than $50,000 | 685 (23.2%) | 199 (2.7%) |
| $50,000 to $99,999 | 371 (12.6%) | 30 (0.4%) |
| $100,000 to $299,999 | 802 (27.2%) | 1,555 (21.1%) |
| $300,000 to $499,999 | 813 (27.5%) | 4,724 (64.1%) |
| $500,000 to $749,999 | 127 (4.3%) | 640 (8.7%) |
| $750,000 to $999,999 | 32 (1.1%) | 137 (1.9%) |
| $1,000,000 or more | 123 (4.2%) | 82 (1.1%) |
| Total | 2,953 (100.0%) | 7,367 (100.0%) |
Household Income by Mortgage Status in San Jacinto
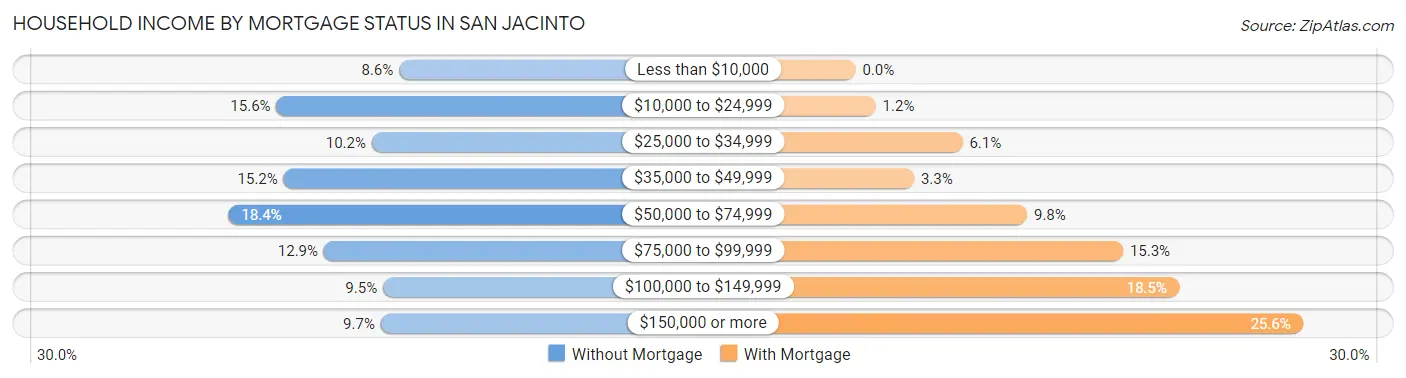
| Household Income | Without Mortgage | With Mortgage |
| Less than $10,000 | 254 (8.6%) | 0 (0.0%) |
| $10,000 to $24,999 | 461 (15.6%) | 85 (1.1%) |
| $25,000 to $34,999 | 300 (10.2%) | 450 (6.1%) |
| $35,000 to $49,999 | 449 (15.2%) | 246 (3.3%) |
| $50,000 to $74,999 | 542 (18.3%) | 722 (9.8%) |
| $75,000 to $99,999 | 381 (12.9%) | 1,126 (15.3%) |
| $100,000 to $149,999 | 281 (9.5%) | 1,361 (18.5%) |
| $150,000 or more | 285 (9.7%) | 1,882 (25.6%) |
| Total | 2,953 (100.0%) | 7,367 (100.0%) |
Property Value to Household Income Ratio in San Jacinto
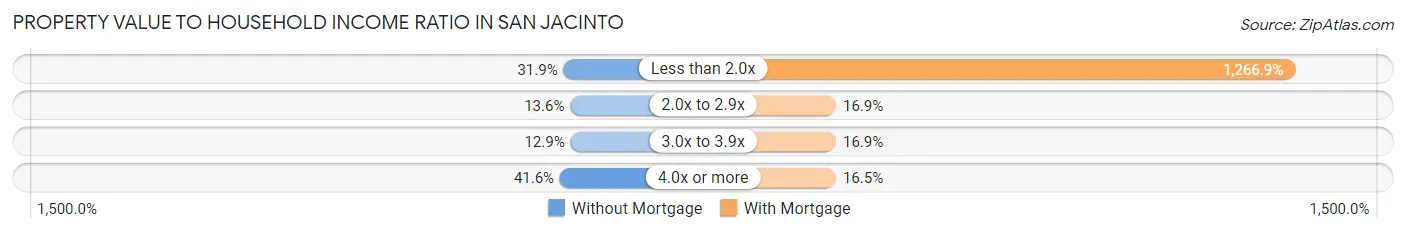
| Value-to-Income Ratio | Without Mortgage | With Mortgage |
| Less than 2.0x | 943 (31.9%) | 93,329 (1,266.8%) |
| 2.0x to 2.9x | 400 (13.6%) | 1,244 (16.9%) |
| 3.0x to 3.9x | 381 (12.9%) | 1,246 (16.9%) |
| 4.0x or more | 1,229 (41.6%) | 1,213 (16.5%) |
| Total | 2,953 (100.0%) | 7,367 (100.0%) |
Real Estate Taxes by Mortgage Status in San Jacinto
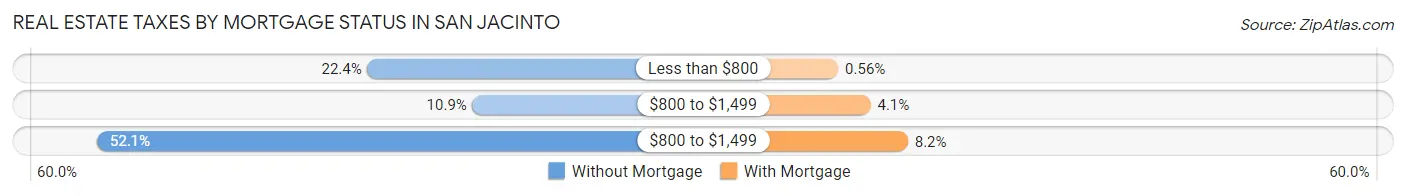
| Property Taxes | Without Mortgage | With Mortgage |
| Less than $800 | 662 (22.4%) | 41 (0.6%) |
| $800 to $1,499 | 322 (10.9%) | 303 (4.1%) |
| $800 to $1,499 | 1,538 (52.1%) | 603 (8.2%) |
| Total | 2,953 (100.0%) | 7,367 (100.0%) |
Health & Disability in San Jacinto
Health Insurance Coverage by Age in San Jacinto
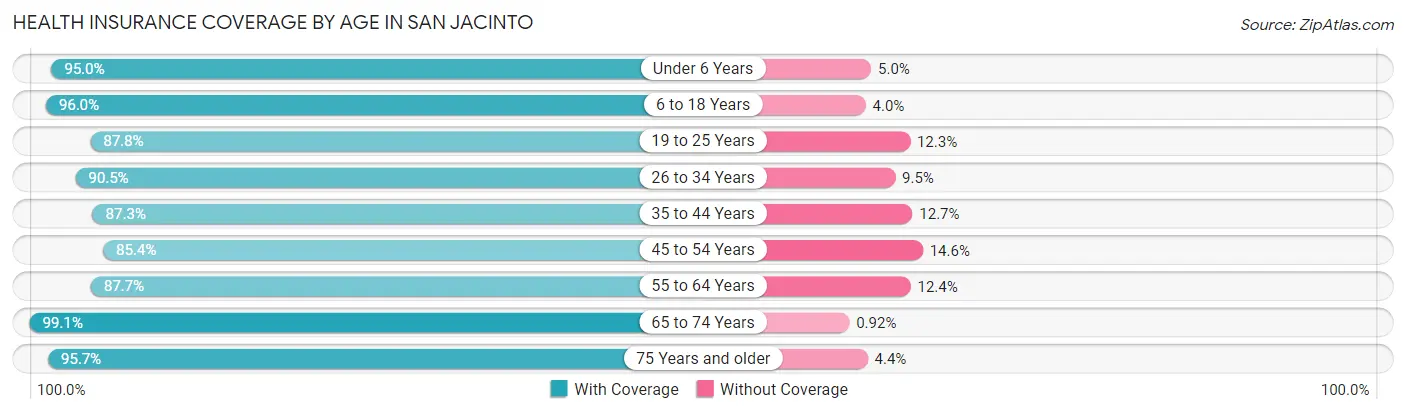
| Age Bracket | With Coverage | Without Coverage |
| Under 6 Years | 4,413 (95.0%) | 232 (5.0%) |
| 6 to 18 Years | 11,911 (96.0%) | 492 (4.0%) |
| 19 to 25 Years | 5,051 (87.7%) | 705 (12.2%) |
| 26 to 34 Years | 6,179 (90.5%) | 647 (9.5%) |
| 35 to 44 Years | 6,425 (87.3%) | 934 (12.7%) |
| 45 to 54 Years | 4,866 (85.4%) | 834 (14.6%) |
| 55 to 64 Years | 4,448 (87.6%) | 627 (12.3%) |
| 65 to 74 Years | 3,763 (99.1%) | 35 (0.9%) |
| 75 Years and older | 2,157 (95.7%) | 98 (4.3%) |
| Total | 49,213 (91.4%) | 4,604 (8.6%) |
Health Insurance Coverage by Citizenship Status in San Jacinto
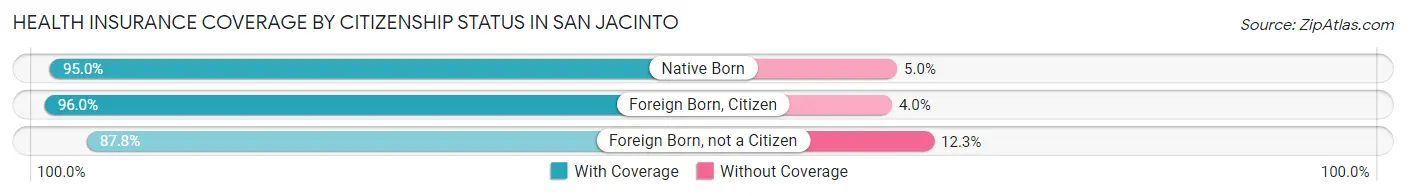
| Citizenship Status | With Coverage | Without Coverage |
| Native Born | 4,413 (95.0%) | 232 (5.0%) |
| Foreign Born, Citizen | 11,911 (96.0%) | 492 (4.0%) |
| Foreign Born, not a Citizen | 5,051 (87.7%) | 705 (12.2%) |
Health Insurance Coverage by Household Income in San Jacinto
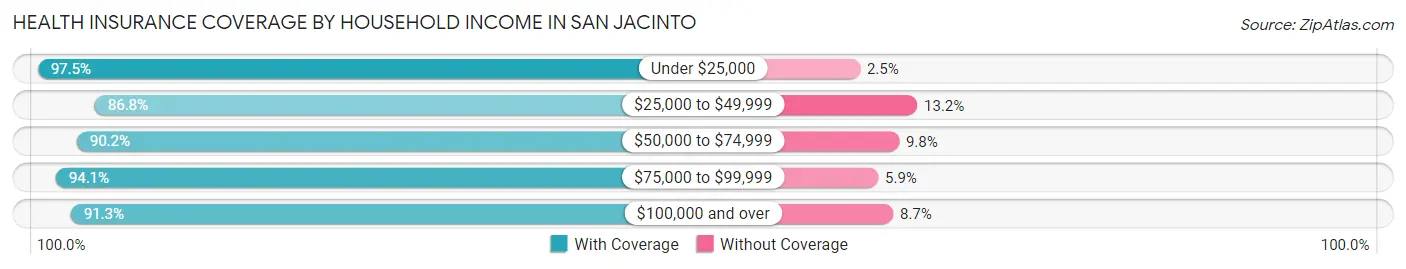
| Household Income | With Coverage | Without Coverage |
| Under $25,000 | 4,639 (97.5%) | 117 (2.5%) |
| $25,000 to $49,999 | 7,691 (86.8%) | 1,167 (13.2%) |
| $50,000 to $74,999 | 7,870 (90.2%) | 853 (9.8%) |
| $75,000 to $99,999 | 9,438 (94.1%) | 587 (5.9%) |
| $100,000 and over | 19,432 (91.3%) | 1,843 (8.7%) |
Public vs Private Health Insurance Coverage by Age in San Jacinto
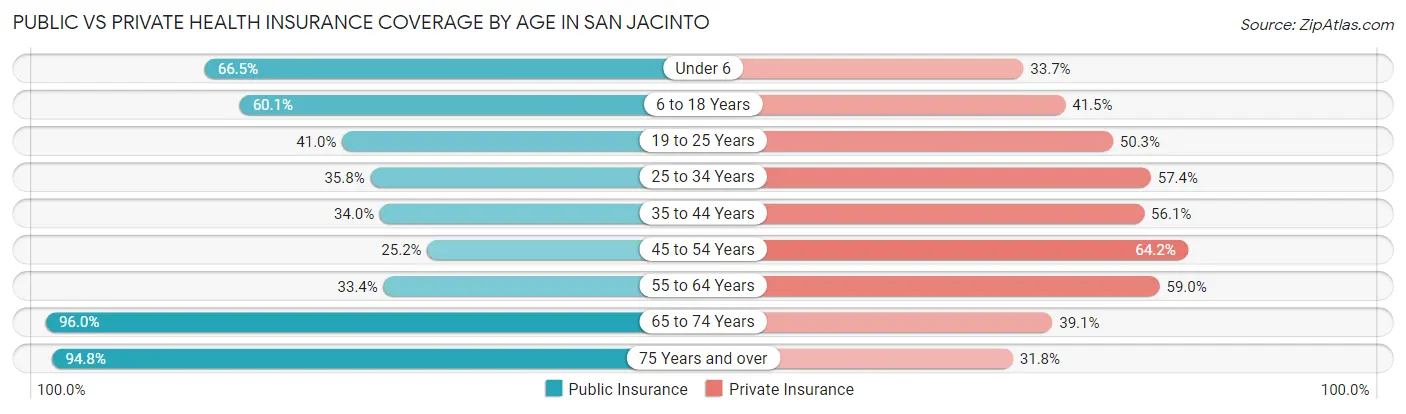
| Age Bracket | Public Insurance | Private Insurance |
| Under 6 | 3,091 (66.5%) | 1,566 (33.7%) |
| 6 to 18 Years | 7,450 (60.1%) | 5,146 (41.5%) |
| 19 to 25 Years | 2,361 (41.0%) | 2,896 (50.3%) |
| 25 to 34 Years | 2,444 (35.8%) | 3,915 (57.4%) |
| 35 to 44 Years | 2,503 (34.0%) | 4,130 (56.1%) |
| 45 to 54 Years | 1,438 (25.2%) | 3,659 (64.2%) |
| 55 to 64 Years | 1,693 (33.4%) | 2,993 (59.0%) |
| 65 to 74 Years | 3,647 (96.0%) | 1,484 (39.1%) |
| 75 Years and over | 2,138 (94.8%) | 716 (31.8%) |
| Total | 26,765 (49.7%) | 26,505 (49.2%) |
Disability Status by Sex by Age in San Jacinto
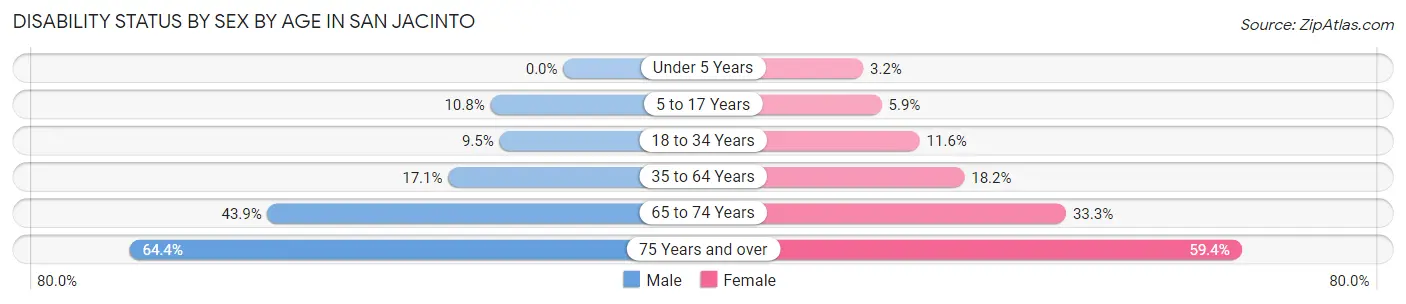
| Age Bracket | Male | Female |
| Under 5 Years | 0 (0.0%) | 60 (3.2%) |
| 5 to 17 Years | 659 (10.8%) | 351 (5.9%) |
| 18 to 34 Years | 686 (9.5%) | 727 (11.6%) |
| 35 to 64 Years | 1,540 (17.1%) | 1,659 (18.2%) |
| 65 to 74 Years | 726 (43.9%) | 714 (33.3%) |
| 75 Years and over | 543 (64.4%) | 838 (59.4%) |
Disability Class by Sex by Age in San Jacinto
Disability Class: Hearing Difficulty
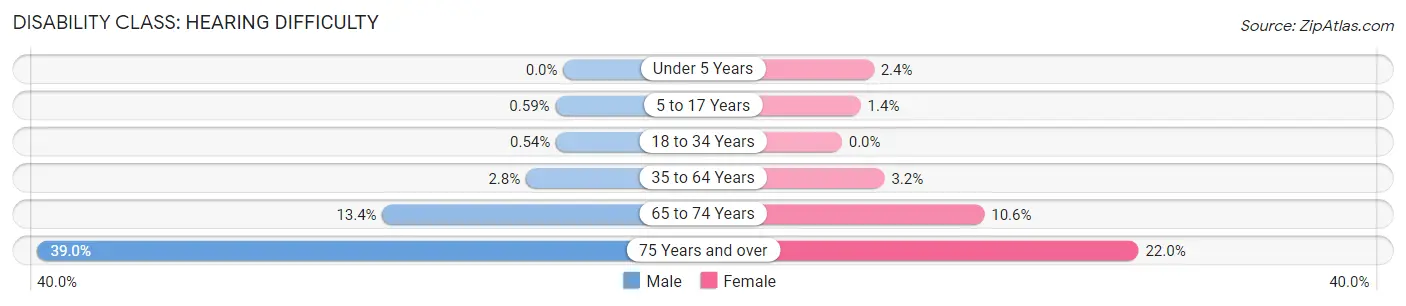
| Age Bracket | Male | Female |
| Under 5 Years | 0 (0.0%) | 45 (2.4%) |
| 5 to 17 Years | 36 (0.6%) | 83 (1.4%) |
| 18 to 34 Years | 39 (0.5%) | 0 (0.0%) |
| 35 to 64 Years | 250 (2.8%) | 289 (3.2%) |
| 65 to 74 Years | 222 (13.4%) | 227 (10.6%) |
| 75 Years and over | 329 (39.0%) | 311 (22.0%) |
Disability Class: Vision Difficulty
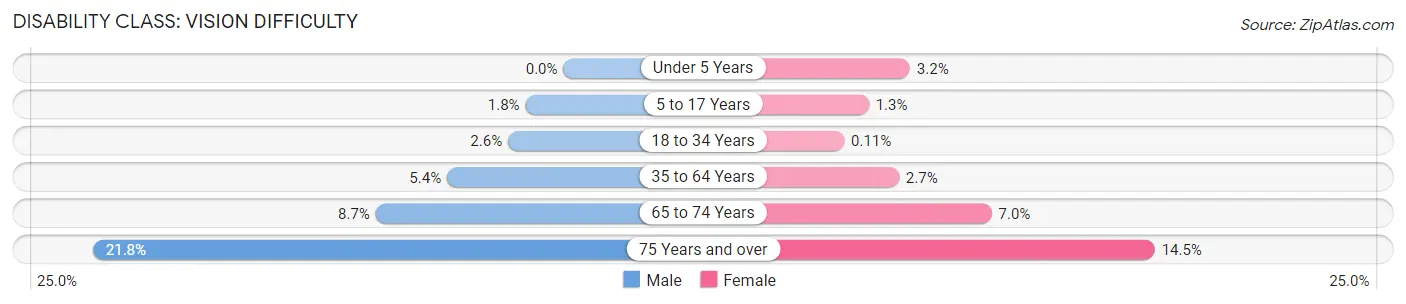
| Age Bracket | Male | Female |
| Under 5 Years | 0 (0.0%) | 60 (3.2%) |
| 5 to 17 Years | 107 (1.8%) | 74 (1.3%) |
| 18 to 34 Years | 186 (2.6%) | 7 (0.1%) |
| 35 to 64 Years | 487 (5.4%) | 242 (2.6%) |
| 65 to 74 Years | 144 (8.7%) | 149 (7.0%) |
| 75 Years and over | 184 (21.8%) | 205 (14.5%) |
Disability Class: Cognitive Difficulty
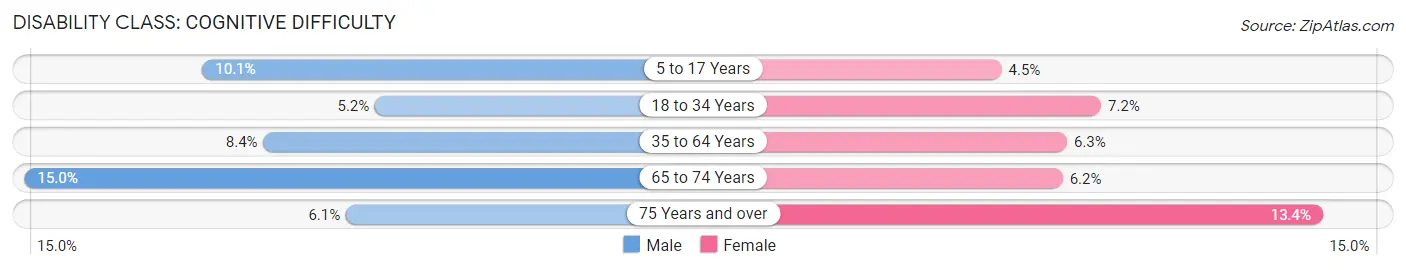
| Age Bracket | Male | Female |
| 5 to 17 Years | 612 (10.1%) | 264 (4.4%) |
| 18 to 34 Years | 379 (5.2%) | 454 (7.2%) |
| 35 to 64 Years | 753 (8.4%) | 572 (6.3%) |
| 65 to 74 Years | 248 (15.0%) | 132 (6.1%) |
| 75 Years and over | 51 (6.0%) | 189 (13.4%) |
Disability Class: Ambulatory Difficulty
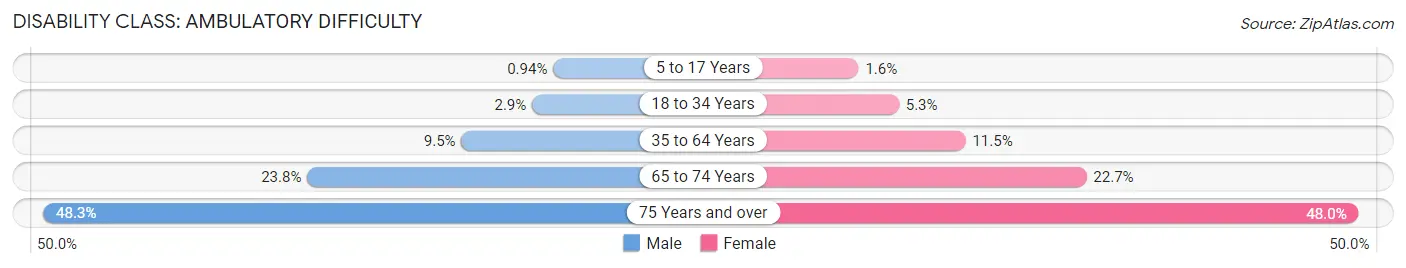
| Age Bracket | Male | Female |
| 5 to 17 Years | 57 (0.9%) | 92 (1.5%) |
| 18 to 34 Years | 210 (2.9%) | 333 (5.3%) |
| 35 to 64 Years | 853 (9.5%) | 1,047 (11.5%) |
| 65 to 74 Years | 393 (23.8%) | 487 (22.7%) |
| 75 Years and over | 407 (48.3%) | 677 (47.9%) |
Disability Class: Self-Care Difficulty
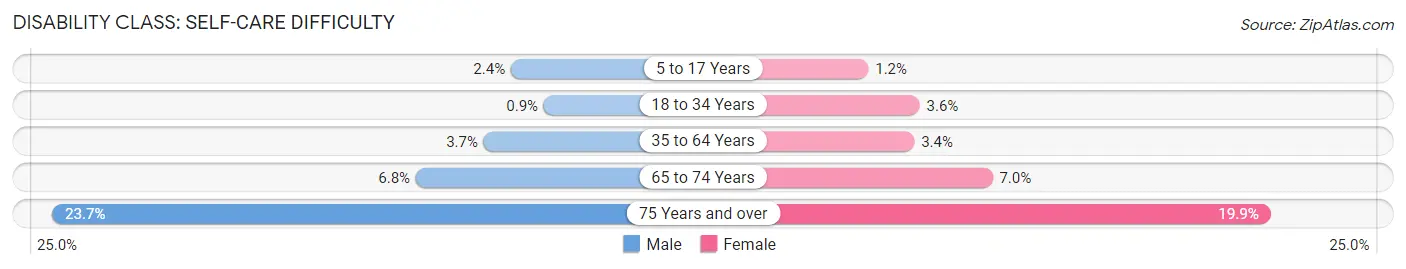
| Age Bracket | Male | Female |
| 5 to 17 Years | 148 (2.4%) | 73 (1.2%) |
| 18 to 34 Years | 65 (0.9%) | 227 (3.6%) |
| 35 to 64 Years | 333 (3.7%) | 306 (3.4%) |
| 65 to 74 Years | 113 (6.8%) | 150 (7.0%) |
| 75 Years and over | 200 (23.7%) | 281 (19.9%) |
Technology Access in San Jacinto
Computing Device Access in San Jacinto
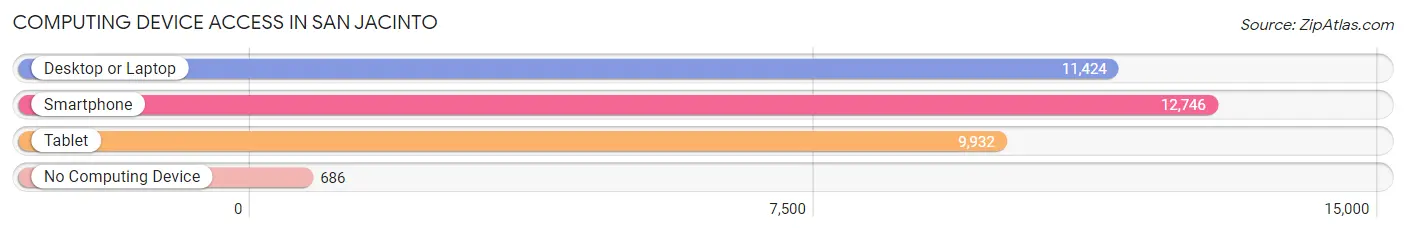
| Device Type | # Households | % Households |
| Desktop or Laptop | 11,424 | 79.2% |
| Smartphone | 12,746 | 88.3% |
| Tablet | 9,932 | 68.9% |
| No Computing Device | 686 | 4.8% |
| Total | 14,426 | 100.0% |
Internet Access in San Jacinto
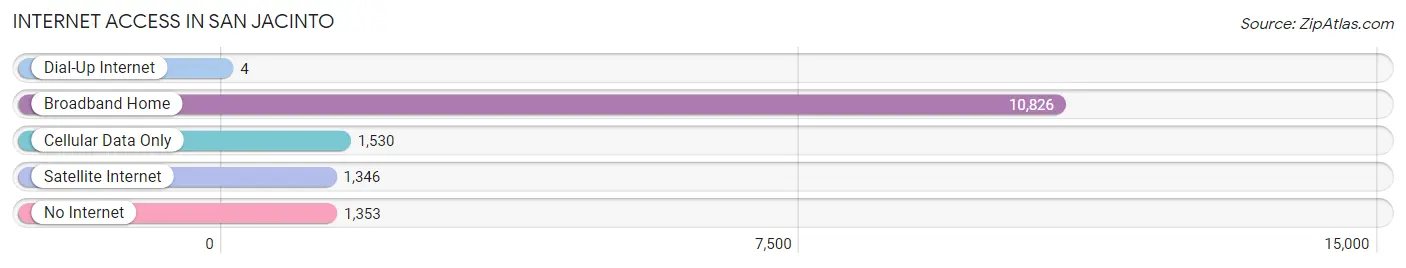
| Internet Type | # Households | % Households |
| Dial-Up Internet | 4 | 0.0% |
| Broadband Home | 10,826 | 75.0% |
| Cellular Data Only | 1,530 | 10.6% |
| Satellite Internet | 1,346 | 9.3% |
| No Internet | 1,353 | 9.4% |
| Total | 14,426 | 100.0% |
San Jacinto Summary
History
The city of San Jacinto, California is located in Riverside County, approximately 70 miles east of Los Angeles. The city was founded in 1870 by a group of settlers from San Diego, who named the city after the nearby San Jacinto Mountains. The city was originally a small agricultural community, with the main crops being citrus and grapes. The city was incorporated in 1888, and the first mayor was elected in 1889.
In the early 1900s, the city began to grow rapidly, as the population increased and new businesses were established. The city was home to several large citrus packing houses, as well as a number of other businesses. The city also became a popular tourist destination, as it was close to the San Jacinto Mountains and the nearby San Gorgonio Pass.
In the 1950s, the city began to experience a period of rapid growth, as new housing developments were built and the population increased. This growth continued into the 1960s and 1970s, as the city became a popular bedroom community for Los Angeles and Orange County.
Geography
San Jacinto is located in Riverside County, in the San Jacinto Valley. The city is situated at the base of the San Jacinto Mountains, and is bordered by the cities of Hemet and San Bernardino to the north, and the cities of Perris and Moreno Valley to the south. The city covers an area of approximately 18 square miles, and has an elevation of 1,200 feet.
The city is located in a semi-arid climate, with hot summers and mild winters. The average annual temperature is around 70 degrees Fahrenheit, and the average annual precipitation is around 10 inches.
Economy
San Jacinto’s economy is largely based on the service industry, with the largest employers being the local school district, the city government, and the local hospital. The city is also home to several manufacturing companies, including a large paper mill and a number of food processing plants.
The city is also home to several retail stores, including a Walmart Supercenter, a Target, and a number of other stores. The city is also home to a number of restaurants, including several fast food chains and several local restaurants.
Demographics
As of the 2010 census, the population of San Jacinto was 44,199. The racial makeup of the city was 68.3% White, 4.2% African American, 0.7% Native American, 1.3% Asian, 0.2% Pacific Islander, 22.2% from other races, and 3.3% from two or more races. Hispanic or Latino of any race were 44.2% of the population.
The median household income in the city was $45,845, and the median family income was $50,945. The per capita income in the city was $19,845. About 17.2% of the population was below the poverty line.
Common Questions
What is Per Capita Income in San Jacinto?
Per Capita income in San Jacinto is $24,560.
What is the Median Family Income in San Jacinto?
Median Family Income in San Jacinto is $79,560.
What is the Median Household income in San Jacinto?
Median Household Income in San Jacinto is $73,682.
What is Income or Wage Gap in San Jacinto?
Income or Wage Gap in San Jacinto is 21.8%.
Women in San Jacinto earn 78.2 cents for every dollar earned by a man.
What is Family Income Deficit in San Jacinto?
Family Income Deficit in San Jacinto is $12,007.
Families that are below poverty line in San Jacinto earn $12,007 less on average than the poverty threshold level.
What is Inequality or Gini Index in San Jacinto?
Inequality or Gini Index in San Jacinto is 0.40.
What is the Total Population of San Jacinto?
Total Population of San Jacinto is 54,077.
What is the Total Male Population of San Jacinto?
Total Male Population of San Jacinto is 27,236.
What is the Total Female Population of San Jacinto?
Total Female Population of San Jacinto is 26,841.
What is the Ratio of Males per 100 Females in San Jacinto?
There are 101.47 Males per 100 Females in San Jacinto.
What is the Ratio of Females per 100 Males in San Jacinto?
There are 98.55 Females per 100 Males in San Jacinto.
What is the Median Population Age in San Jacinto?
Median Population Age in San Jacinto is 31.3 Years.
What is the Average Family Size in San Jacinto
Average Family Size in San Jacinto is 4.2 People.
What is the Average Household Size in San Jacinto
Average Household Size in San Jacinto is 3.7 People.
How Large is the Labor Force in San Jacinto?
There are 23,526 People in the Labor Forcein in San Jacinto.
What is the Percentage of People in the Labor Force in San Jacinto?
58.3% of People are in the Labor Force in San Jacinto.
What is the Unemployment Rate in San Jacinto?
Unemployment Rate in San Jacinto is 8.3%.