Zip Codes with the Highest Percentage of Population Employed in Farming, Fishing & Forestry in Porterville, CA
RELATED REPORTS & OPTIONS
Farming, Fishing & Forestry
Porterville
Compare Zip Codes
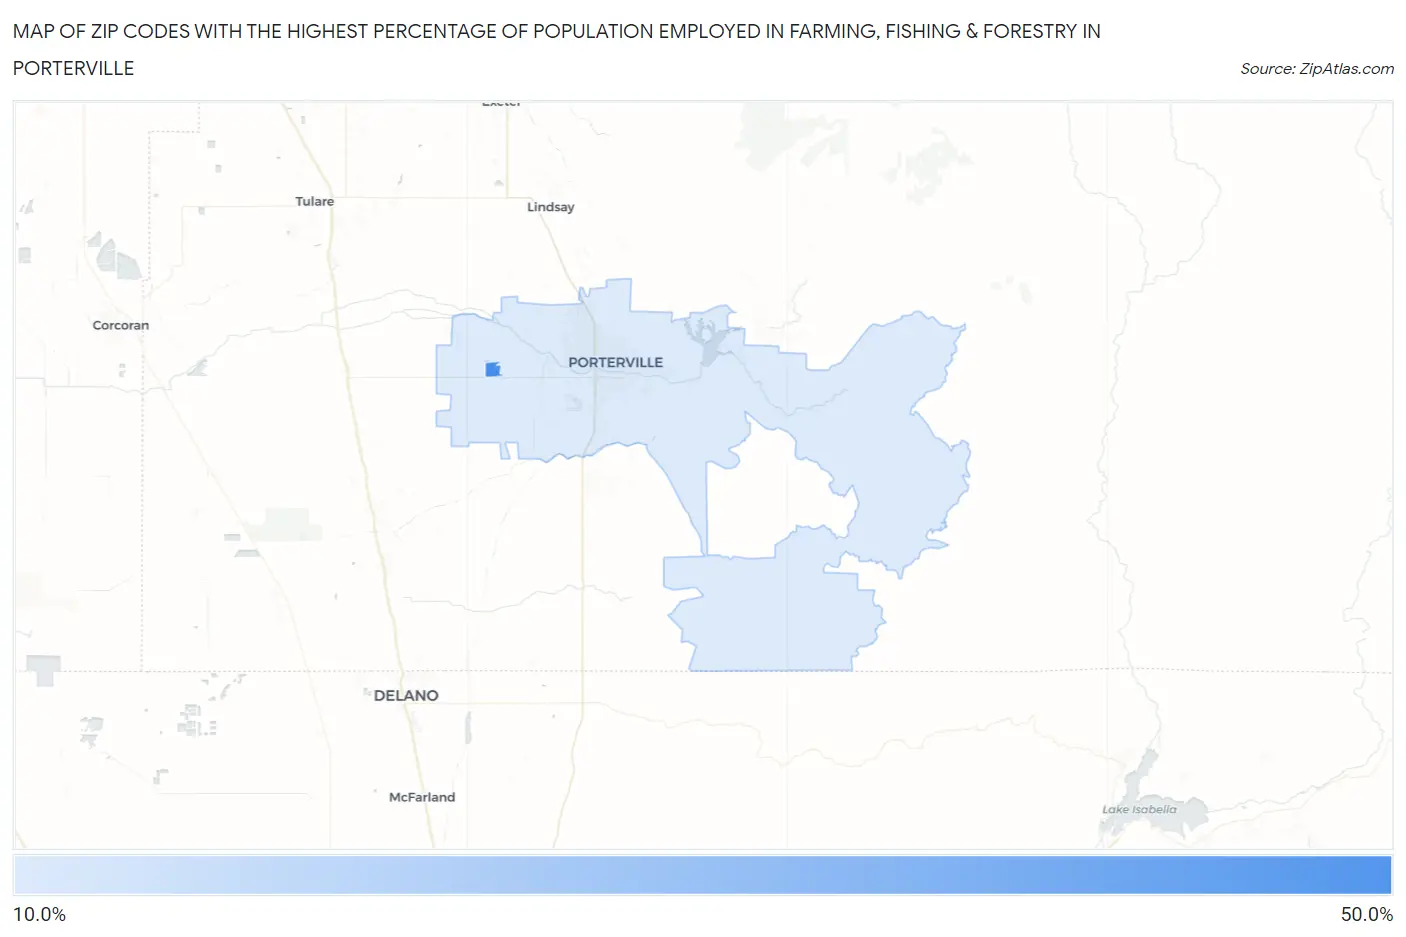
Map of Zip Codes with the Highest Percentage of Population Employed in Farming, Fishing & Forestry in Porterville
16.4%
42.6%
Zip Codes with the Highest Percentage of Population Employed in Farming, Fishing & Forestry in Porterville, CA
| Zip Code | % Employed | vs State | vs National | |
| 1. | 93258 | 42.6% | 1.4%(+41.2)#16 | 0.61%(+42.0)#88 |
| 2. | 93257 | 16.4% | 1.4%(+15.0)#99 | 0.61%(+15.8)#566 |
1
Common Questions
What are the Top Zip Codes with the Highest Percentage of Population Employed in Farming, Fishing & Forestry in Porterville, CA?
Top Zip Codes with the Highest Percentage of Population Employed in Farming, Fishing & Forestry in Porterville, CA are:
What zip code has the Highest Percentage of Population Employed in Farming, Fishing & Forestry in Porterville, CA?
93258 has the Highest Percentage of Population Employed in Farming, Fishing & Forestry in Porterville, CA with 42.6%.
What is the Percentage of Population Employed in Farming, Fishing & Forestry in Porterville, CA?
Percentage of Population Employed in Farming, Fishing & Forestry in Porterville is 13.4%.
What is the Percentage of Population Employed in Farming, Fishing & Forestry in California?
Percentage of Population Employed in Farming, Fishing & Forestry in California is 1.4%.
What is the Percentage of Population Employed in Farming, Fishing & Forestry in the United States?
Percentage of Population Employed in Farming, Fishing & Forestry in the United States is 0.61%.