Zip Codes with the Highest Percentage of Population Employed in Accommodation & Food Services in Porterville, CA
RELATED REPORTS & OPTIONS
Accommodation & Food Services
Porterville
Compare Zip Codes
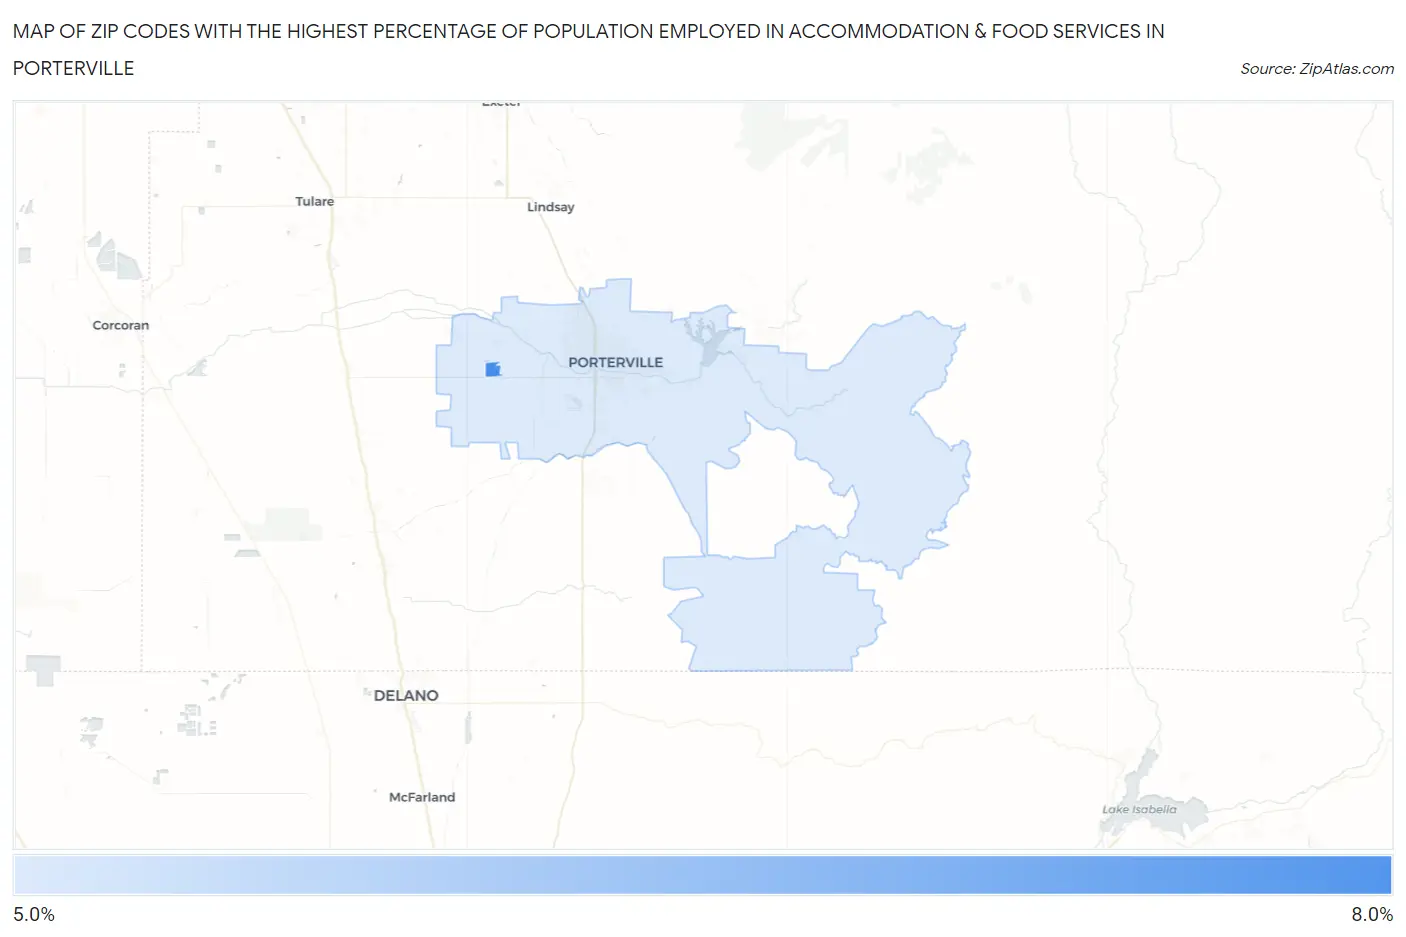
Map of Zip Codes with the Highest Percentage of Population Employed in Accommodation & Food Services in Porterville
5.9%
7.8%
Zip Codes with the Highest Percentage of Population Employed in Accommodation & Food Services in Porterville, CA
| Zip Code | % Employed | vs State | vs National | |
| 1. | 93258 | 7.8% | 7.2%(+0.677)#552 | 6.9%(+0.967)#8,155 |
| 2. | 93257 | 5.9% | 7.2%(-1.25)#946 | 6.9%(-0.961)#13,714 |
1
Common Questions
What are the Top Zip Codes with the Highest Percentage of Population Employed in Accommodation & Food Services in Porterville, CA?
Top Zip Codes with the Highest Percentage of Population Employed in Accommodation & Food Services in Porterville, CA are:
What zip code has the Highest Percentage of Population Employed in Accommodation & Food Services in Porterville, CA?
93258 has the Highest Percentage of Population Employed in Accommodation & Food Services in Porterville, CA with 7.8%.
What is the Percentage of Population Employed in Accommodation & Food Services in Porterville, CA?
Percentage of Population Employed in Accommodation & Food Services in Porterville is 6.0%.
What is the Percentage of Population Employed in Accommodation & Food Services in California?
Percentage of Population Employed in Accommodation & Food Services in California is 7.2%.
What is the Percentage of Population Employed in Accommodation & Food Services in the United States?
Percentage of Population Employed in Accommodation & Food Services in the United States is 6.9%.