Zip Codes with the Highest Percentage of Renter-Occupied Units in Porterville, CA
RELATED REPORTS & OPTIONS
Highest Renter-Occupied
Porterville
Compare Zip Codes
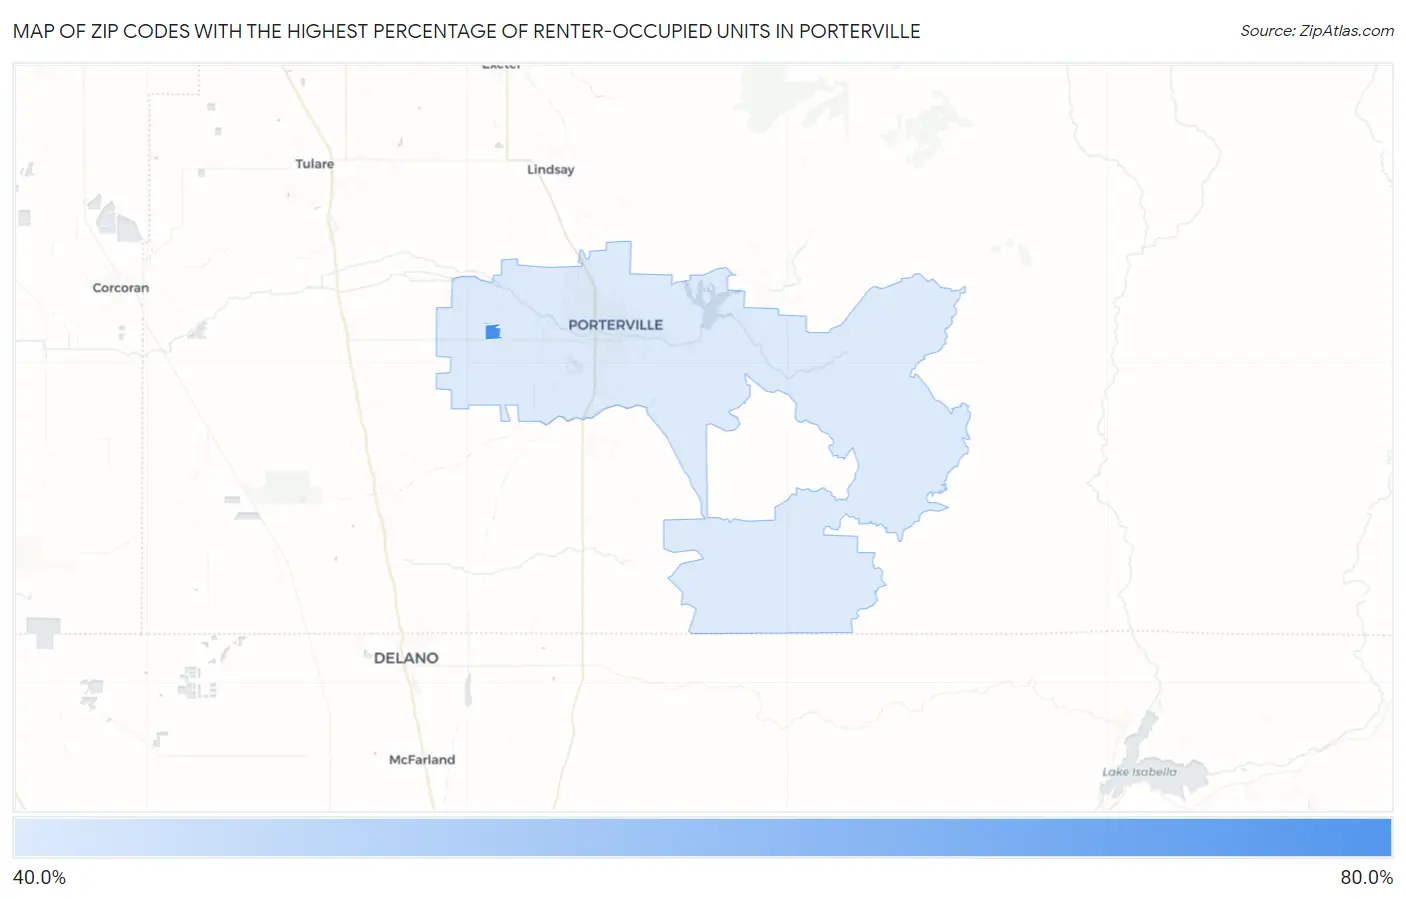
Map of Zip Codes with the Highest Percentage of Renter-Occupied Units in Porterville
43.9%
77.5%
Zip Codes with the Highest Percentage of Renter-Occupied Units in Porterville, CA
| Zip Code | % Renter-Occupied | vs State | vs National | |
| 1. | 93258 | 77.5% | 44.4%(+33.2)#102 | 35.2%(+42.4)#758 |
| 2. | 93257 | 43.9% | 44.4%(-0.454)#627 | 35.2%(+8.73)#4,339 |
1
Common Questions
What are the Top Zip Codes with the Highest Percentage of Renter-Occupied Units in Porterville, CA?
Top Zip Codes with the Highest Percentage of Renter-Occupied Units in Porterville, CA are:
What zip code has the Highest Percentage of Renter-Occupied Units in Porterville, CA?
93258 has the Highest Percentage of Renter-Occupied Units in Porterville, CA with 77.5%.
What is the Percentage of Renter-Occupied Units in Porterville, CA?
Percentage of Renter-Occupied Units in Porterville is 45.0%.
What is the Percentage of Renter-Occupied Units in California?
Percentage of Renter-Occupied Units in California is 44.4%.
What is the Percentage of Renter-Occupied Units in the United States?
Percentage of Renter-Occupied Units in the United States is 35.2%.