Zip Codes with the Highest Percentage of Population Employed in Accommodation & Food Services in Madera, CA
RELATED REPORTS & OPTIONS
Accommodation & Food Services
Madera
Compare Zip Codes
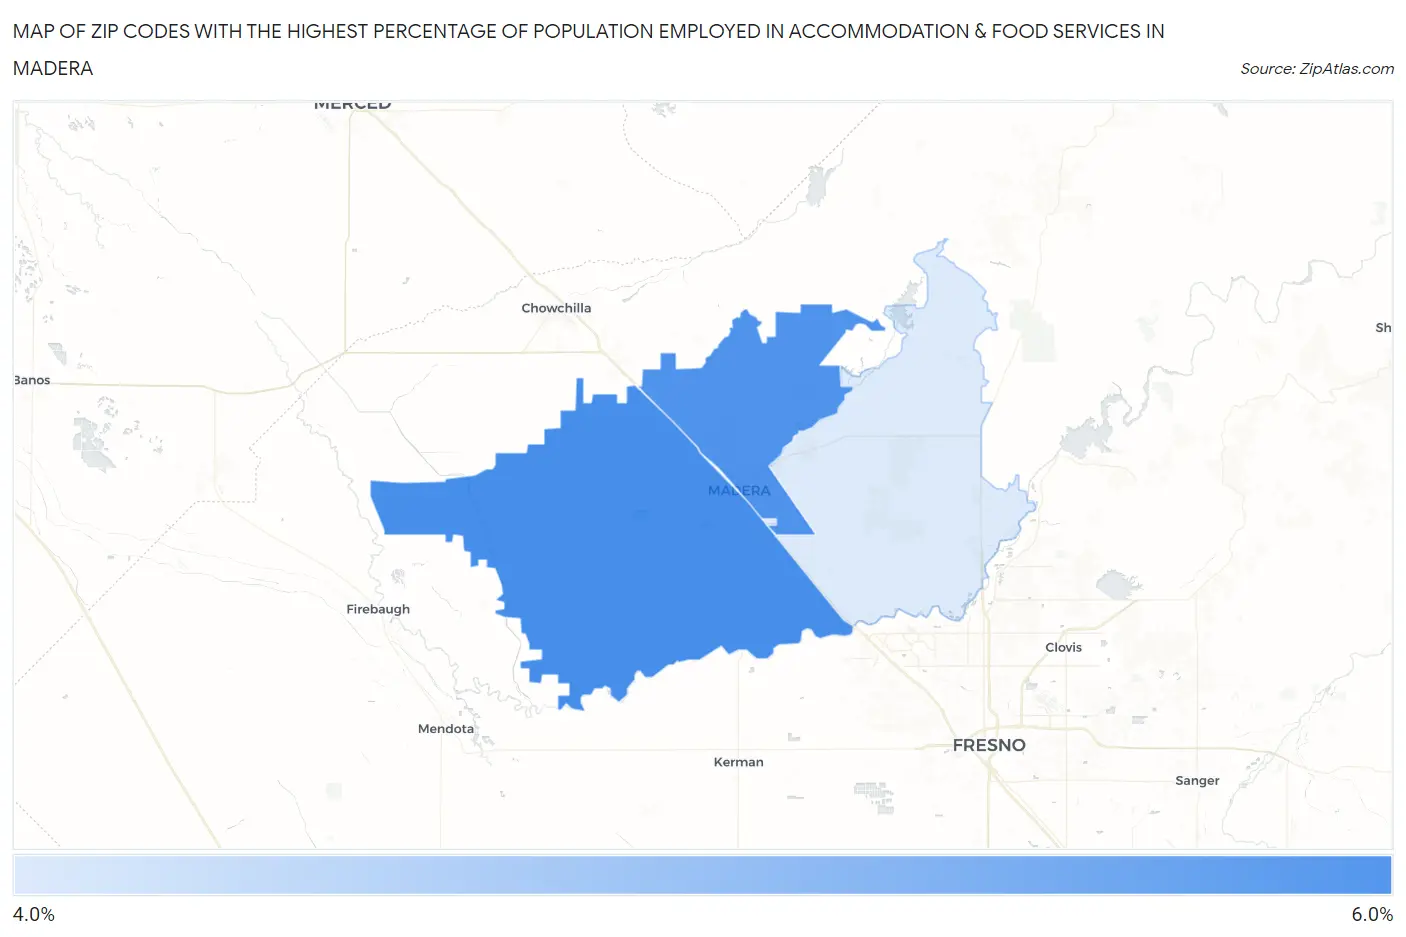
Map of Zip Codes with the Highest Percentage of Population Employed in Accommodation & Food Services in Madera
4.2%
5.3%
Zip Codes with the Highest Percentage of Population Employed in Accommodation & Food Services in Madera, CA
| Zip Code | % Employed | vs State | vs National | |
| 1. | 93637 | 5.3% | 7.2%(-1.91)#1,075 | 6.9%(-1.62)#15,927 |
| 2. | 93638 | 5.2% | 7.2%(-1.97)#1,085 | 6.9%(-1.68)#16,098 |
| 3. | 93636 | 4.2% | 7.2%(-2.99)#1,264 | 6.9%(-2.70)#19,584 |
1
Common Questions
What are the Top Zip Codes with the Highest Percentage of Population Employed in Accommodation & Food Services in Madera, CA?
Top Zip Codes with the Highest Percentage of Population Employed in Accommodation & Food Services in Madera, CA are:
What zip code has the Highest Percentage of Population Employed in Accommodation & Food Services in Madera, CA?
93637 has the Highest Percentage of Population Employed in Accommodation & Food Services in Madera, CA with 5.3%.
What is the Percentage of Population Employed in Accommodation & Food Services in Madera, CA?
Percentage of Population Employed in Accommodation & Food Services in Madera is 5.0%.
What is the Percentage of Population Employed in Accommodation & Food Services in California?
Percentage of Population Employed in Accommodation & Food Services in California is 7.2%.
What is the Percentage of Population Employed in Accommodation & Food Services in the United States?
Percentage of Population Employed in Accommodation & Food Services in the United States is 6.9%.